
Calculate Metric Task
What's on this page
About the Calculate Metric Task
The Calculate Metric task lets you trigger a response to metric changes calculated in a dataset over a period of time. In other words, you can set up automated workflows based on trends or events you observe in experience data. The results of your calculate metric task can be used to trigger other tasks within your workflow. For example, you can notify your marketing team’s Slack channel when your brand NPS dips by 10% within a period of a week, or you can create a follow-up ticket for your team if more than 100 opt-outs occur in XM Directory within a week.
Setting Up a Calculate Metric Task
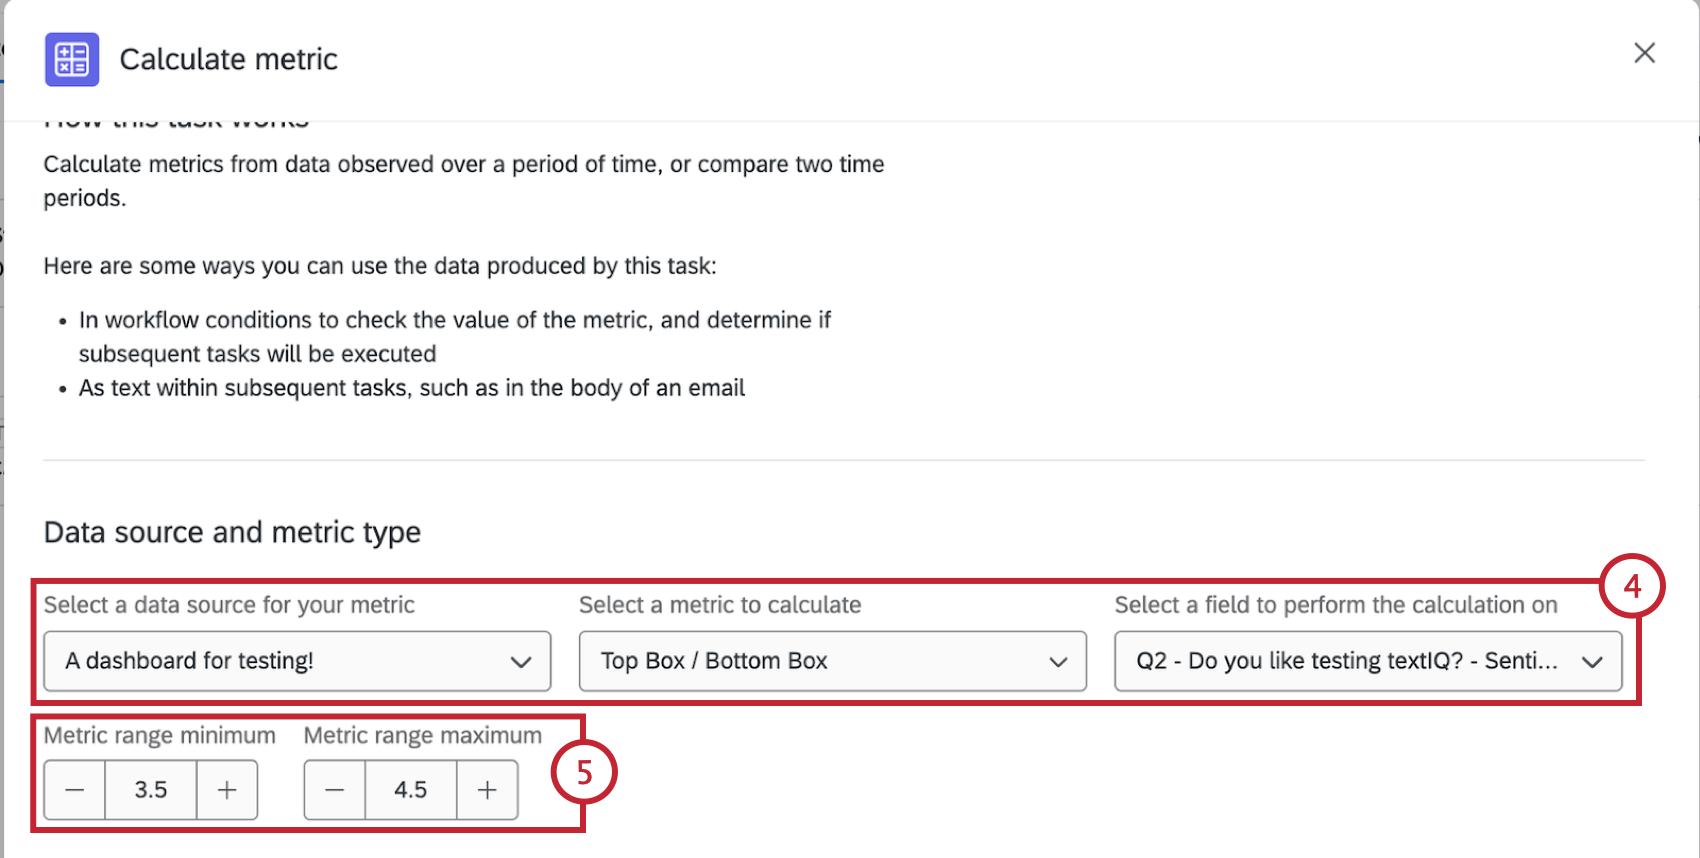
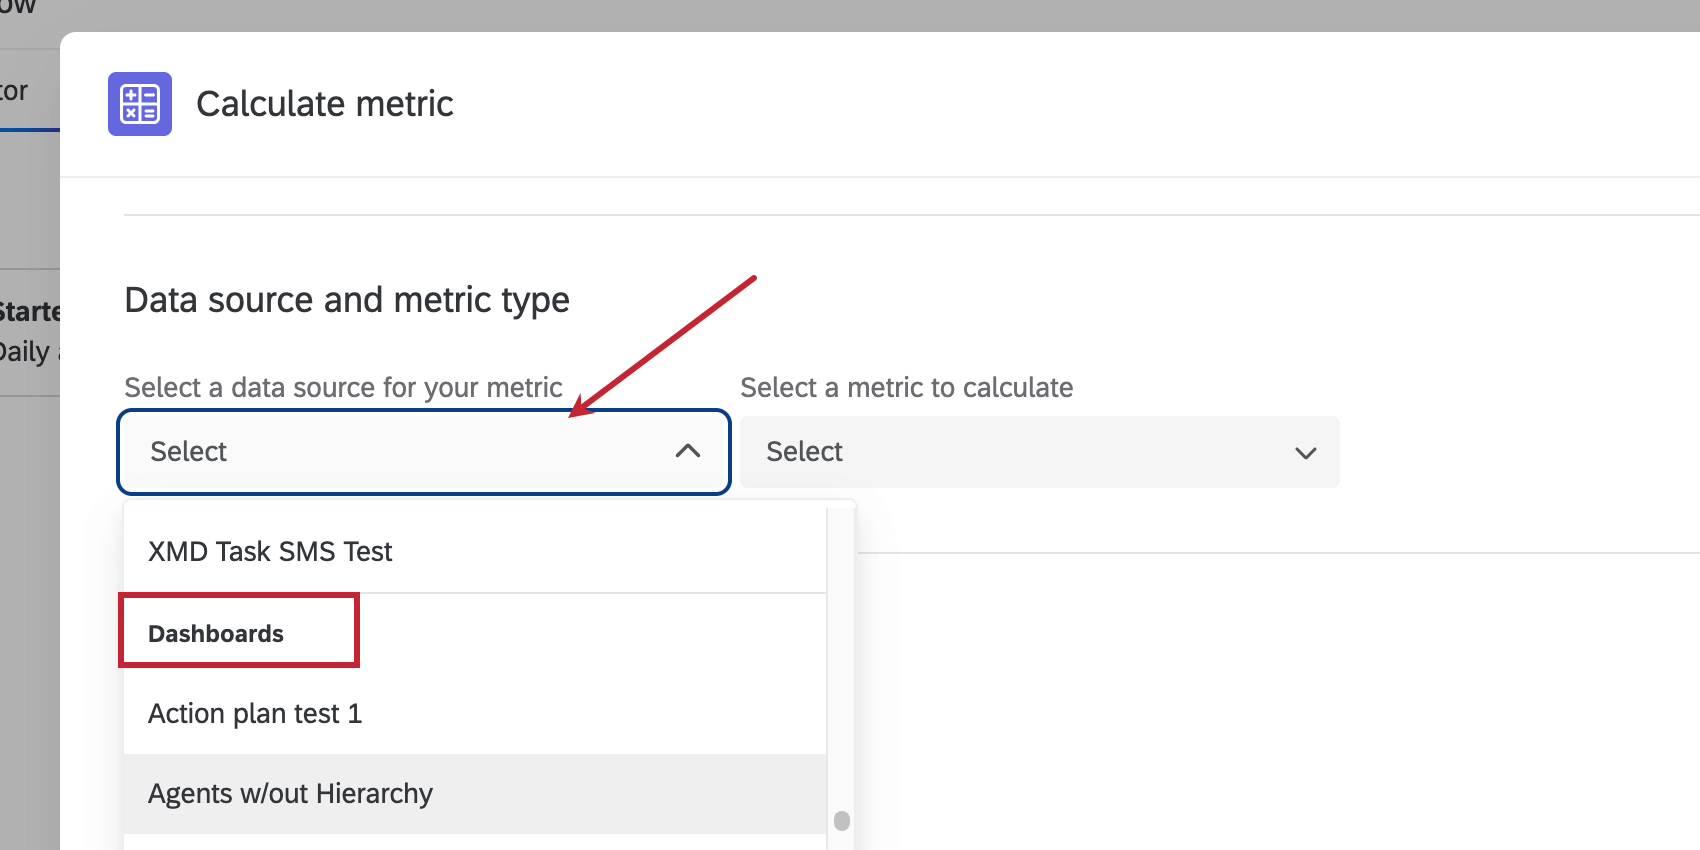
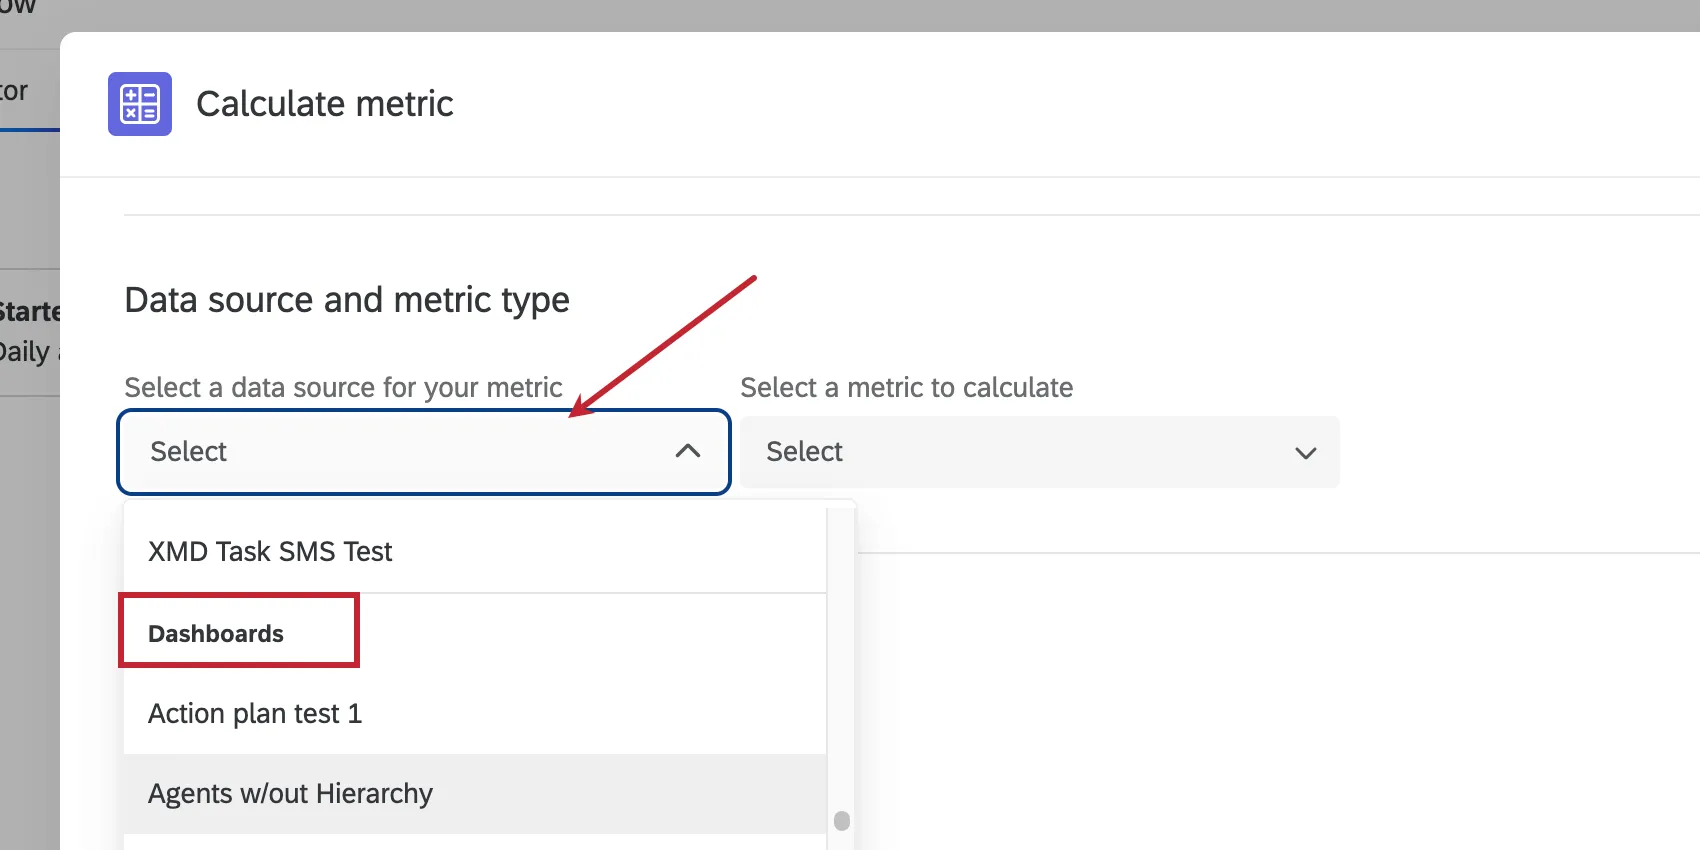
- Source: The survey or dashboard that hosts the data you will be calculating your metric from. All of your available surveys and dashboards will appear in the dropdown. The following project types are eligible:
- Survey
- 360 (survey only, no dashboard)
- Ad Hoc Employee Research (survey only, no dashboard)
- Engagement (survey only, no dashboard)
- Lifecycle (survey only, no dashboard)
- Pulse (survey only, no dashboard)
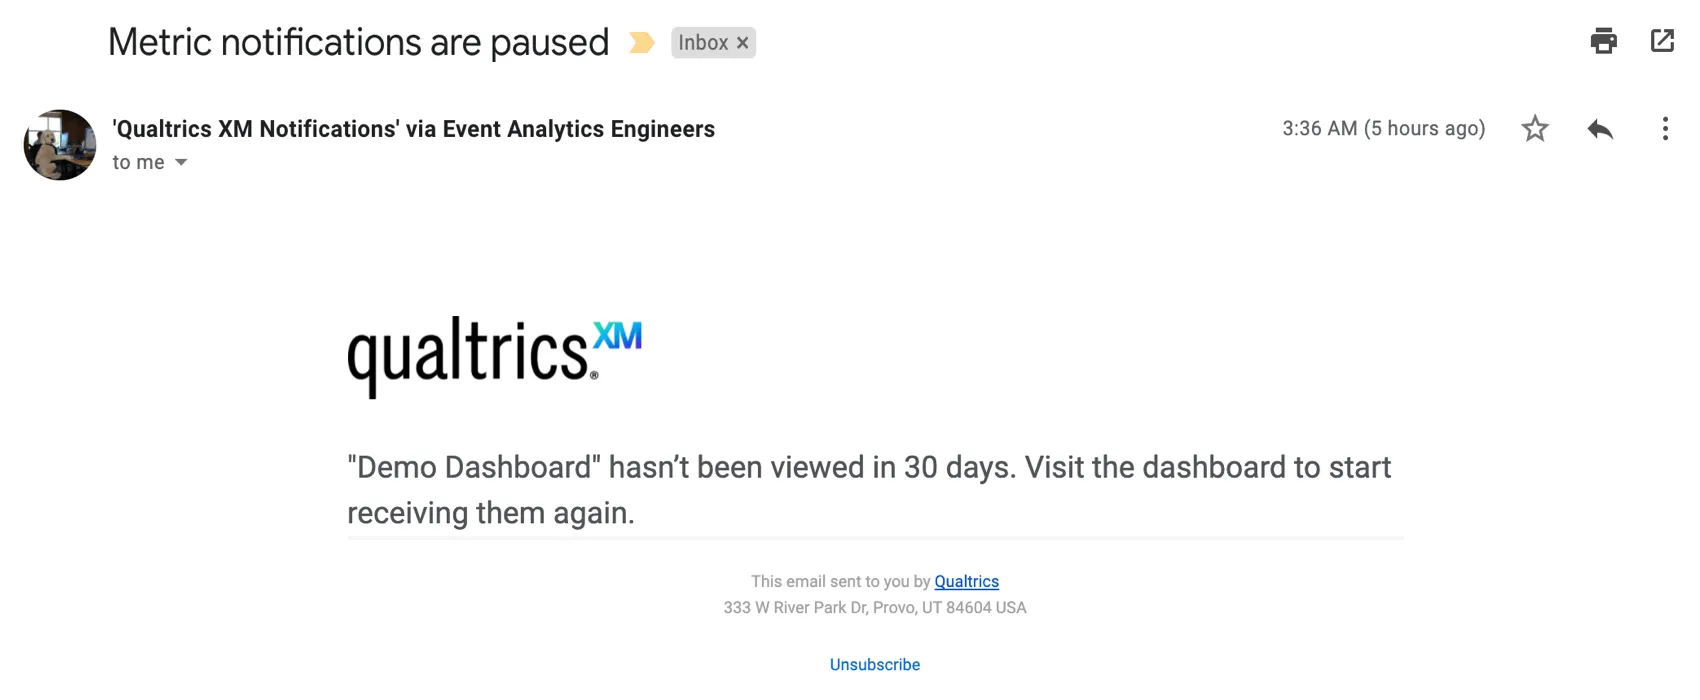
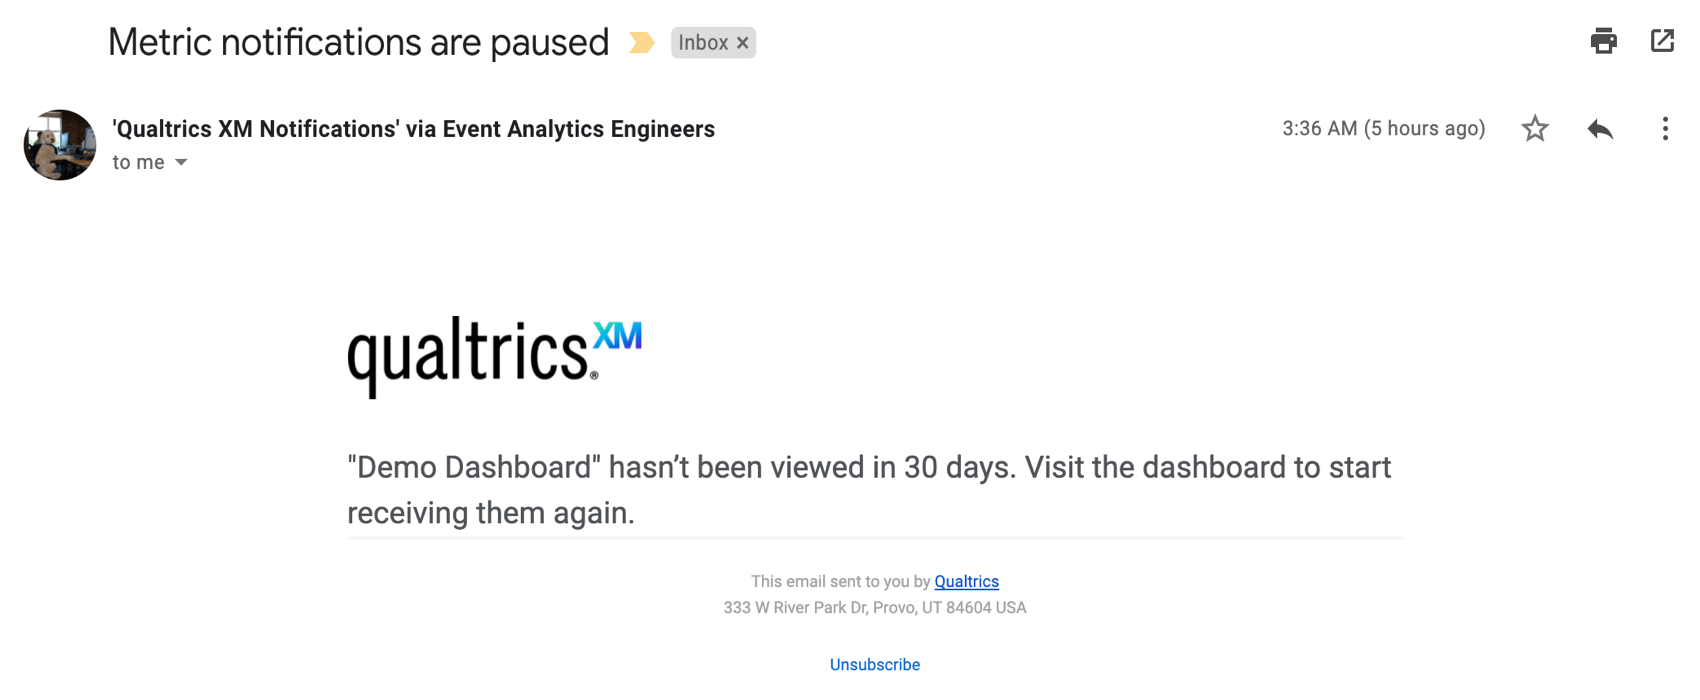
- Dashboards (CX) Attention: If you are using a dashboard as your source, make sure that the dashboard has been visited at least once in the last 30 days. If it’s been close to 30 days since the dashboard was last visited, you will receive a warning message via email to the email address associated with your Qualtrics account.

- Metric: The type of metric you’ll be calculating based on. Choose from the following metric types:
- Count of records: Display response counts from the selected fields (i.e., number of respondents choosing a value in a five-point scale).
- Average: Exhibit the average value for a selected field.
- NPS: Net Promoter Score. Identify the Detractors, Passives, and Promoters from NPS questions.
- Field: The specific field or question you will be calculating your metric on. This field does not appear if you select “count of records” as your metric type.
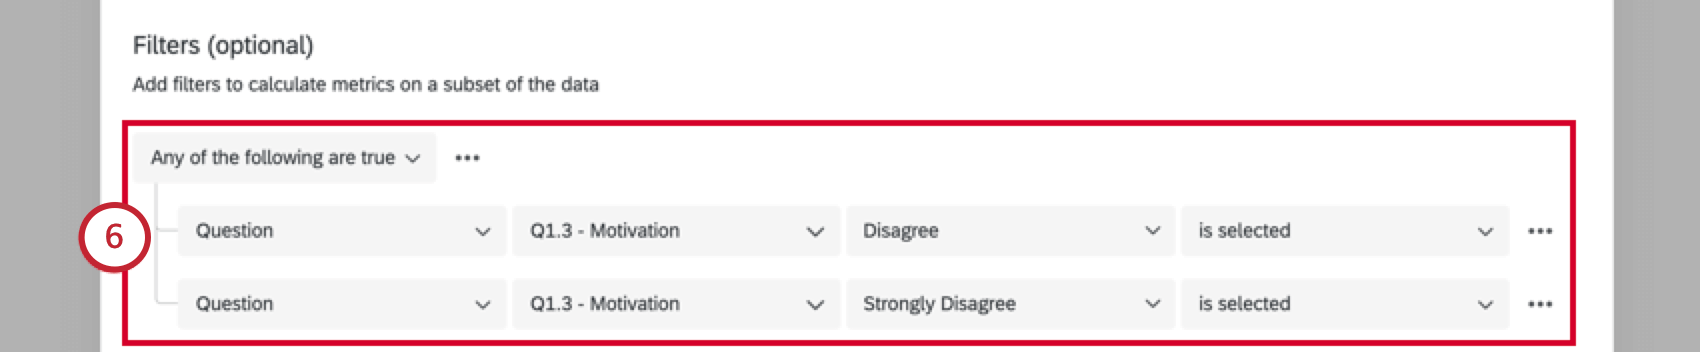
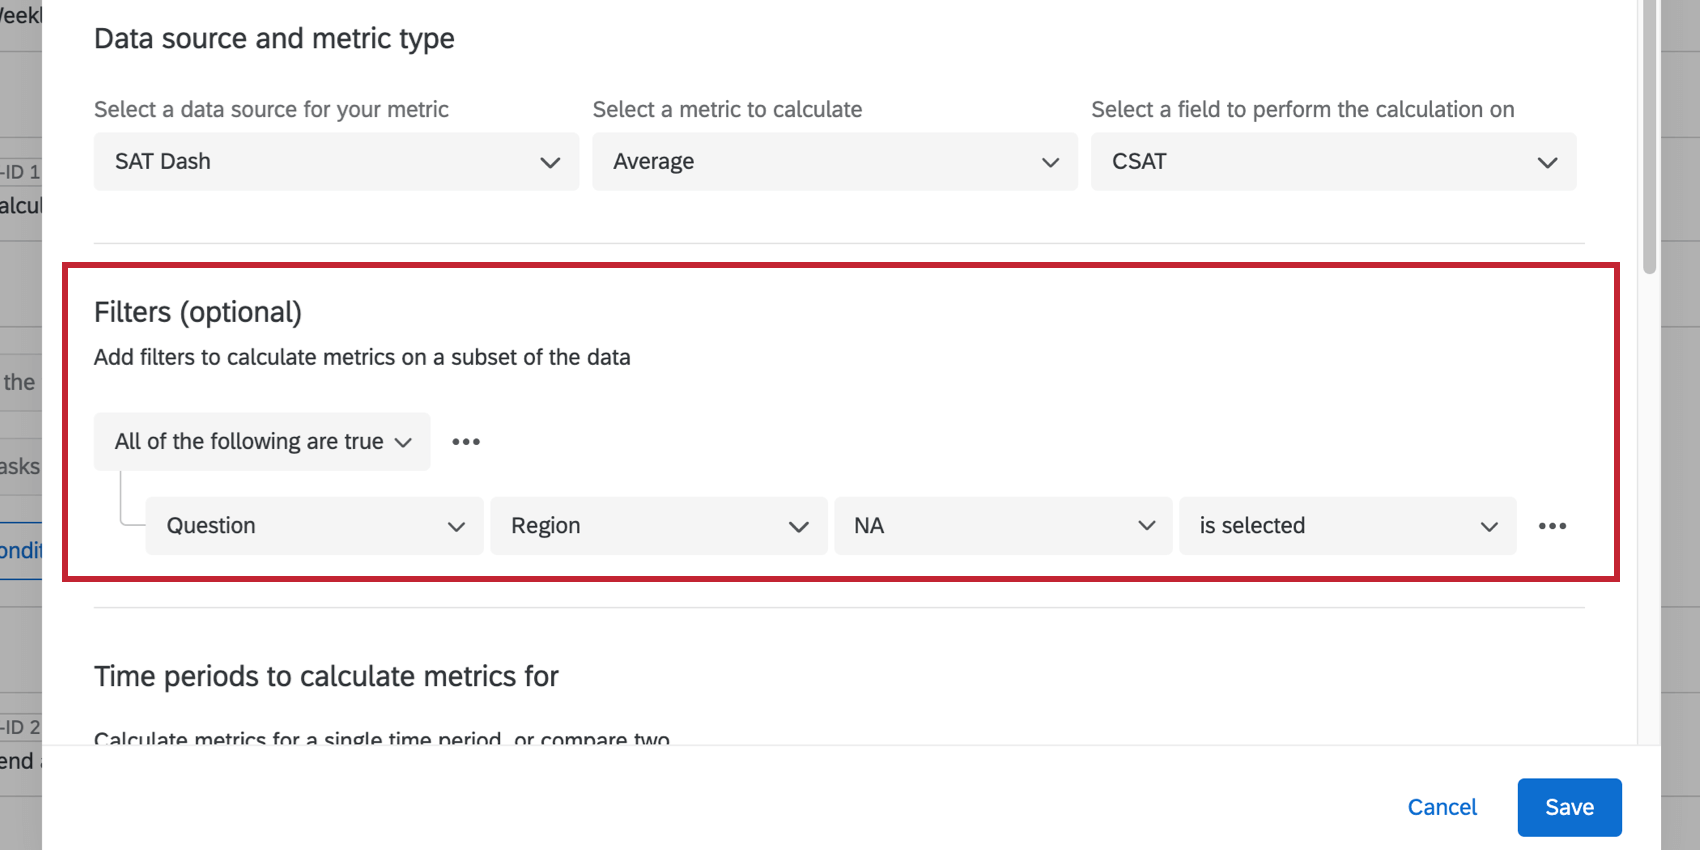
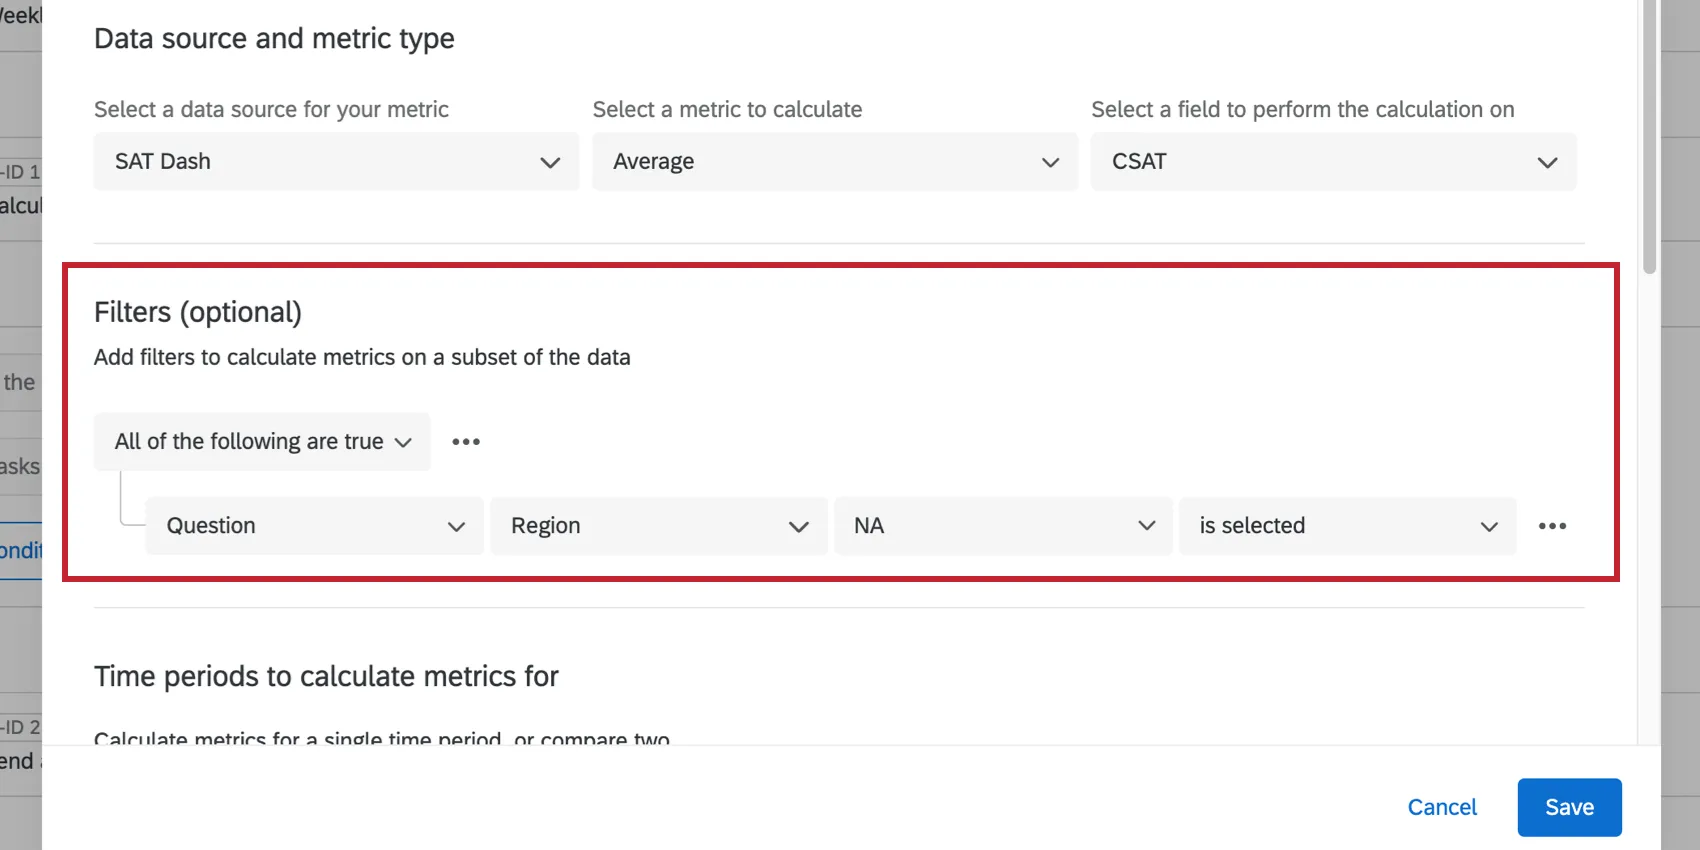
Attention: Some of the resources for condition building use examples in data filtering instead of Workflows. However, the logic behind these conditions are the same.
Qtip: When setting up the choice field in your filter you have the option to use piped text from your selected survey. Piped text is only available for multiple choice questions and text entry questions.
Qtip: If you’re using a dashboard data source, all fields will be listed under Question.
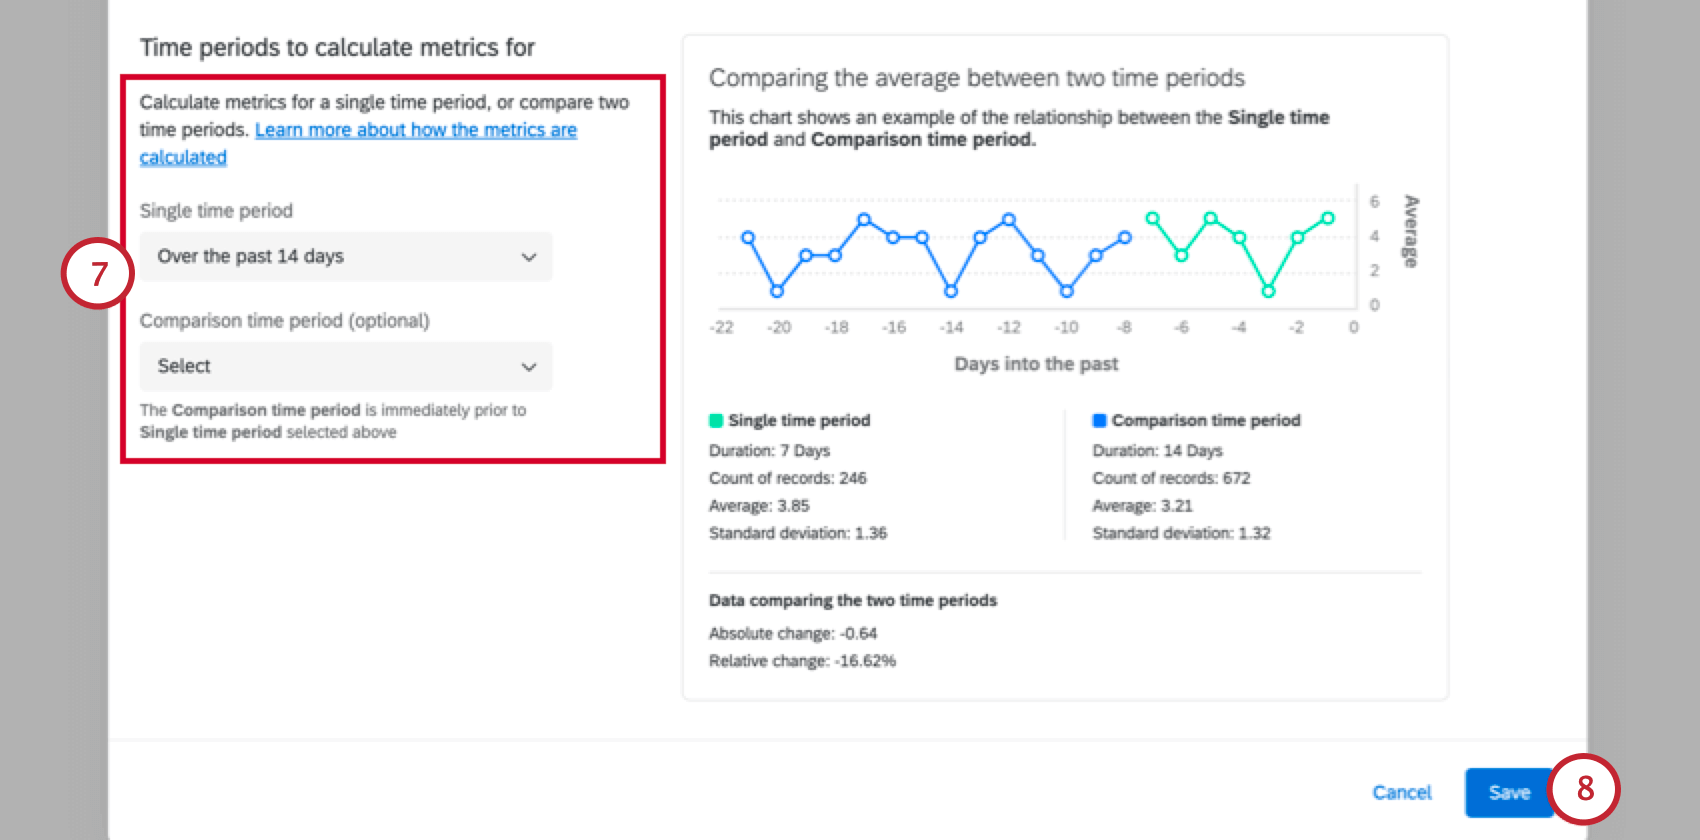
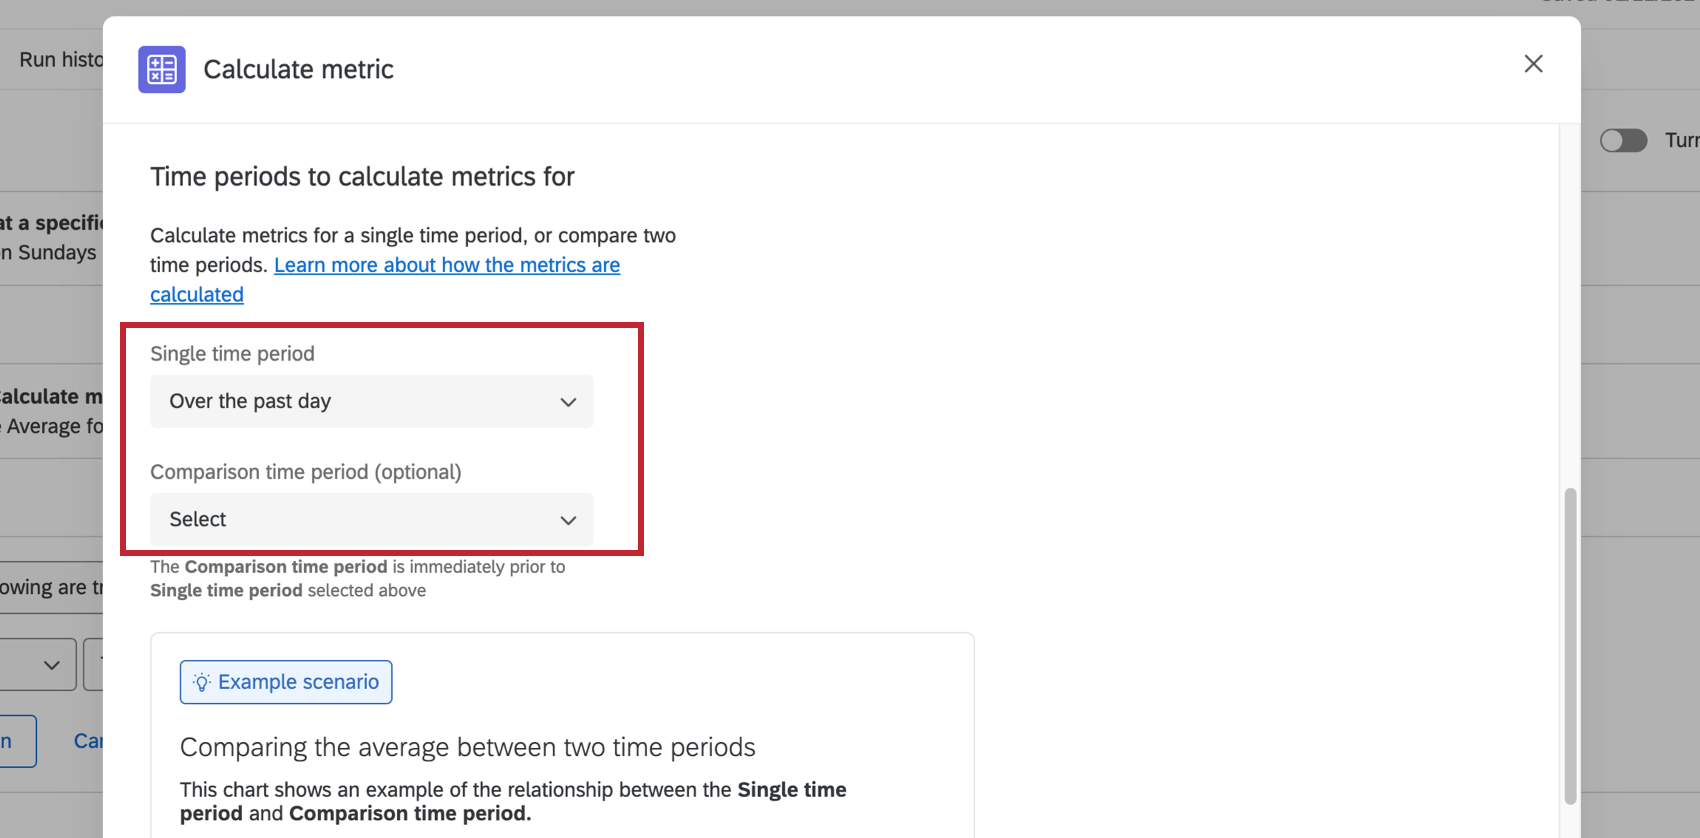
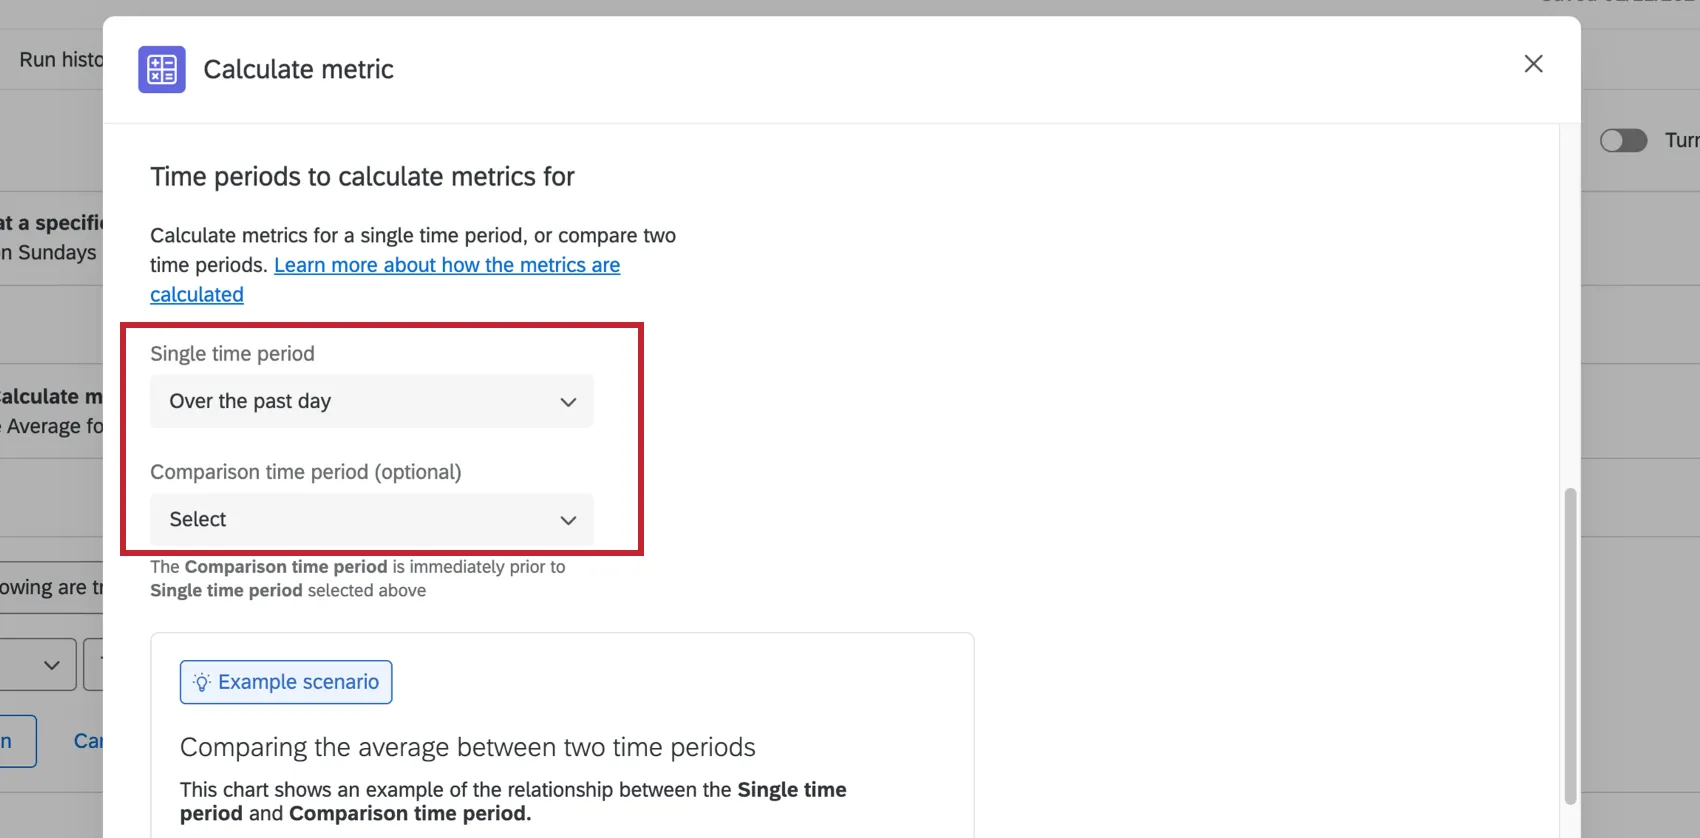
- Single time period: The metric will be calculated using data from the chosen time period.
- Comparison time period: This period is optional. If you select a comparison time period, the metric will be calculated using a comparison between your chosen time periods. The comparison time period is immediately prior to the single time period specified above. Example: For example, let’s say you’re calculating an average score and your single time period = “over the past day” and comparison time period = “previous 14 days.” If your workflow runs on August 27th at 10:00 AM, then the single time period will be from 10:00 AM August 26th to 10:00 AM August 27th. The comparison time period will be August 12th at 10:00 AM to August 26th at 10:00 AM.
 Qtip: Check out the graph inside the task for an example comparing these two time periods and the resulting calculation for each. Please note that this graph is a static visual representation and will not dynamically change based on your data.
 Qtip: The time period is calculated based on the recorded date.
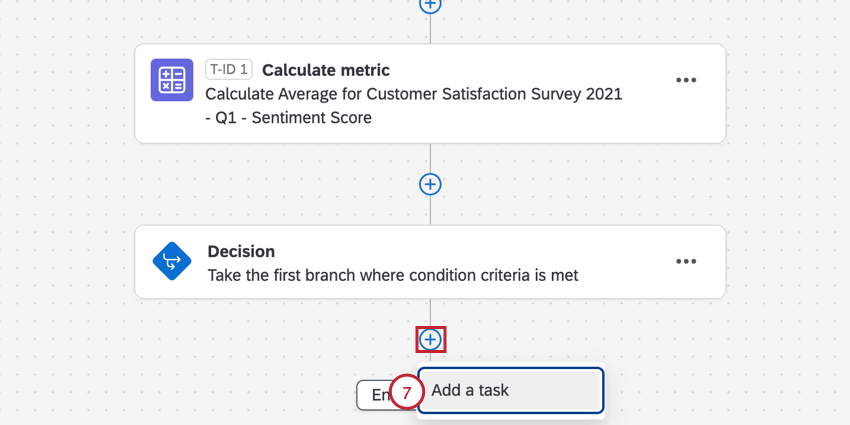
Attention: After completing the above steps, you must create subsequent tasks in order to use the results of the calculate metric task.
Attention: We recommend that you do not have more than 1 execution per hour for a given calculate metric workflow.
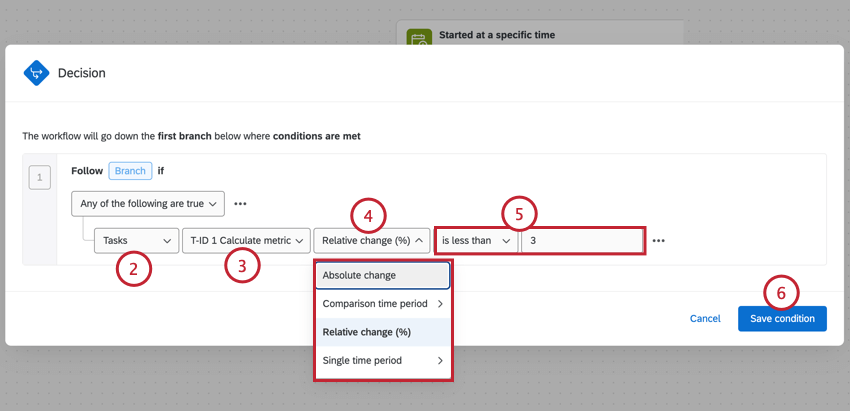
Adding Tasks and Conditions
After setting up your calculate metric task, add conditions and tasks to decide what happens next. Conditions act as thresholds; for example, specifying how much a metric should rise or drop before notifying a team. Tasks determine what specifically happens next; for example, sending an email or a Slack message.
Qtip: It’s not required to create a condition for a calculate metric task. For example, if you wanted to create a weekly report with the results of your calculate metric task, you wouldn’t need to add a condition.
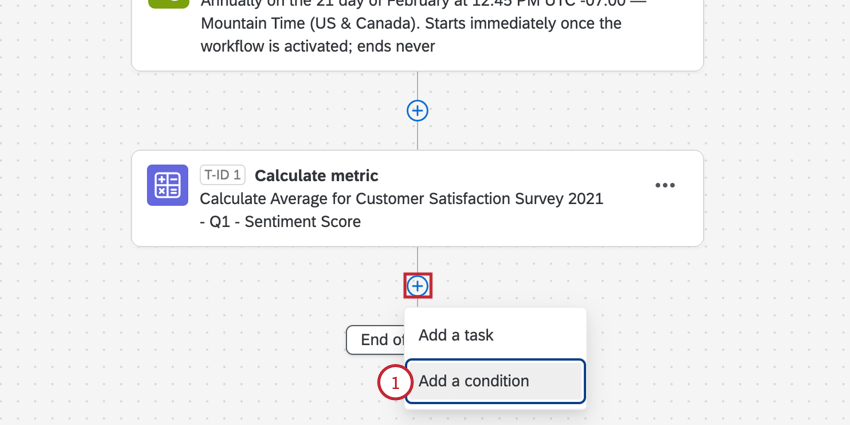
Qtip: See Creating Conditions for more help with building conditions
Qtip: You’ll see the tasks’s ID in this step. This can be helpful if you’re adding multiple calculate metric tasks to a workflow.
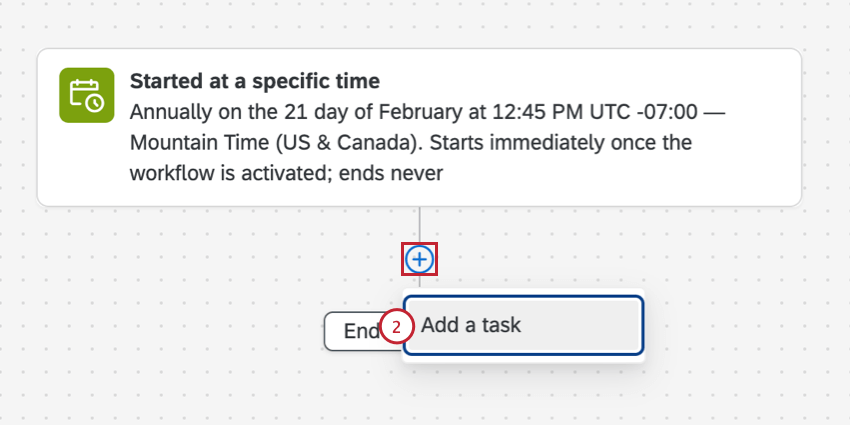
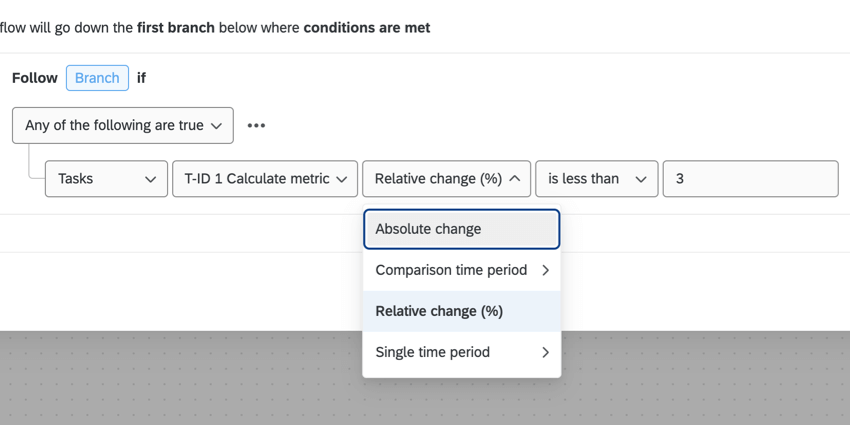
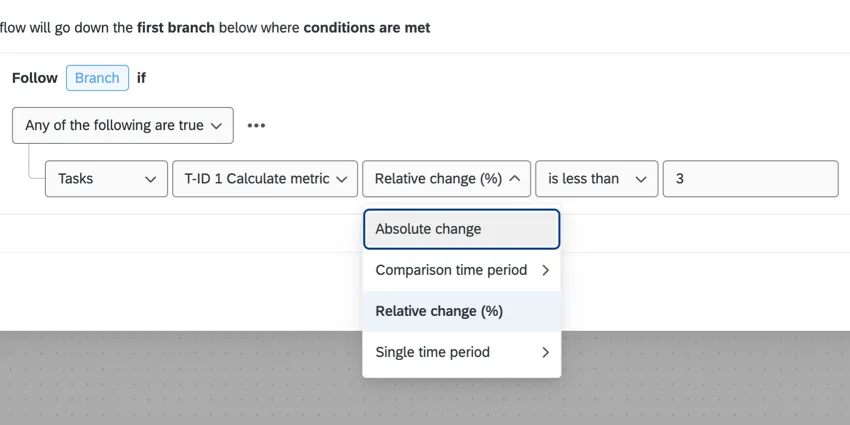
Example: In the screenshot above, we want to trigger a workflow whenever our metric changes by 3 or more percentage points. This change is measured over an initial and comparison time period defined during setup.
Qtip: Each tasks are labeled with a unique ID (e.g., “T-ID 1,” “T-ID 2”) for easier identification and organization. If you add a calculate metric task after an email task, but you’re piping the results of the calculate metric task into your email task, the tasks will be automatically reordered so that they are in the correct order.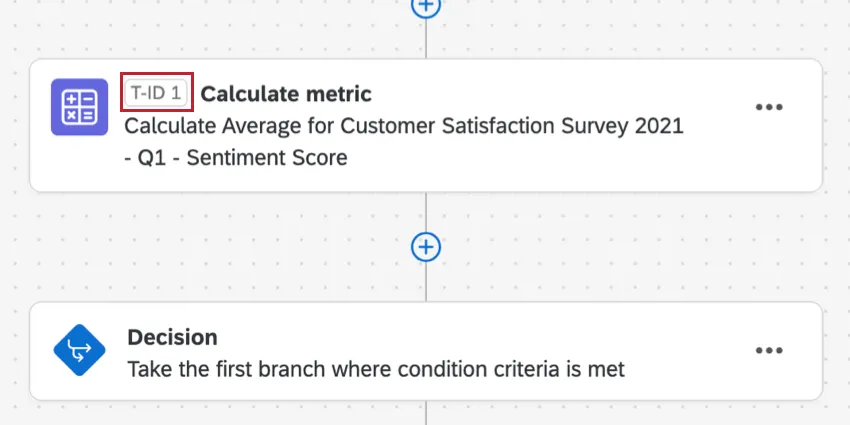

Qtip: You can also use piped text to report the results from the calculate metric task in subsequent tasks. For example, if you wanted to include information about your calculate metric task in a subsequent email task, the results from the calculate metric task will be available in the piped text portion of the rich content editor.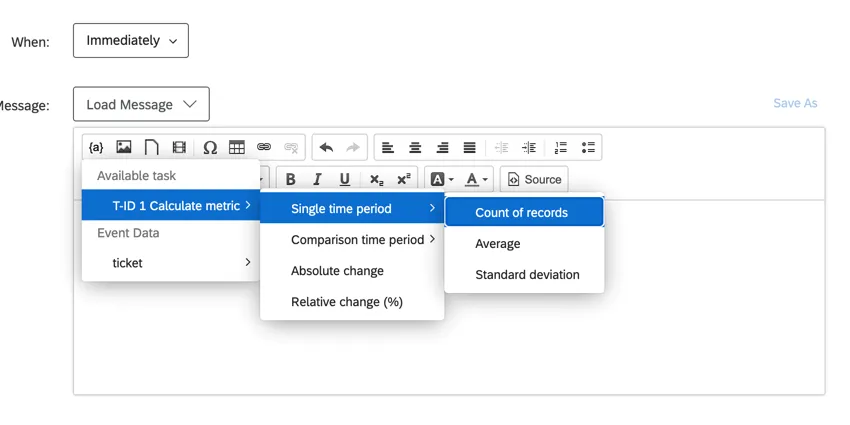

When Calculate Metric Tasks Are Completed
All types of survey responses can cause changes to the metrics calculated in a calculate metric task. This will cause subsequent tasks to trigger under certain conditions.
Options differ based on whether you chose only a single time period, or also added a comparison time period.
When only a single time period is defined
- Average: Calculate a threshold based on an average / mean metric.
- Count of records: Calculate the number of responses collected for this metric, regardless of the metric’s actual score.
- Standard deviation: Calculate the standard deviation for the metric.
When a comparison time period is defined
- Absolute change: The aggregate data from the first time period subtracted from the aggregate from the second time period.
- Comparison time period: If you configure the calculate metric task with the Change over a period of time option, this is the group of output values from the second time period you set in your task.
- Relative change (%): The aggregate data from the first time period subtracted from the aggregate from the second time period, divided by your aggregate from the second time period.
- Single time period: If you configure your calculate metric task with the Change over a period of time option, this will be the output values from the initial time period you set in your task.
Qtip: If you decide to select either the Single or Comparison time period, you can then select the Average, Count of records, or Standard deviation of your metric.
Attention: Once a workflow is completed, the scheduled task cannot be deleted. For example, if a response just submitted meets the condition of an email task, and you go to delete the email task, the email for that response is still scheduled.
Troubleshooting Calculate Metric Tasks
This section has links to additional resources that can help you troubleshoot issues related to email tasks.
- Identifying Whether Calculate Metric Tasks Failed: Workflows reporting allows you to check on the status of tasks in your survey, and identify whether they succeeded. This troubleshooting tool is best for checking on issues on the task setup side, and will not help you dig deeper into email deliverability issues, such as invalid recipients.
- Troubleshooting Conditions: The way a condition on an task is worded can change when the task is executed. First, remember to check the general rules for who receives email tasks, and when. If you need help troubleshooting the way conditions are written, check out these resources:
Qtip: Some of the resources for condition-building use examples in data filtering instead of Workflows. However, the logic behind these conditions are the same.
Filtering by Dashboard Data
When you set up your task, you can base a metric off of data in a survey or off data in a dashboard.
If you choose to base your metric off dashboard data, there are a few things you should know before you add a filter to your task.
Make sure all of the data you want to use in this task is mapped to your dashboard. Also make sure to choose the best type for each field. For example, questions scored on a scale should be number sets, whereas options in a list should be text set.
All dashboard data is listed under Question, not Embedded Data. It doesn’t matter what type of data each field originally was in the survey; they’re all listed under “Question” for dashboards.
The values you want to filter with might not immediately appear. First, make sure you’ve collected data for the missing values. If you have, it’s time to recode the field.
For the field you want to break out by, make sure you define each of the values you want to use in the recode editor.
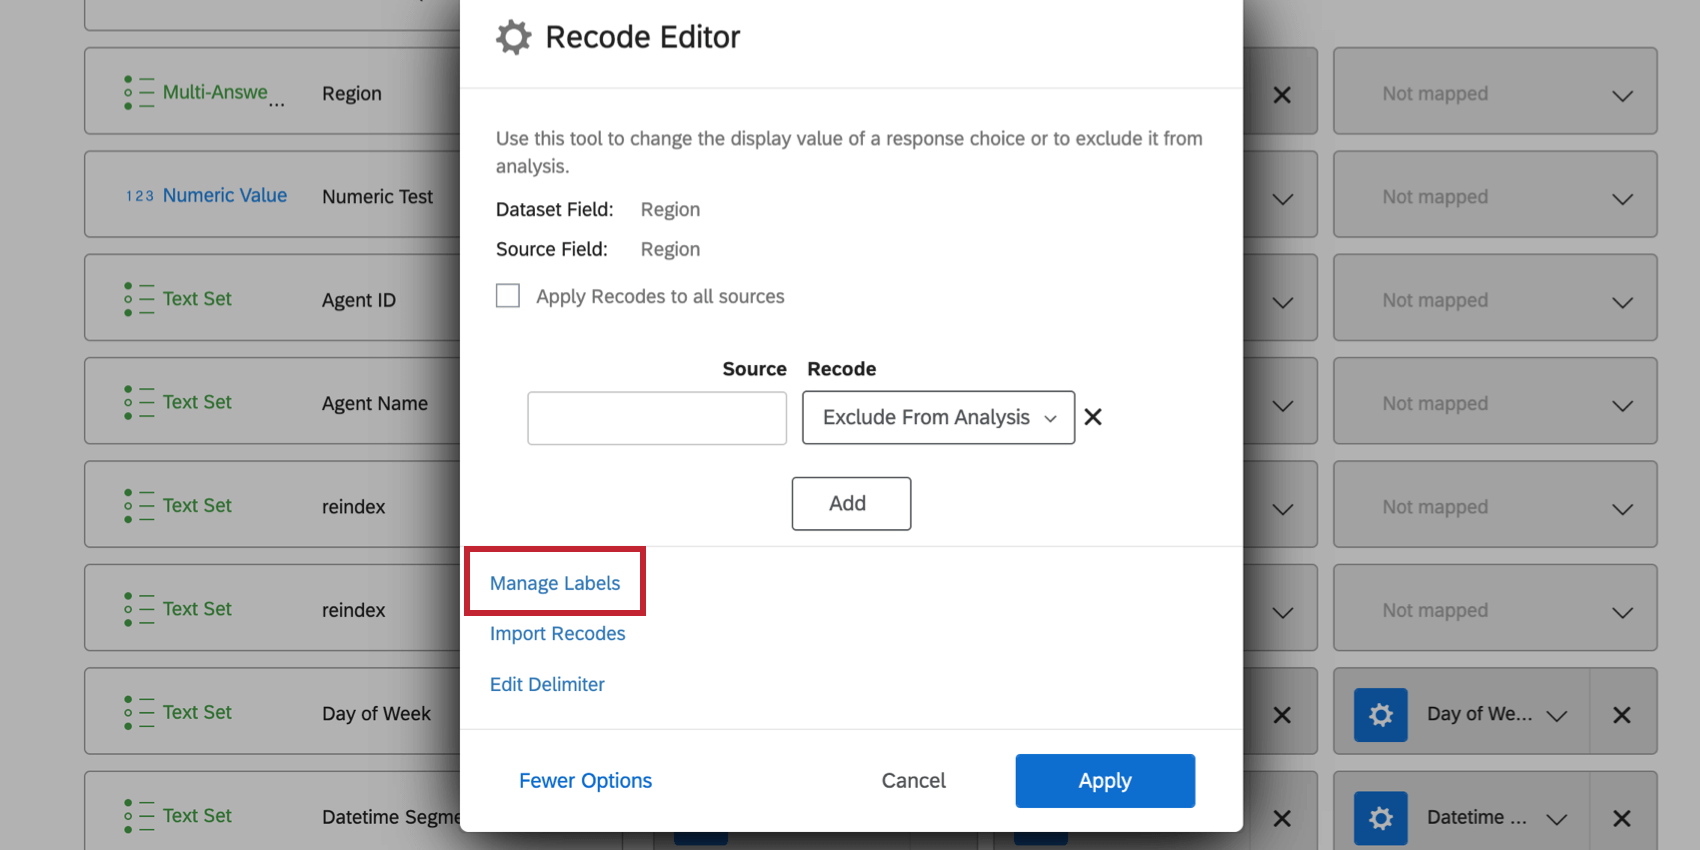
Example: You want to use Region data in your filter. To do so, open the recode editor, click More Options, then Manage Labels.
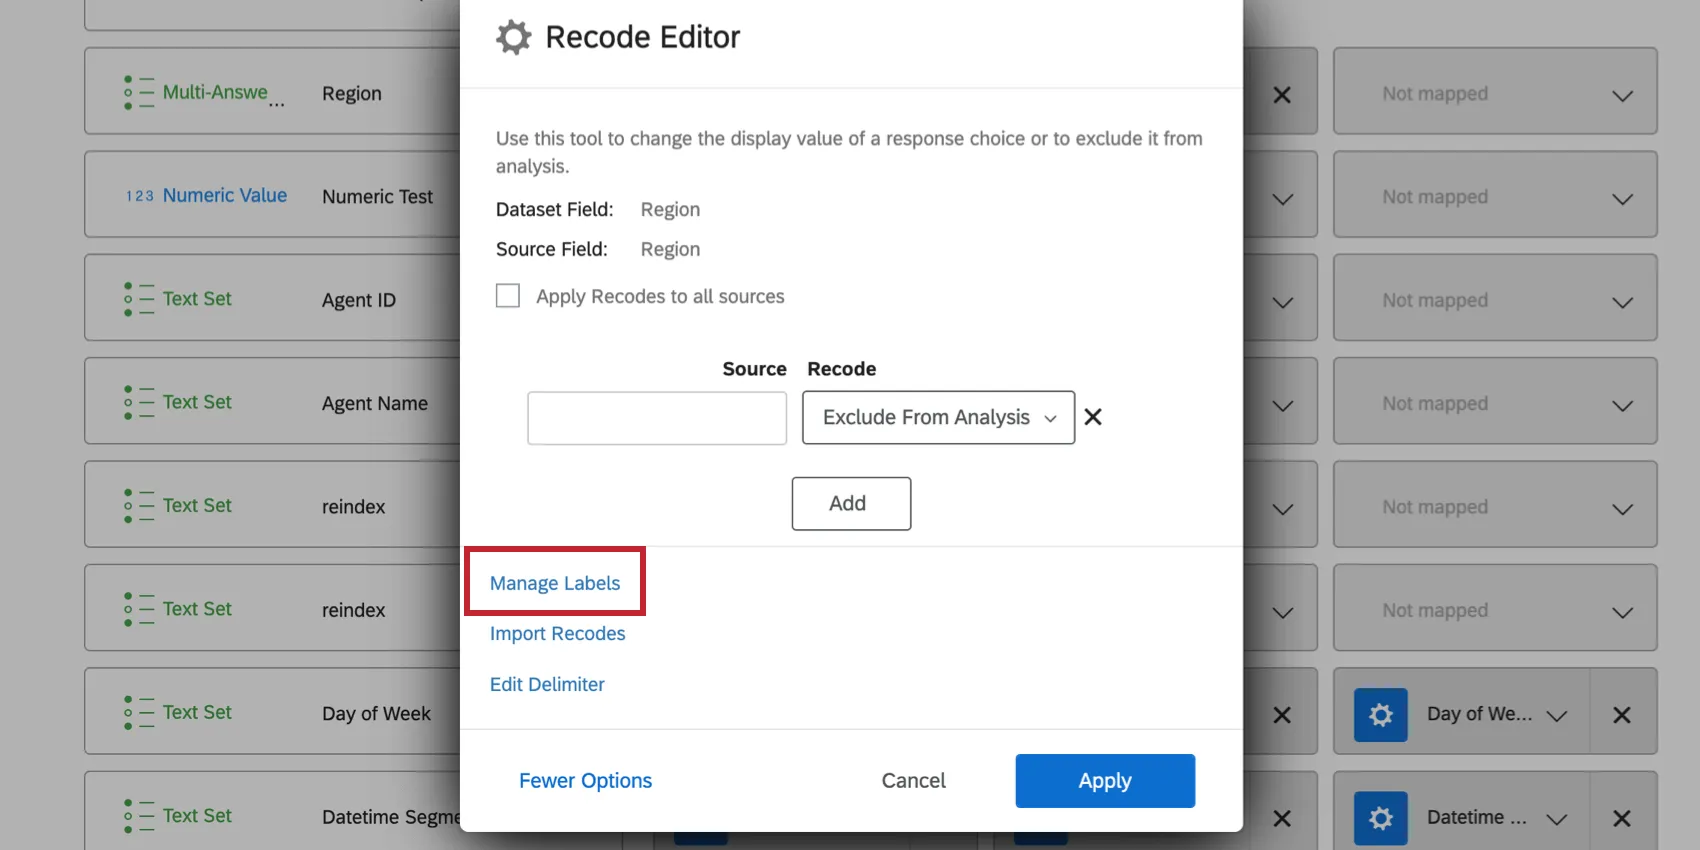
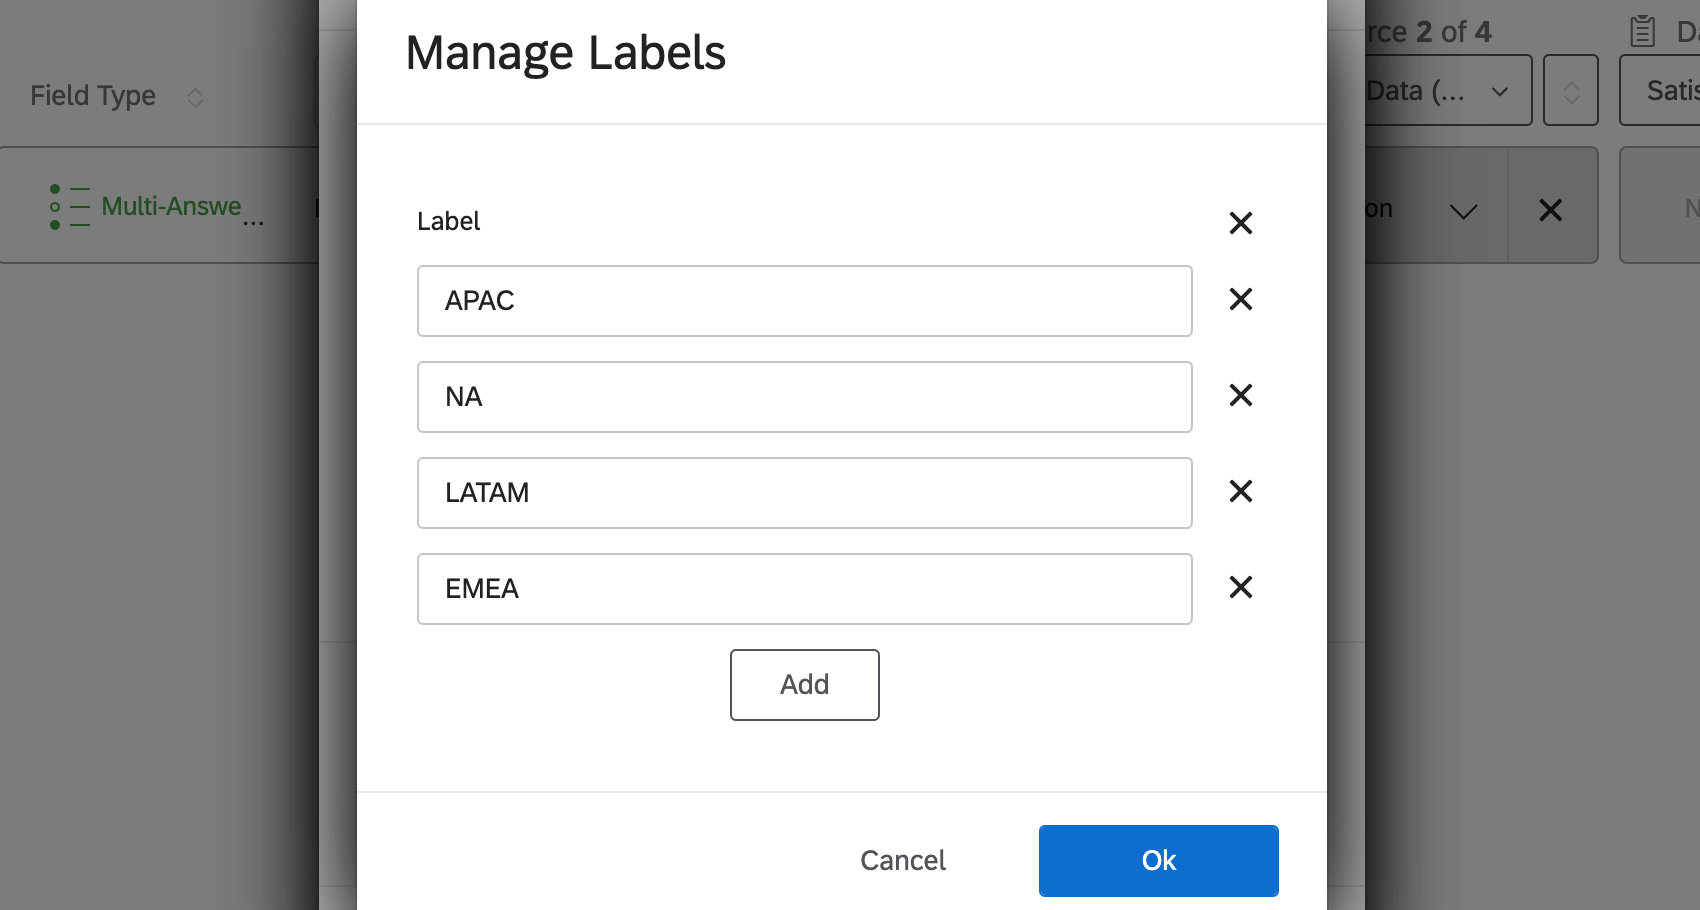
Add all of the possible values to the region field. Make sure to match exact spelling and punctuation.

Then click Ok and save your dashboard data. For more detailed steps, see Recoding Fields.
Once your fields are recoded, you should be able to add filters to your task.
That's great! Thank you for your feedback!
Thank you for your feedback!