Website / App Insights Technical Documentation
What is a Website / App Insights project, and why are we using it on our site?
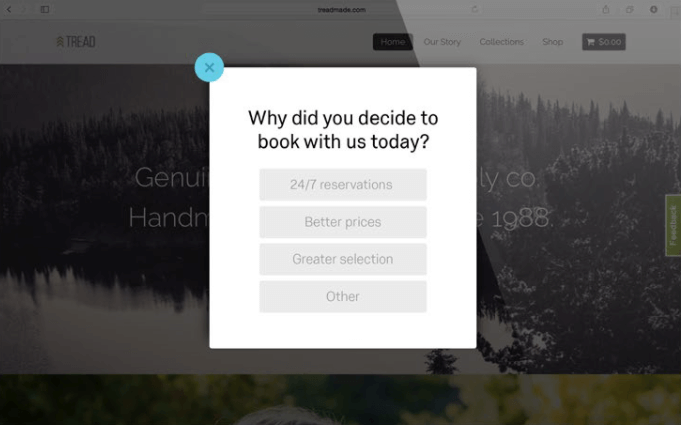
Qualtrics Website / App Insights helps organizations measure and enhance the experience a web visitor has within their digital media. With a Website / App Insights project you can present cool graphics on your website with links and embedded surveys to get feedback on your visitors’ experience, let them know about your latest deals and promotions, and more!
You and your colleagues have power over the appearance of the graphic (also known as a creative), the conditions under which it appears (the intercept), and the code used to deploy it.
Once the code for your project is added to your website, you can make all kinds of changes without ever having to change the code or alert your IT team. Just do the work in Qualtrics, and your websites’ creatives and intercepts will change accordingly.
Is it secure?
We do not pass any data to Qualtrics servers unless it’s needed for targeting logic. That said, we do not store any of this data in our system.
To secure this data over the wire and protect it from man-in-the-middle attacks, Qualtrics always uses the “HTTPS” protocol. Protocol refers to how content is delivered to the visitors’ web browser.
Where can I locate the project code for deployment?
Deployment code (or project deployment code) can be found by going to the Deployment tab within your project. You can simply copy the code and send it to your web development team for implementation. No modifications need to be made to the code.
Deployment code displays any intercept that has been built within that entire project.
How does the code work?
Deployment code is asynchronous, meaning that it only runs after everything else on the page has loaded. This means that deployment code will not prevent any other aspect of your page from loading because it will only run once the onLoad event is triggered.
Let’s run through the process of what happens when a visitor views a page in their browser that contains deployment code:
- The deployment code (usually placed in the HTML head) runs right away upon page load and will insert another <script> tag at the end of the Html body when the page onLoad event is triggered.
- This <script> tag requests JavaScript code (Orchestrator) from Qualtrics servers that is cached in a content delivery network (CDN).
- The Orchestrator makes a targeting call to Qualtrics servers to determine which creatives to show. This call is not cached in the CDN.
- If necessary, a second targeting request is sent to the servers to obtain the required data (ex: JavaScript expression or cookie targeting).
- Qualtrics obtains the Website / App Insights definition from the database and builds the code appropriately.
- Based on the targeting response, the Orchestrator makes additional calls to get the different content needed to render on the page. The number of requests made varies depending on the number of creatives to show that pass targeting logic. All this content is cached in the CDN, so it will be fast to load.
- The creative(s) appear(s) on the page.
The deployment code is dynamic, meaning that changes made to intercepts and creatives from within the Website / App Insights project interface will not cause the code itself to change. Thus, changes can be made to Website / App Insights projects from within an account, and code will not need to be exchanged on the website for the changes to be seen.
How do I deploy a Website / App Insights project?
Attention: To ensure your intercepts work, you should allowlist the following items in your Content Security Policy headers:
- connect-src https://*.qualtrics.com
- frame-src https://*.qualtrics.com
- img-src https://*.qualtrics.com
-
script-src https://*.qualtrics.com
If your Content Security Policy blocks these items by default, then Website / App Insights will not work reliably on your site. If you use a Website Security Management Solution, such as Ensighten, please allowlist the *qualtrics.com domain by following the documentation they provide. These solutions can prevent the Qualtrics tag from loading necessary resources and the Website / App Insights may not work reliably on your site. Additionally, if you are using JavaScript variables, you will need to allow “unsafe-eval” in your Content Security Policy, otherwise Website / App Insights will not be able to capture the JavaScript values.
1. Add Code Directly to Your Web Pages
Deployment code can be added anywhere on a web page. Because the code runs asynchronously, it will only start loading once a web page has completely loaded all content (including images, script files, CSS files, etc.).
Our requests start happening once the onLoad event is triggered: https://www.w3schools.com/jsref/event_onload.asp
Additionally, the location of where creatives actually appear on the web page is determined by settings determined within the Qualtrics interface. (See information on Custom Position.) Thus, the location of the code within the page does not affect where on the page content will appear.
2. Global Header/Footer (Recommended)
We recommend that you add deployment code to either the Global Header or Footer. This applies the code globally across the entire site all at once. This method is the easiest way to deploy because you don’t need to repeatedly add code to more pages as you go, which can be a lengthy process. If code has been added globally to your site in this way, you can then use Current URL logic within an intercept to control on which pages an intercept actually appears.
3. Use Tag Managers
Another option is adding the deployment code to a Tag Management system, instead of applying it directly to the site code. Code can be copied and pasted from the Qualtrics interface right into a Tag Manager.
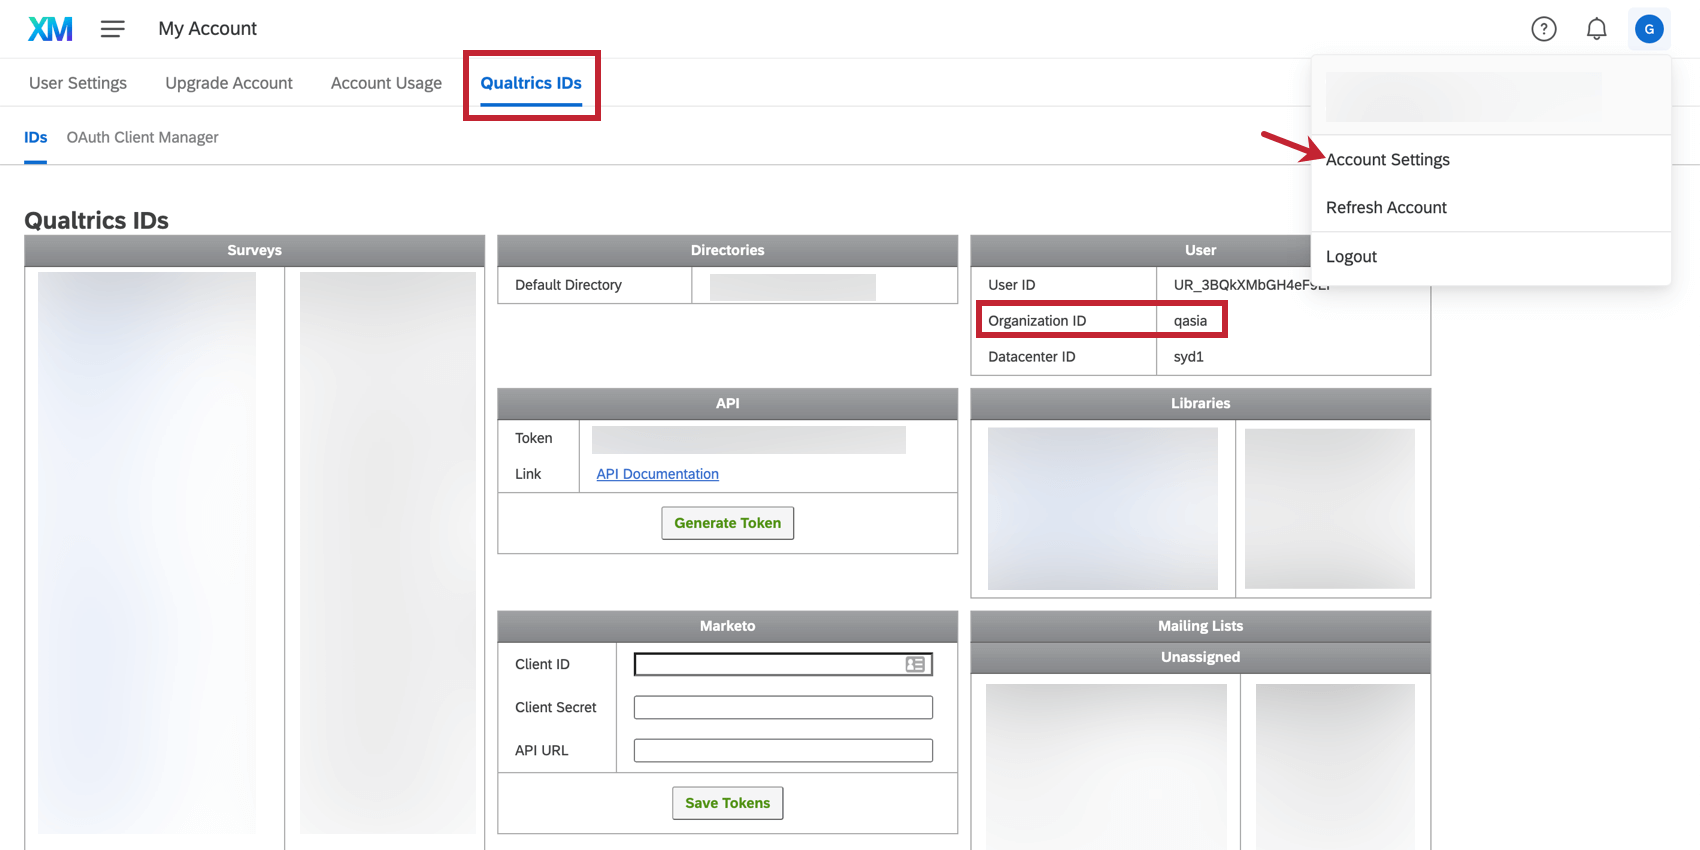
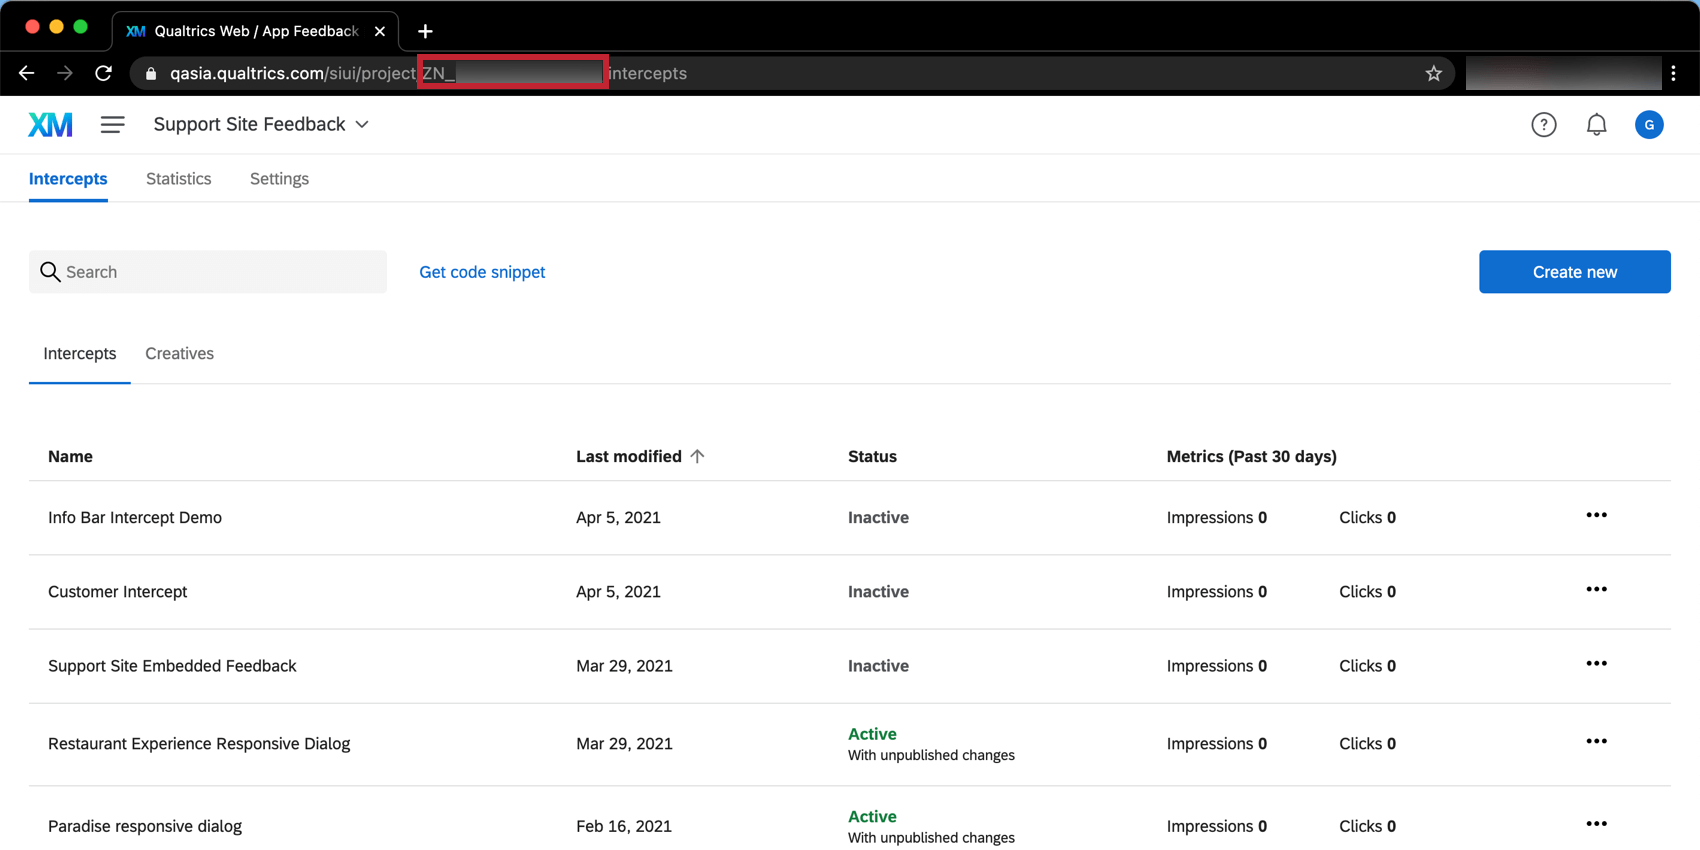
Common Tag Management systems that our clients use in conjunction with Website / App Insights are Adobe Launch, Tealium, Ensighten, and Google Tag Manager. Tealium in particular has a wizard built that allows for easy implementation of Website / App Insights. You will simply need the Zone ID for the project you are implementing and your Organization ID.
The Organization ID can be obtained by going to Account Settings and selecting the Qualtrics IDs tab.
The Zone ID will begin with ZN_ and can be found:
4. Use a CSP Nonce
In addition to loading Qualtrics resources via a URL, we also occasionally inline styles directly onto the page. To support inlining, we allow for a nonce value to be passed into our javascript files as a secure solution to work with CSP configurations.
To use a nonce, you must:
- Generate a unique value per page request.
- Set that value in your CSP, either through the meta HTML tag or by using the Content-Security-Policy HTTP response header.
- Pass that value to the Qualtrics javascript so we can use it going forward. This should be added to your project’s deployment code (see example).
Example: In this example, the nonce value is passed in lines 2 and 5.
<!-- BEGIN QUALTRICS WEBSITE FEEDBACK SNIPPET -->

<script type='text/javascript' nonce='<%nonceVar%>'>

(function(){"undefined"===typeof QSI&&(QSI={},

QSI.config = {

nonce: "<%nonceVar%>",

}

);
[remaining deployment code copied from Qualtrics – excluded here for brevity]
When using a nonce, please keep in mind the following:
- We only support a single nonce value for both script-src and style-src CSP directives.
- We do not support creatives that have been customized in the legacy creative editor.
Qtip: Guided intercepts (or the same intercept types created without the guided setup) are compatible with nonces.
- We still require that the Qualtrics domains are added to the CSP directives as outlined above.
Who is typically involved in Website / App Insights implementation?
Someone within your organization that has access to add content to your company’s website. Typically these are individuals on an IT team, Web Content team, etc.
Will Website / App Insights slow down our site?
Deployment code is asynchronous, meaning that it only runs after everything else on the page has loaded. This means that deployment code will not prevent any other aspect of your page from loading because it will only run once the onLoad event is triggered.
What if Qualtrics is down? Will that cause issues with our website?
If Qualtrics is experiencing any outages or issues, the intercepts will simply not show up on the page. Beyond that, there will be no impact to the visitor’s experience on your sites.
How quickly will the code run on my website?
We expect the deployment code to load within 300 milliseconds for more than 50% of requests and within 750 milliseconds for more than 90% of requests. Speed will vary based on user’s geographic location and how many intercepts and creatives a project has.
Opening the Debug Window
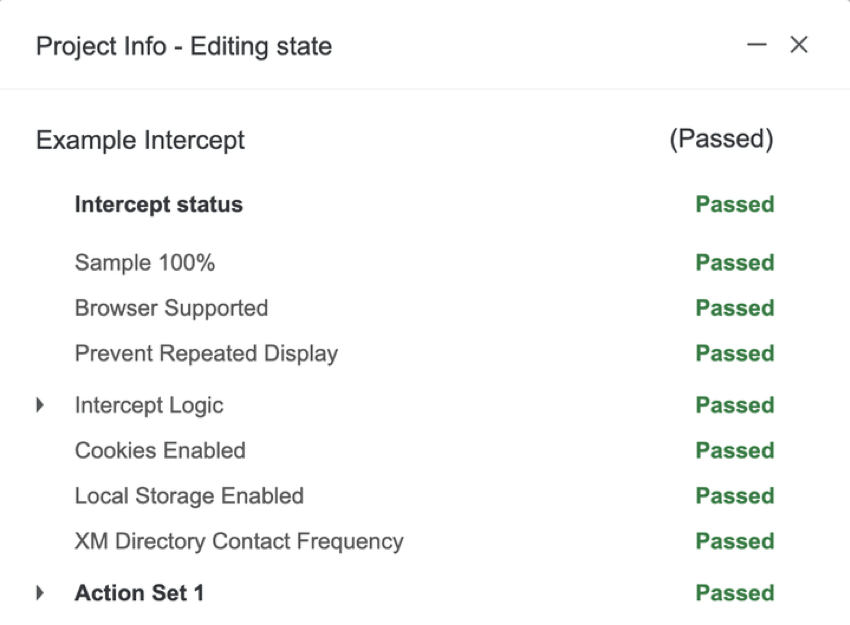
You can use the debug window to diagnose why an intercept has not displayed on a specific web page. This window shows all conditions required for the intercept to appear and if the conditions passed or failed.

How you open the debug window will depend on when your intercept was implemented.
Intercepts Implemented Before March 2019
For intercepts whose deployment code was implemented prior to March 2019, you can enable the Debug Window by appending the Q_DEBUG query string to the URL. This query string should be appended with either a ? or &, as illustrated in the examples below:
https://www.qualtrics.com?Q_DEBUG
https://www.qualtrics.com/blog?item=value&Q_DEBUG
Intercepts Implemented After March 2019
For intercepts whose deployment code was implemented after March 2019, follow these steps to open the debug window:
- Open your browser’s developer tools.
- Run the following JavaScript command:
QSI.API.unload();

QSI.isDebug = true;

QSI.API.load();

QSI.API.run();
Troubleshooting Tips
Intercept Logic and Action Set Logic
- Make sure the values are correct.
- Examine your use of “Is” vs. “Contains.”
- Examine your use of And/Or logic.
- Watch out for spaces in the values.
Revision History
Make sure the published version is the most recent (or the version that you would expect).
Watch For the Website / App Insights Network Request
- Open Developer Tools on your browser.
- Look at the network request for ?Q_ZID etc.
- No network request: The implementation is not working.
- Network request: Check the parameters of the request for inconsistencies. Sometimes the code is implemented using a tag management system. There are cases where this implementation messes with the parameters in our request for current URL, etc.
- Network request with an error: Check if your project is activated.
Look For Other Hanging Script Requests That Might Be Interfering With Our Script
- Right click anywhere in your browser.
- Select Inspect Element.
- Choose Console (this is where errors appear).


