Results Dashboards Basic Overview
What's on This Page:
About Results Dashboards
Results dashboards are designed to give you a quick and simple visualization of your survey results. Each question in your survey will have a visualization pre-made for it. However, there are many customization options available to you to help you build a dashboard to fit your needs.
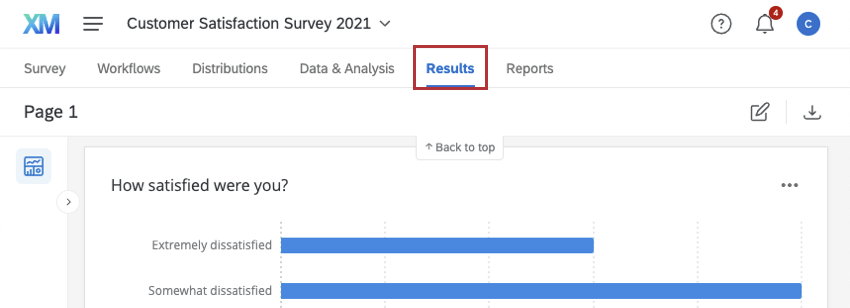
To access results dashboards, click Results in your survey project.
Navigating Results Dashboards
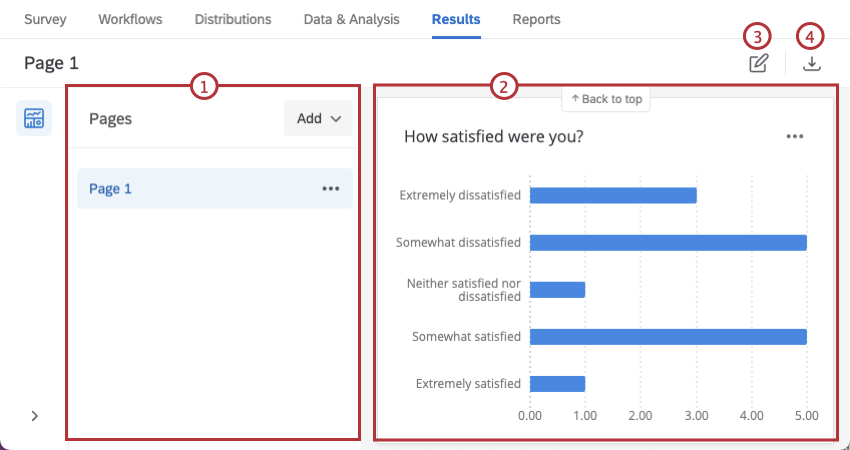
The main features of results dashboards include:
- To the left is the page menu, which allows you to create and copy pages, as well as switch between existing pages.
- On the right you’ll see the widgets for the selected page. These display your survey data in easy-to-digest charts, graphs, and tables. See Results Dashboards Widgets for an overview of available widget types.
Attention: These widgets are the same as the widgets available in CX dashboard projects.
- The editing icon allows you to edit your dashboard pages. Entering editing mode allows you to create new widgets, edit existing ones, and apply page filters.
- The download button lets you export your dashboard in various ways; you can download your dashboard as a file, send your dashboard as an email, or schedule recurring emails of your dashboard.
Creating & Copying Results Dashboard Pages
If you want to create a new results dashboard page, you can make a copy of an existing page or start from scratch.
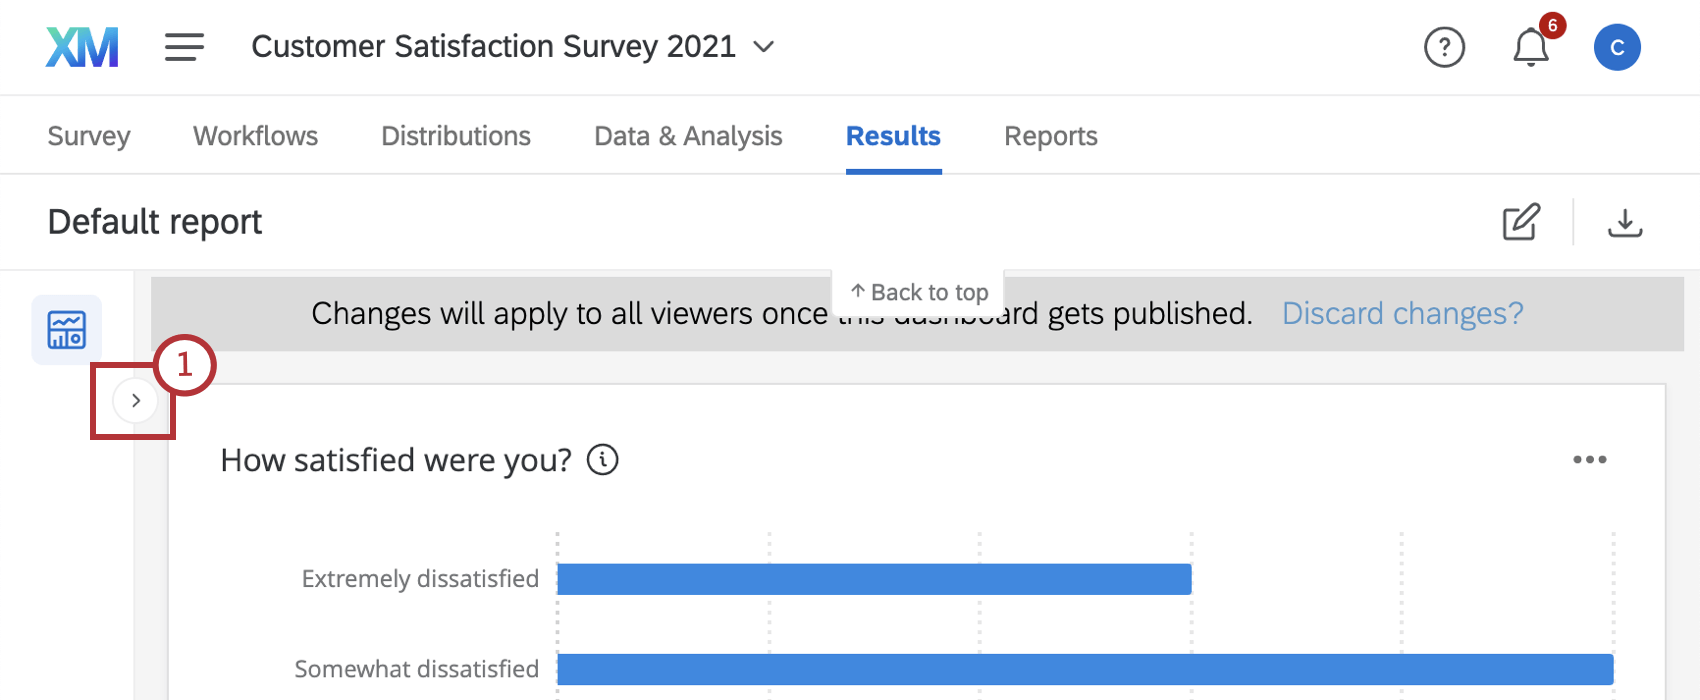
- Click the arrow (>) in the top-left of the page to expand the page menu.
- Click Add in the dropdown menu.
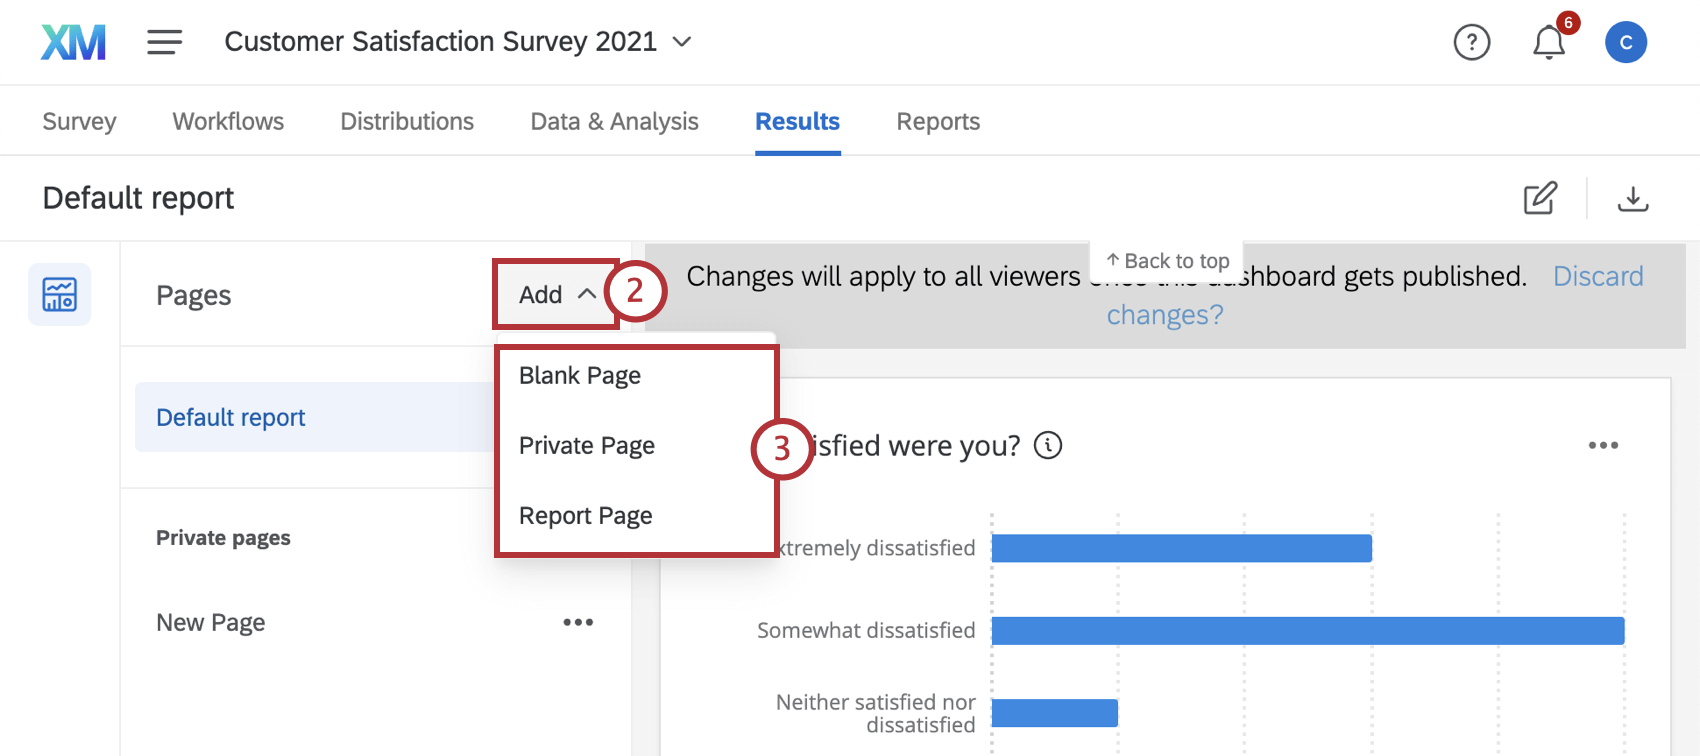
- Select your desired option:
- Blank Page: Generates a new blank report page.
- Private Page: Generates a new blank private report page. This private page will only be visible to you.
- Report Page: Generates a new default report page.
Editing Results Dashboard Pages & Adding Widgets
Visit the linked pages to learn more about editing results dashboards pages.
- Results Dashboard Page Types: This page describes the difference between default (i.e. report) pages, private pages, and blank pages.
- Creating Pages: Create new pages in your report where you have full control over the page content.
- Page Options: The page options that are used to rename, copy, and delete pages.
- Adding Widgets: Add widgets to your results dashboards pages.
Using Results Dashboard Filters
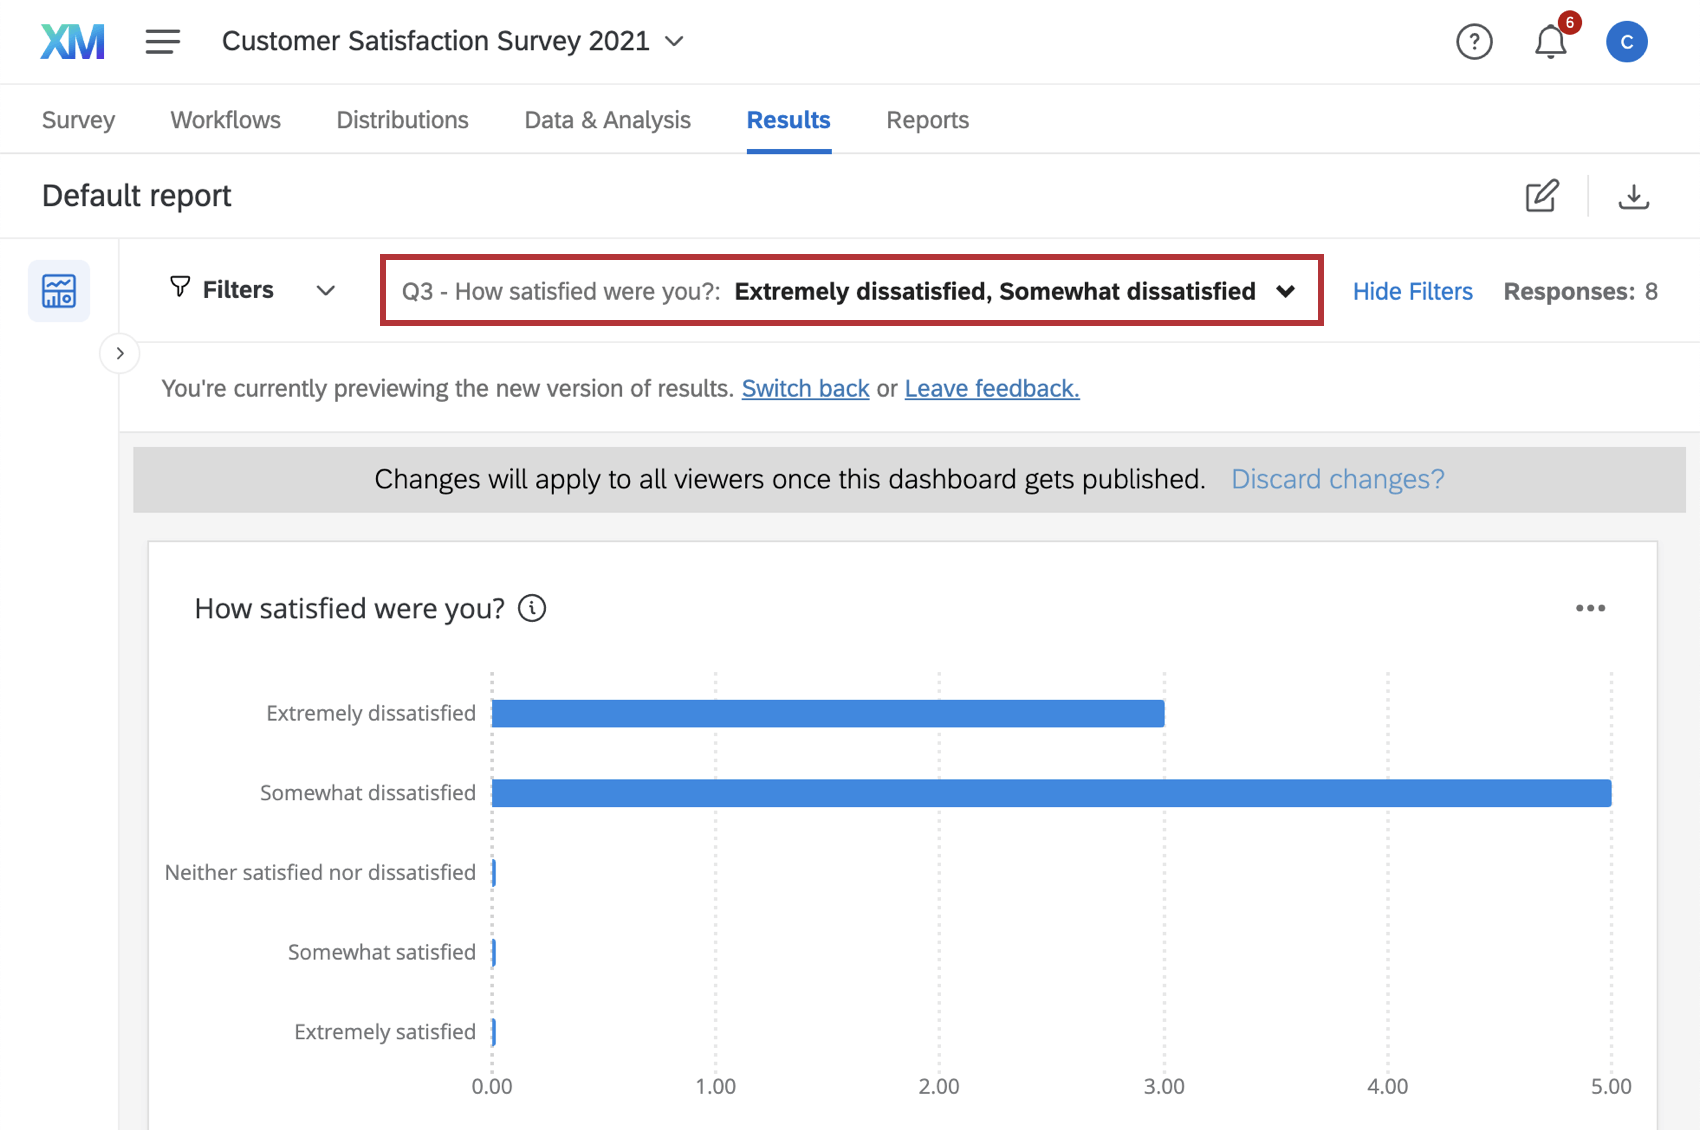
You can filter your entire results dashboard to remove data you don’t need. For example, in the below image, we filter our results to show dissatisfied customers since we are interested in analyzing only their data.
For help with results dashboard filters, see Filtering CX Dashboards. This page contains all the information you will need to filter your results dashboards, including how to add a filter, building filter logic, and saving and reusing filters. See also Advanced Dashboard Filters and Response Count Thresholds.
Sharing Results Dashboards
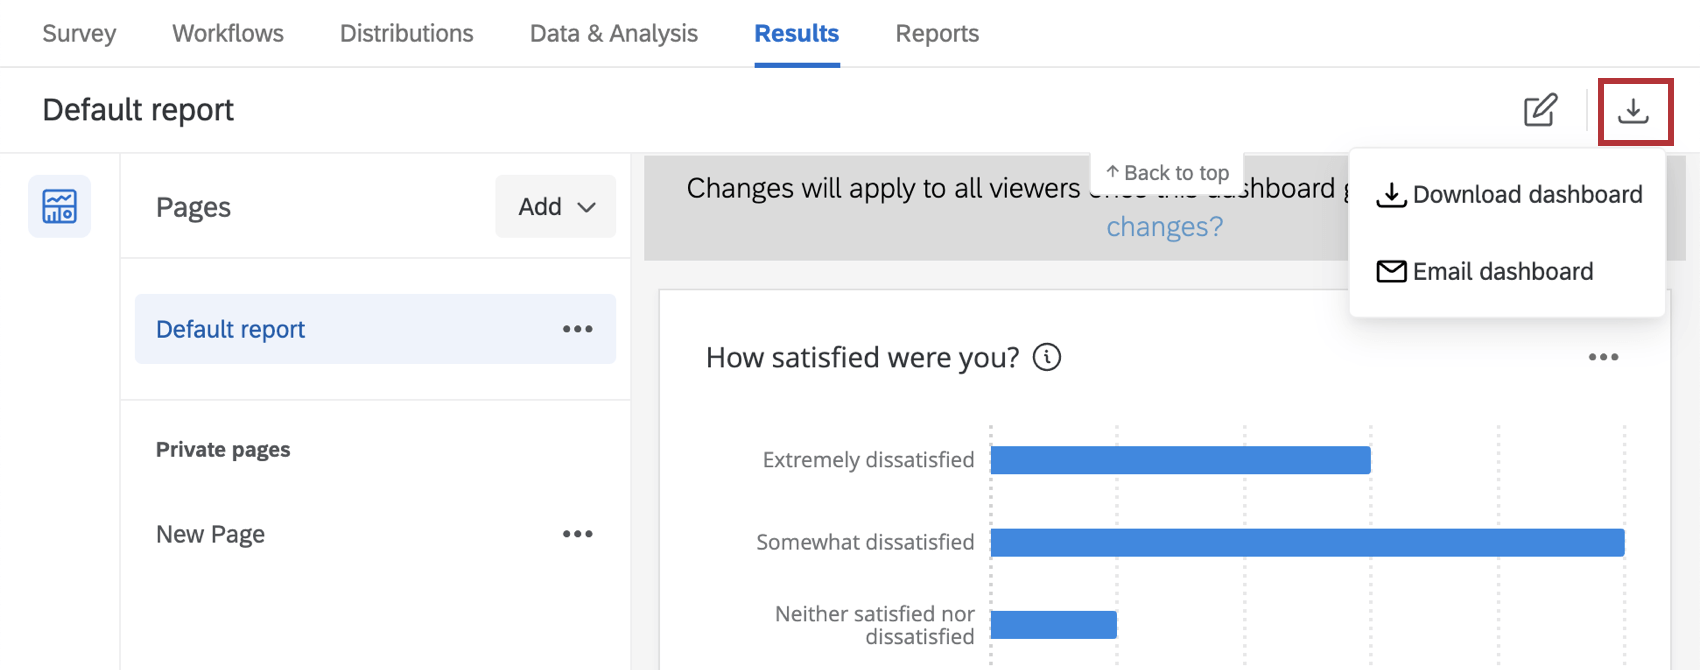
There are several ways to share a results dashboard. Click the export dashboard button in the top-right and then select how you want to share your dashboard.
The methods for sharing your report include:
- Download dashboard: Generate and share a digital copy of your results dashboard in a PDF or JPG format. See the Download Dashboard support page for more details. Keep in mind CSV and TSV exports are not available for Results Dashboards.
- Email dashboard: Send your results dashboard as an email attachment. See the Email Dashboard support page for more details.
