
BX Dashboards Overview
What's on this page
About BX Dashboards
BX Dashboards use brand tracking data to understand the impression of your brand on audiences. By identifying experiences that attract customers or push them away, BX Dashboards can provide actionable steps for teams to improve their brand perception and deliver on their brand promise.
Qtip: BX programs are typically conducted by the Qualtrics Implementations team or a third-party implementations partner. If you have questions about your implementation, please reach out to your Technical Success Manager.
Editing Dashboards
Qtip: Your dashboard settings are configured during the implementation process. We recommend reaching out to your Qualtrics project team to make any changes to the dashboard settings.
You can edit the brand tracker dashboard just like any other – mapping new fields, adding new widgets, removing content, or even renaming the dashboard. For information on dashboard editing, check out these introductory pages:
- Getting Started with CX Dashboards
- Step 1: Creating Your Project & Adding a Dashboard
- Step 2: Mapping a Dashboard Data Source
- Step 3: Planning Your Dashboard Design
- Step 4: Building Your Dashboard
- Step 5: Additional Dashboard Customization
- Sharing Your CX Dashboard
Attention: When working with BX Dashboards, copy pages before making edits to them in order to keep existing widgets and set-ups functional.
Qtip: For unique brand widgets, see the support site menu to the left.
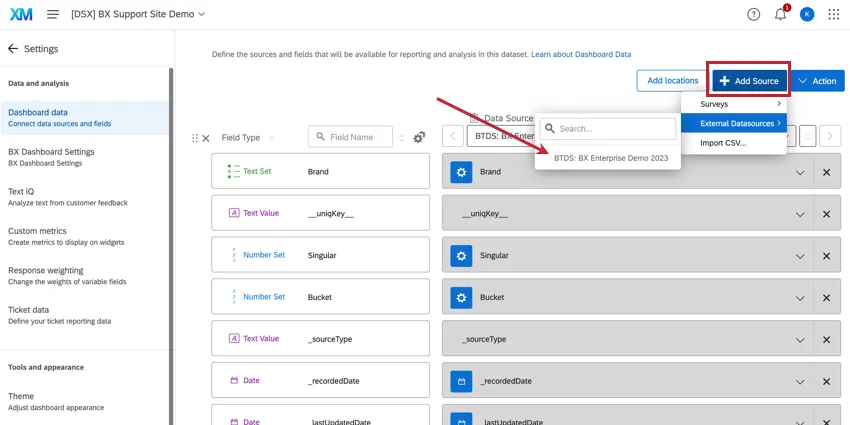
Mapping BTDS to a BX Dashboard
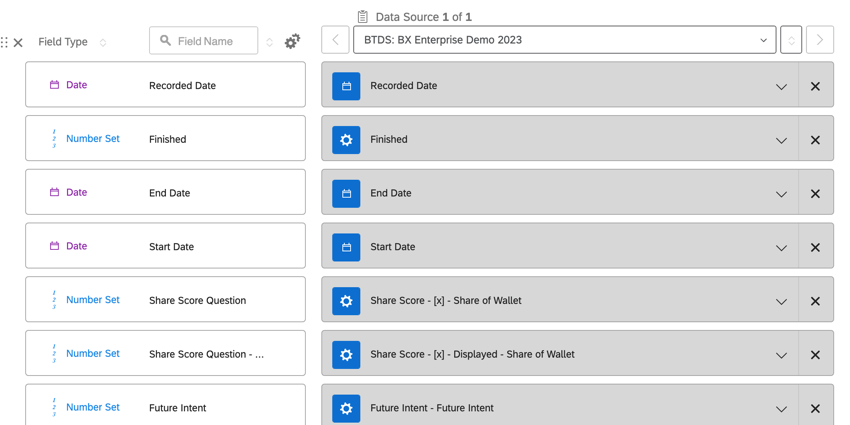
BX programs use a stacked dataset (Brand Tracker Data Source, or BTDS) to identify insights in your data more easily. Once the Brand Tracker Data Source has been generated, it can be mapped to the BX dashboard to report on the data. The BTDS should be added as an external data source.
It is important to confirm all data is mapped as the correct field type during the initial dashboard setup. Most brand fields will be number sets or multi-value text sets. Single-select non-stacked questions (such as demographics or behavior questions) should be set to the text set field type. For more information on field types, see the linked support page.
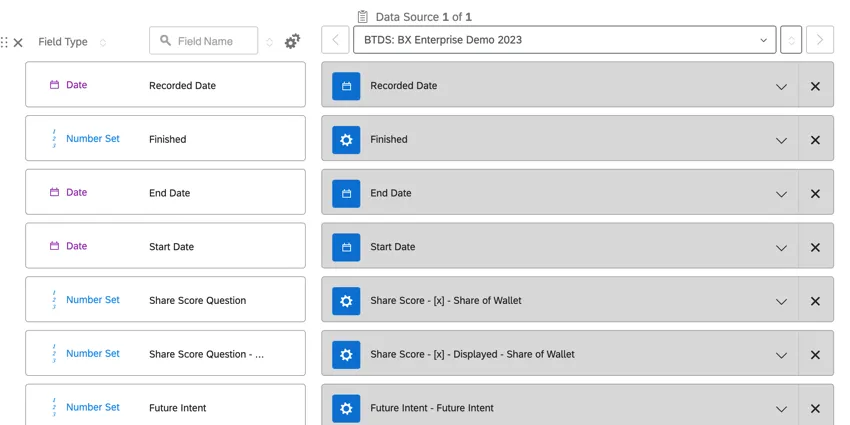
Qtip: When mapping data, keep the names of all fields clean, clear, and as descriptive as possible.
Qtip: If you need to change the field type of a question that has already been mapped, it is best practice to create a new field with the correct field type. Changing the field type of data that has already been mapped can affect existing widget configurations.
STACKED DATA FIELDS
Qtip: For more information on stacked data fields, see Using and Editing Your Brand Tracker Data Source.
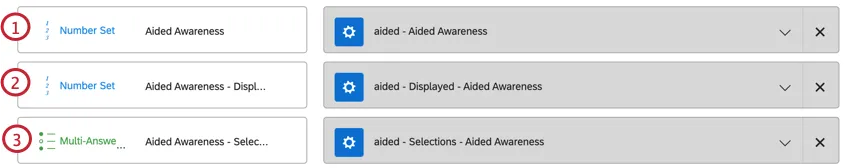
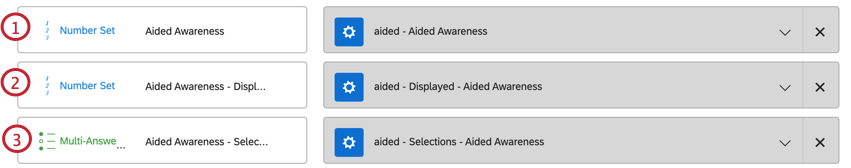
Stacked data fields are a result of the BTDS-specific data processing. These fields can have multiple different variables that represent a question where brands are the answer choices.
Qtip: While the selections field is useful for filtering data, we do not recommend using this metric in widget configuration.
Qtip: For more information on stacked data, see Using and Editing Your Brand Tracker Data Source.
Working With Your Data
Attention: BX dashboards use the brand tracker data source (BTDS), which is a stacked dataset. For more information, see Using and Editing Your Brand Tracker Data Source.
The BTDS is a stacked dataset with a unique structure, which will impact how you configure your widgets.
SINGULAR FIELD
Every respondent has a row of data for each brand plus one row of non-brand data. The field named “Singular” identifies which rows are brand data: if Singular = 0 the data is from brand rows, and if Singular = 1 the data is from the non-brand row for that respondent.
Example: If you have 10 brands in your study, every respondent would have 11 rows created in the stacked data source.
Attention: When you want to see the results for each brand, we recommend creating a filter for Singular = 0.
Qtip: The response count when a filter for Singular = 0 is applied will be higher than the number of respondents who took the survey because there is one row per brand per respondent. To configure widgets based on respondent count, be sure to create a filter where Singular = 1.
BRAND DATA
Brand data refers to data that respondents answered about each particular brand, so it differs from row to row. Every metric for brand data will have 2 to 3 fields:
Qtip: While the “selections” metric is useful for filtering data, we do not recommend using this metric when building widgets.
Qtip: When working with brand data in a widget, you will typically create a filter for Singular = 0.
NON-BRAND DATA
Non-brand data (e.g. age, gender, income, etc.) is repeated across every brand row for a respondent. There will generally be only one field in the data set per non-brand metric.
Qtip: When working with non-brand data in a widget, you will typically create a filter for Singular = 1.
Configuring BX Widgets
In general, configuring widgets consists of setting a metric, defining an x-axis, defining the data series, and customizing display settings. How you configure widgets for BX Dashboards will depend on whether you want to use brand data or non-brand data; for more information, see the sections below.
Qtip: For more information on building widgets, see Building Widgets (CX).
Qtip: The Singular field should be used to display the correct type of data for what you are analyzing. For more information, see Working With Your Data.
Qtip: Most widgets have a checkbox to “Show number of responses” which displays the number of responses in the top left corner of the widget. This option functions slightly differently in BX dashboards. Count metrics within a widget will include every stacked row in the BTDS as its own data point, while the “Show number of responses” only displays the unstacked number of responses to the original survey, (i.e., this option ignores stacked data). Due to this, you may see a lower than expected number of responses.
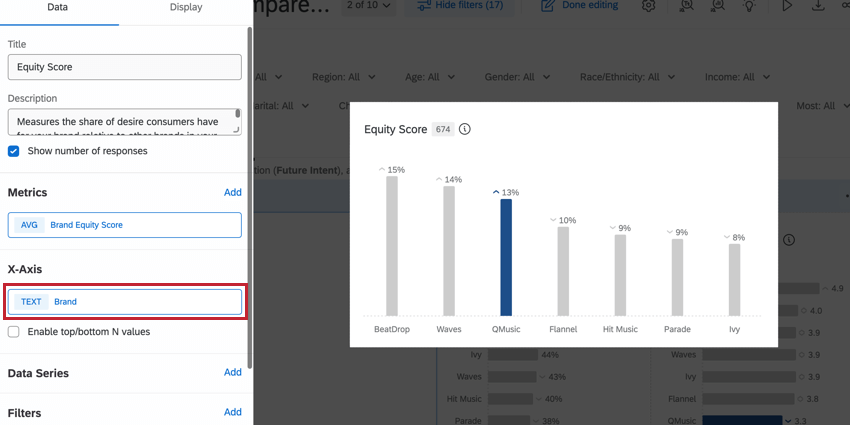
Configuring BX Widgets for Brand Data
Qtip: For more information on building widgets, see Building Widgets (CX).
Brand Data values are unique from row to row based on what the respondent answered about that particular brand.
For brand data, the x-axis will typically be the “Brand” field, which allows you to see the value of the metric for each brand in the dataset. These widgets should have a filter for Singular = 0 to ensure that only the correct rows are included.
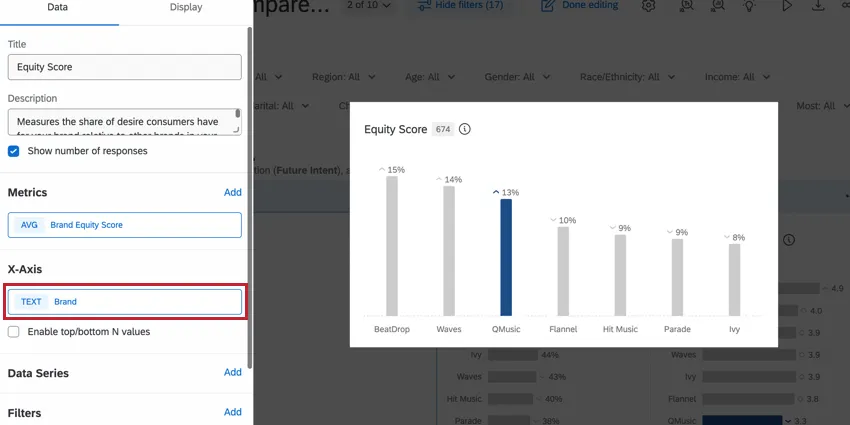
SUBSET RATIO
For most brand data, you will typically use the Subset Ratio metric type. This metric displays a proportion of values (e.g., the percentage of respondents who are aware of a brand) by using metrics in the numerator and denominator fields.
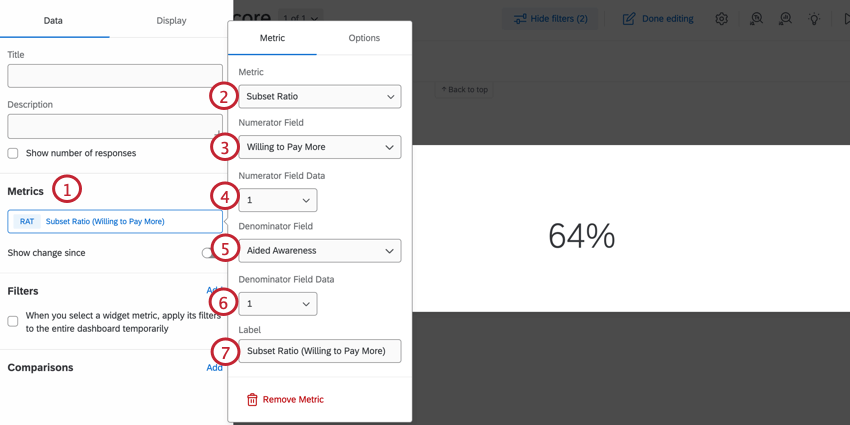
Qtip: Putting Total in the denominator field will show the proportion of people who associated the brand with the metric in the numerator, among the total number of responses in the dataset. Alternatively, putting Aided Awareness = 1 in the denominator will show that among the group of people that were aware of that brand in the first place.
AVERAGES AND TOP/BOTTOM BOX
Other common metric types for brand data are Averages and Top Box / Bottom Box. These metric types do not require a numerator or denominator.
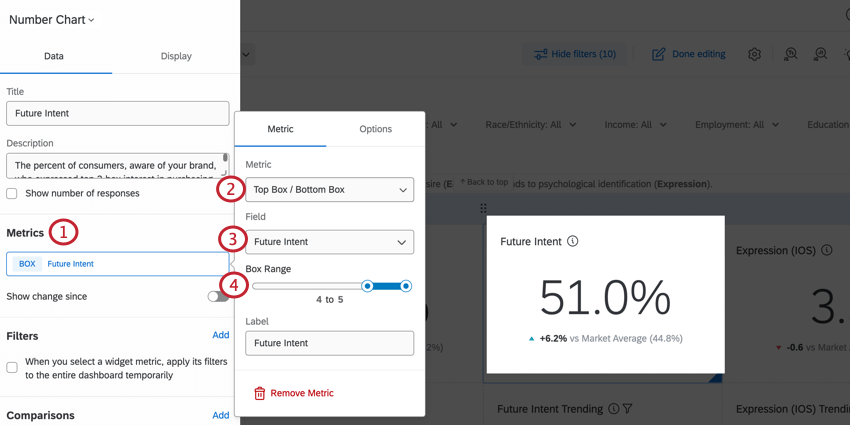
Qtip: To target a specific respondent base, set a filter to narrow the dataset. For example, you can set a filter for Aided Awareness = 1 to only see those respondents who were aware of your brand.
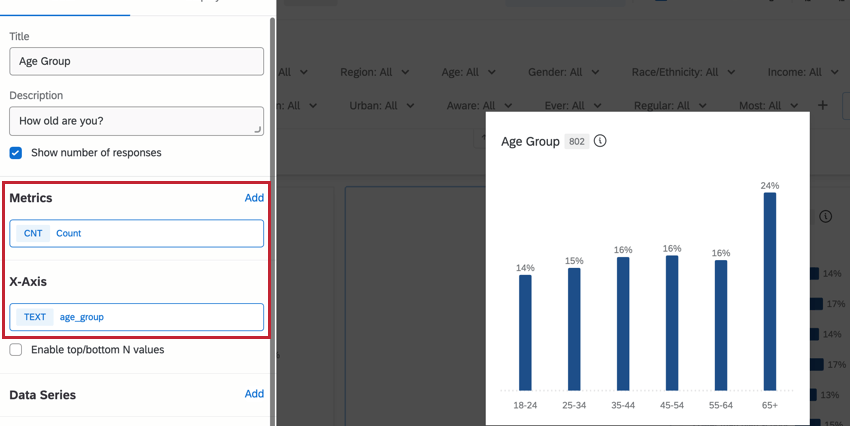
Configuring BX Widgets for Non-Brand Data
Widgets structured around non-brand data focus on fields that could impact your brand such as demographics, psychographics, or market. In most cases, you’ll configure these widgets with the count metric.
Qtip: Remember to create a filter for Singular = 1 when working with non-brand data. For more information, see Working With Your Data.

Qtip: For more information on building widgets, see Building Widgets (CX).
Example Widgets
Below are instructions for how to build common widgets in BX dashboards. For more information on building widgets, go to Building Widgets (CX).
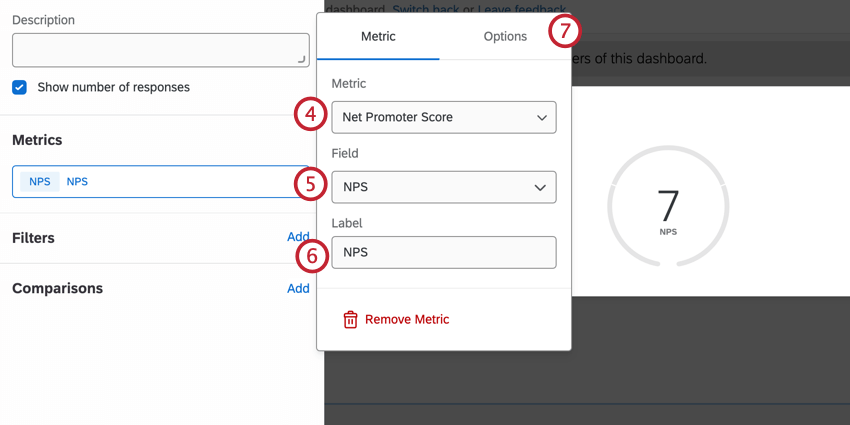
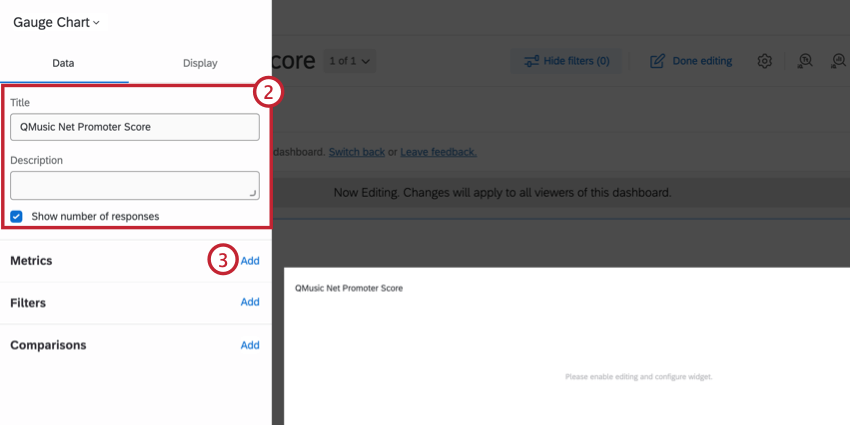
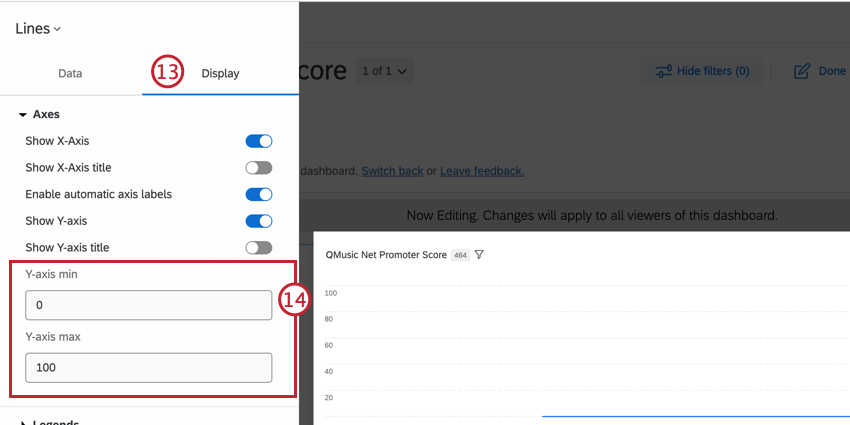
NPS Gauge Chart Widgets
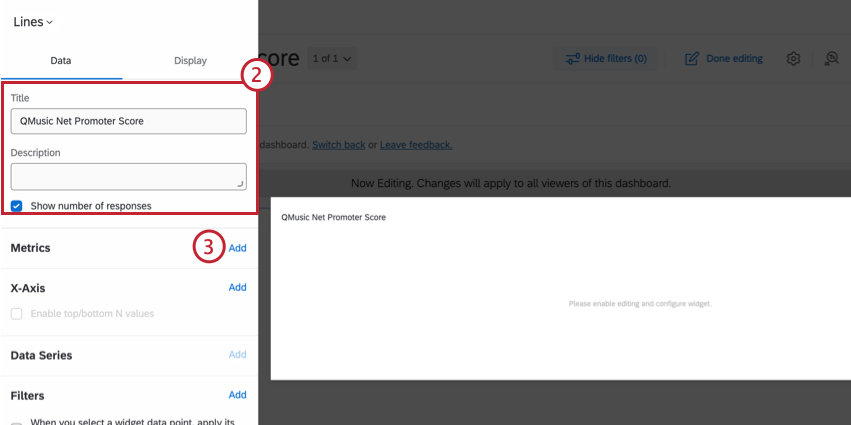
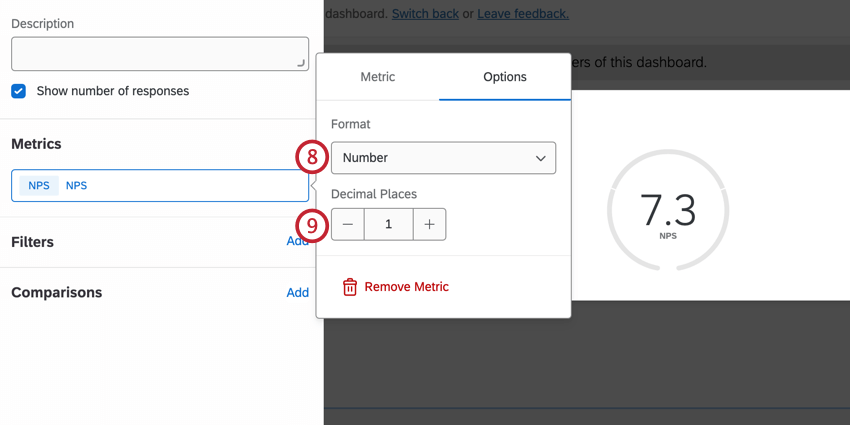
Qtip: While most dashboard plans keep the decimal at 0, NPS questions tend to be more granular. Adding a decimal place provides more information on the differences between waves.
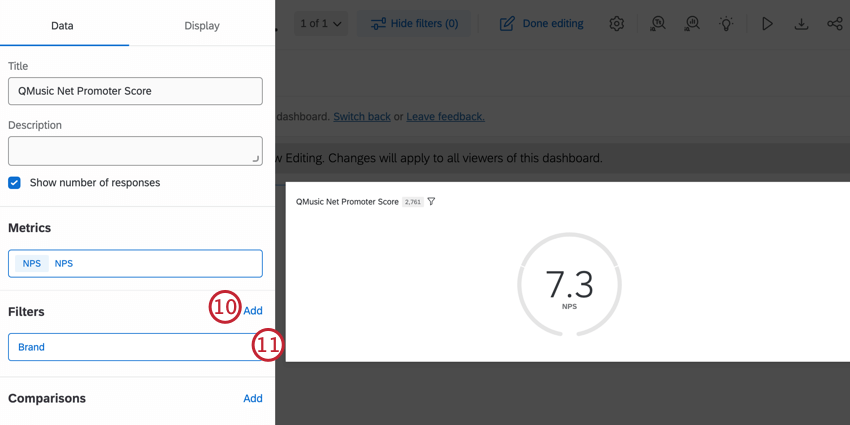
Qtip: Depending on the data you would like to display, you should also add a filter for the Singular field. This will typically be Singular = 1. For more information, see Working With Your Data.
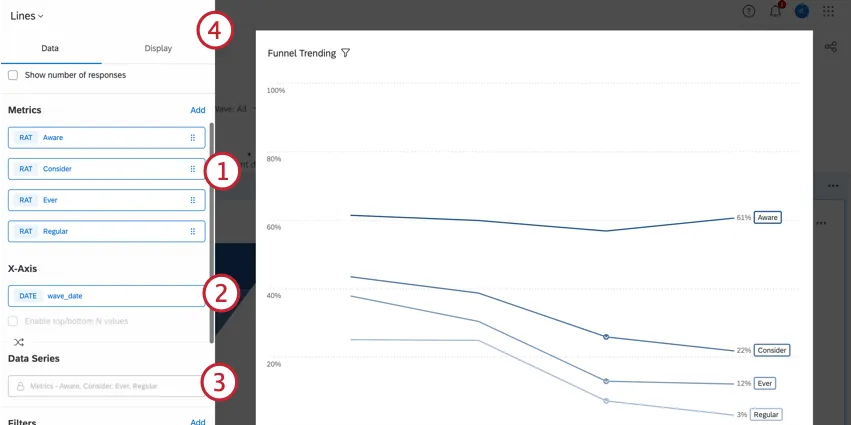
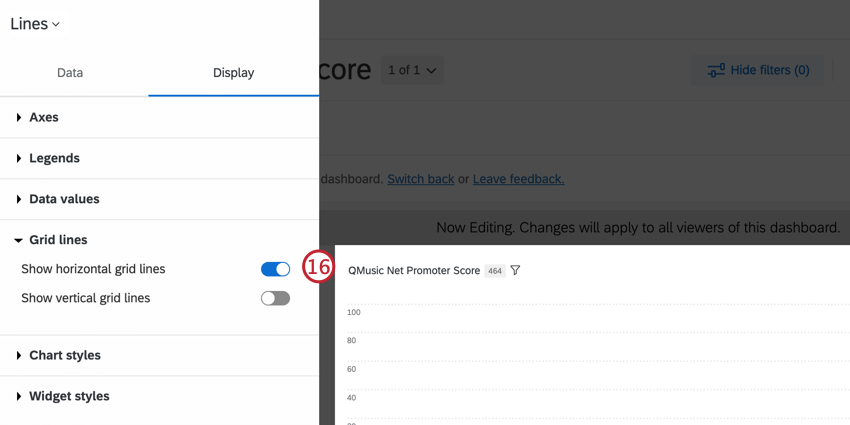
NPS Line Widgets
Line widgets are a useful way to show NPS changes over time.
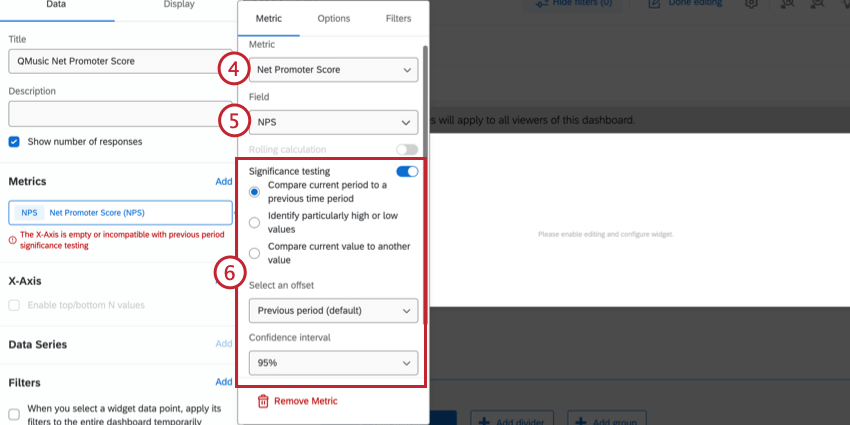
Qtip: We recommend keeping the default selections, then changing the Confidence interval to 95%. See Significance Testing in Dashboards for more information.
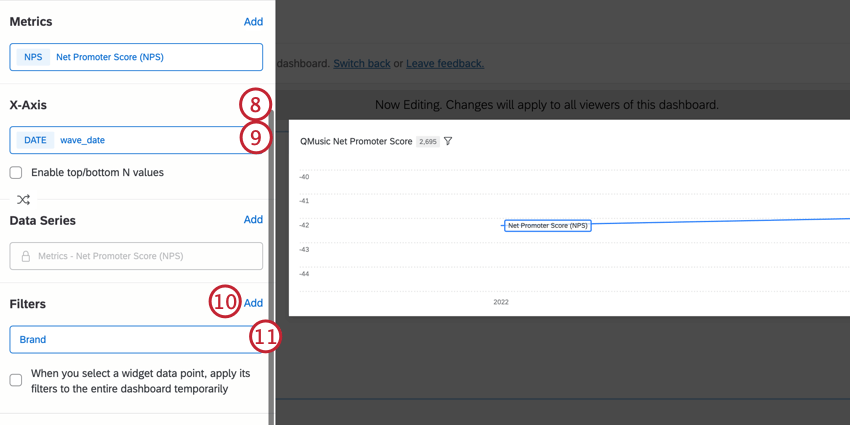
Qtip: This field might be labeled as “wave_date”.
Qtip: Depending on the data you would like to display, you should also add a filter for the Singular field. This will typically be Singular = 1. For more information, see Working With Your Data.
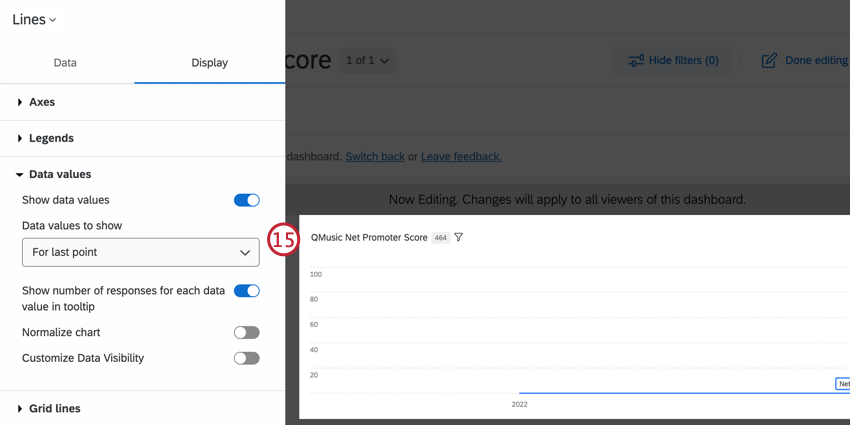
Qtip: Instead of adding a Brand filter, you can add a Data Series for Brand to compare multiple brands over time.
BX Widgets
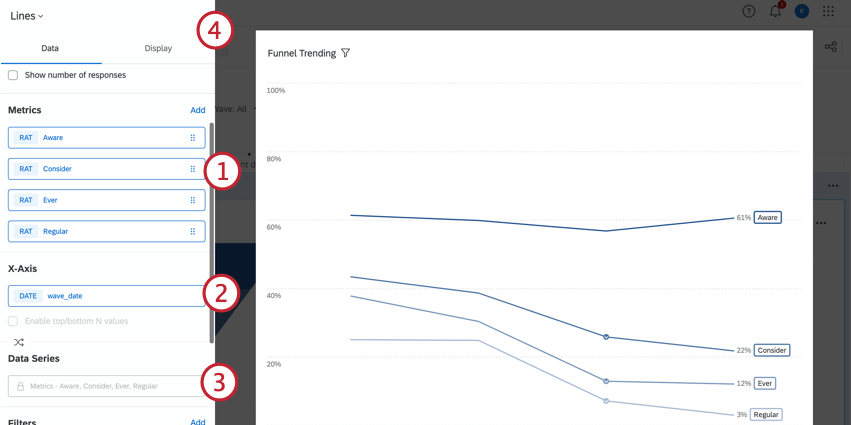
BX projects include special widgets tailored for brand comparative analyses. These widgets can interpret brand specific measures and relationships between brands through compelling visuals. You will not find these widgets in other types of Qualtrics dashboards. These widgets include:
- Funnel Widget (BX)
- Correspondence Analysis Widget (BX)
- Distinctive Image Associations Widget (BX)
- Radar Chart Widget (BX)
- Brand Drivers Analysis Widget (BX)
- Split Axis Chart Widget (BX)
- Opportunity Analysis Chart Widget (BX)
- Experience Assessment Widget
Dashboard Spot Check
Spot Check provides recommendations for improving your dashboard pages. Click the spot check button at the top of your dashboard to open it. Fore more information, see Dashboard Spot Check. Note that while the linked page is about EX Dashboards, the Spot Check functionality is the same across all dashboard types.
Filtering BX Dashboards
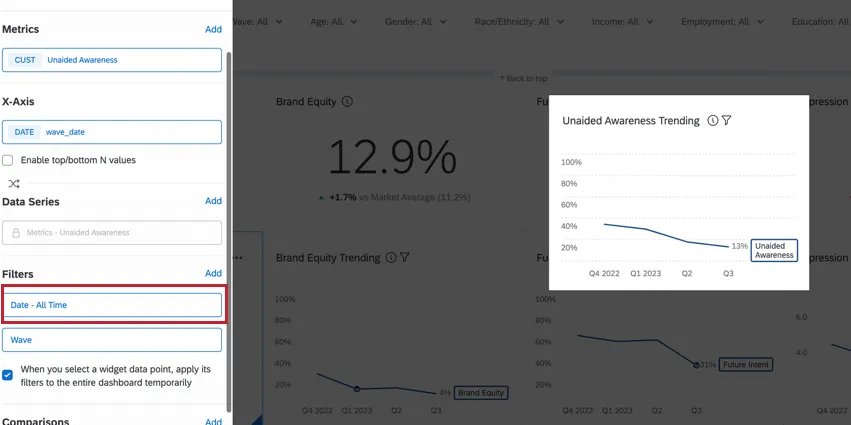
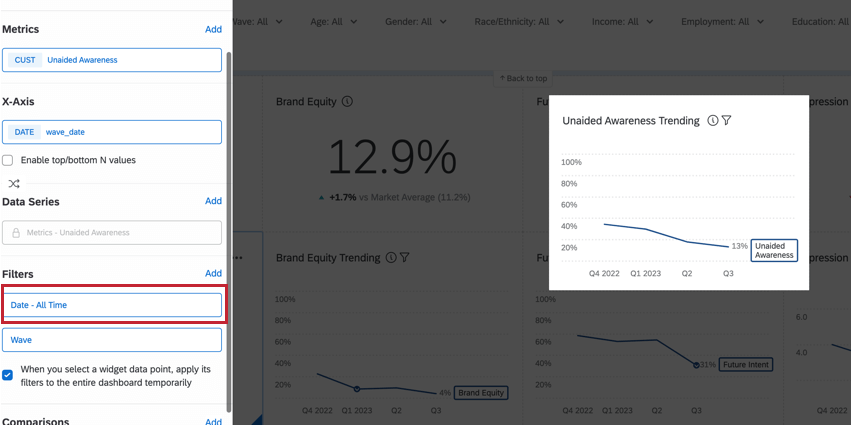
In BX dashboards, you can filter your dashboards by applying a filter to the entire page, to individual widgets, or by pairing them together. Generally speaking, page-level filters will apply to widgets that also have a widget-level filter applied. However, in circumstances where the widget-level filter and page-level filter conflict, the widget-level filter will override the page-level filter. Pairing page and widget interactions together can be useful to display the best information for each widget.
Example: Let’s say you set a page filter for Date to see responses from a specific time window. If we use a line chart on the same page, our data will be narrowed to just the range set in the page filter. To ensure the trend chart is displaying the full data trend, we can add a Date filter to the trend widget as well which will override the page filter. To include the full data trend, we’ll set the filter to “Date = All Time”.
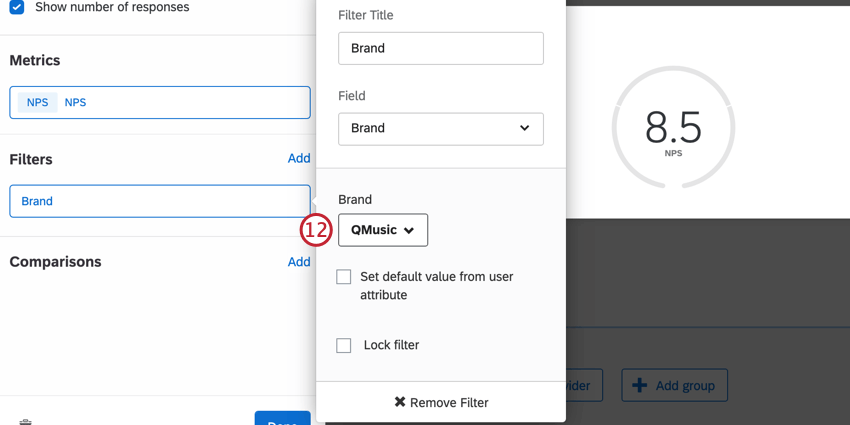
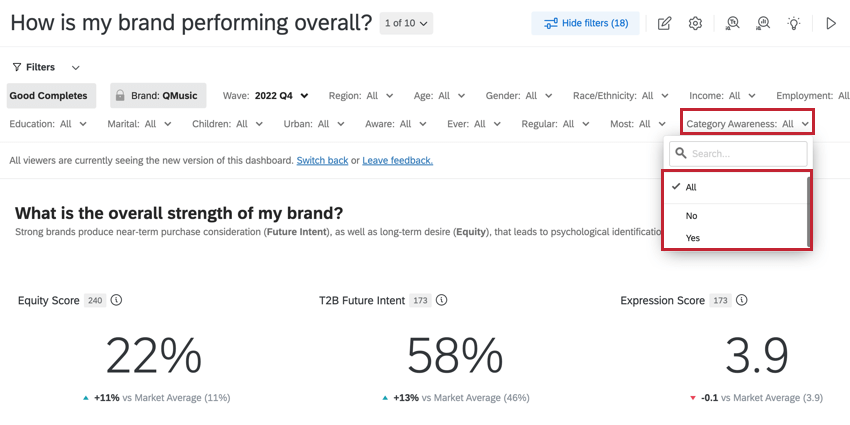
BRAND FUNNEL FILTERS
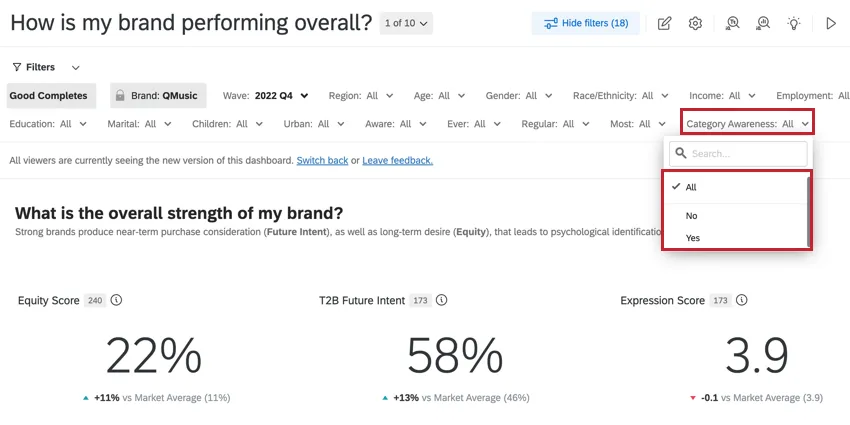
Brand funnel filters are page filters that let you cut your data by different layers of your brand awareness and usage metrics. Brand funnel filters are built using data from either a selection list or a yes/no question type.
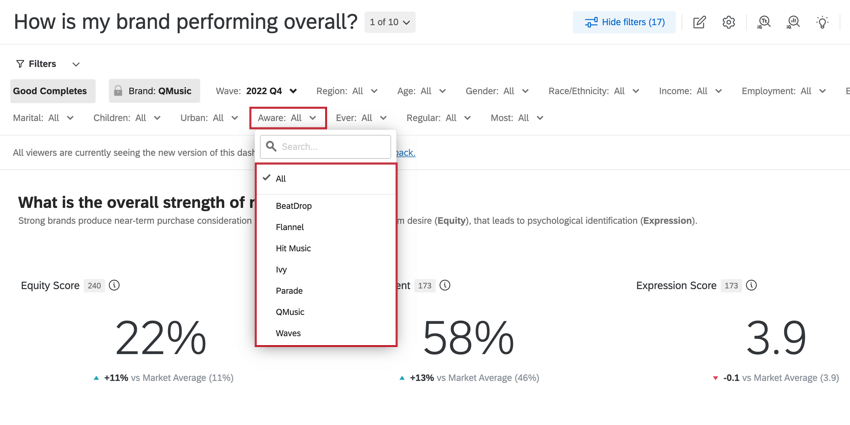
- Selection list: Filter the funnel data for a particular brand or brands. This provides a consistent base and is recommended when analyzing non-category data. Example: Selecting “QMusic” would filter all widgets to respondents who are aware of QMusic. They may also be aware of other brands, as well.

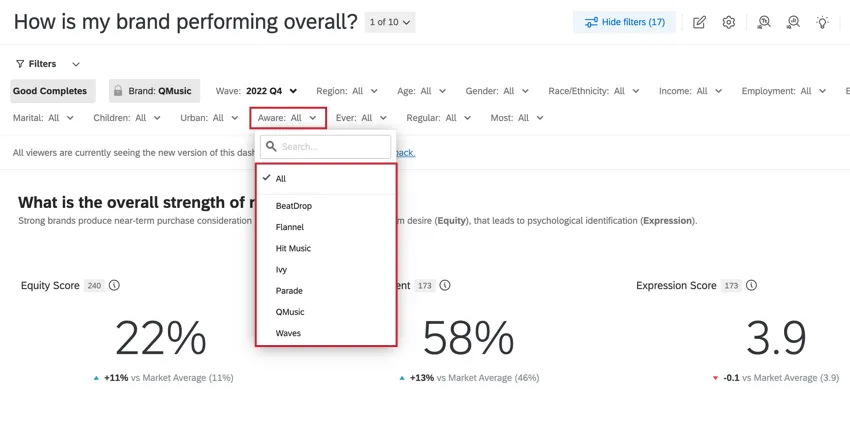 Qtip: Selection fields should only be used to build brand funnel filters and should not be used in widget configuration.
- Yes/No: Filter the funnel data into Yes/No responses for each brand. With this filter applied, data for each brand is out of a unique base (e.g., all respondents who answered that they are aware of each brand). This method is recommended for analyzing category-level data, such as only looking at active users of any brand in the category. Example: In the example below, selecting “Yes” would filter all widgets to all brand rows where respondents are [x metric] of the brand.
Unavailable Dashboard Features
The following dashboard features are not included in brand tracker dashboards:
- Benchmark editor
- The User Admin tab Qtip: Even without this feature, you can still share the dashboard with other users.
- Action planning
- Ticket reporting
- Project administrators are replaced by collaboration, which functions similarly.
Sharing BX Dashboards
You can choose to share the dynamic BX dashboard with another Qualtrics user, export the results to an image or spreadsheet file, or set up recurring emails to key stakeholders.
To learn more, see Sharing Your Dashboard Projects. Keep in mind that any references this page makes to “User Admin” do not apply to BX dashboards.
That's great! Thank you for your feedback!
Thank you for your feedback!