You may be already using quantitative research and want to check your understanding, or you may be starting from the beginning. Here’s an exploration of this research method and how you can best use it for maximum effect for your business.
What is quantitative research?
Quantitative is the research method of collecting quantitative data – this is data that can be converted into numbers or numerical data, which can be easily quantified, compared, and analysed.
Quantitative research deals with primary and secondary sources where data is represented in numerical form. This can include closed-question poll results, statistics, and census information or demographic data.
Quantitative data tends to be used when researchers are interested in understanding a particular moment in time and examining data sets over time to find trends and patterns.
To collect numerical data, surveys are often employed as one of the main research methods to source first-hand information in primary research. Qualitative research can also come from third-party research studies.
Quantitative research is widely used in the realms of social sciences, such as psychology, economics, sociology, and marketing.
Research teams collect data that is significant to proving or disproving a hypothesis research question – known as the research objective. When they collect quantitative data, researchers will aim to use a sample size that is representative of the total population of the target market they’re interested in.
Then the data collected will be manually or automatically stored and compared for insights.
Learn how Qualtrics can enhance & simplify the quantitative research process
Qualitative vs quantitative research
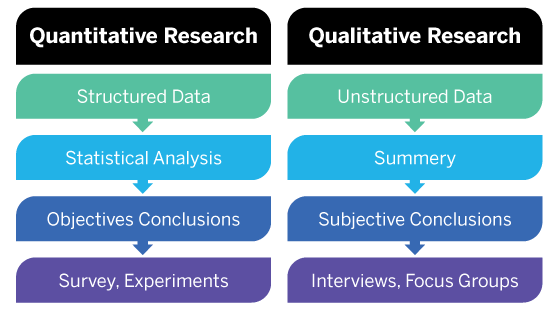
While the quantitative research definition focuses on numerical data, qualitative research is defined as data that supplies non-numerical information.
Qualitative research focuses on the thoughts, feelings, and values of a participant, to understand why people act in the way they do. They result in data types like quotes, symbols, images, and written testimonials.
These data types tell researchers subjective information, which can help us assign people into categories, such as a participant’s religion, gender, social class, political alignment, likely favoured products to buy, or their preferred training learning style.
For this reason, qualitative research is often used in social research, as this gives a window into the behaviour and actions of people.

In general, if you’re interested in measuring something or testing a hypothesis, use quantitative methods. If you want to explore ideas, thoughts, and meanings, use qualitative methods.
However, quantitative and qualitative research methods are both recommended when you’re looking to understand a point in time, while also finding out the reason behind the facts.
Quantitative research data collection methods
Quantitative research methods can use structured research instruments like:
Surveys
A survey is a simple-to-create and easy-to-distribute research method, which helps gather information from large groups of participants quickly. Traditionally, paper-based surveys can now be made online, so costs can stay quite low.
Quantitative questions tend to be closed questions that ask for a numerical result, based on a range of options, or a yes/no answer that can be tallied quickly.
Face-to-face or phone interviews
Interviews are a great way to connect with participants, though they require time from the research team to set up and conduct.
Researchers may also have issues connecting with participants in different geographical regions. The researcher uses a set of predefined close-ended questions, which ask for yes/no or numerical values.
Polls
Polls can be a shorter version of surveys, used to get a ‘flavour’ of what the current situation is with participants. Online polls can be shared easily, though polls are best used with simple questions that request a range or a yes/no answer.
Quantitative data is the opposite of qualitative research, another dominant framework for research in the social sciences, explored further below.
Quantitative data types
Quantitative research methods often deliver the following data types:
- Age
- Income
- Test Scores
- Per cent of training course completed
- Performance score out of 100
- Number of support calls active
- Customer Net Promoter Score (NPS)
When gathering numerical data, the emphasis is on how specific the data is, and whether they can provide an indication of what ‘is’ at the time of collection. Pre-existing statistical data can tell us what ‘was’ for the date and time range that it represented.
Quantitative research design methods (with examples)
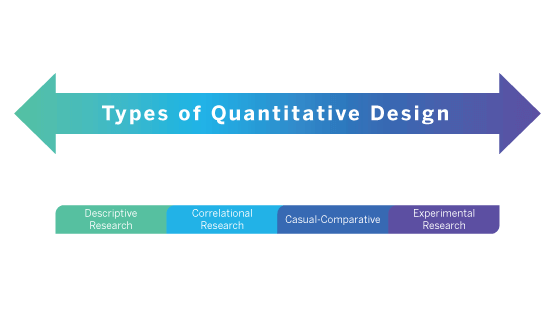
Quantitative research has a number of quantitative research designs you can choose from:

Descriptive
This design type describes the state of a data type is telling researchers, in its native environment. There won’t normally be a clearly defined research question to start with. Instead, data analysis will suggest a conclusion, which can become the hypothesis to investigate further.
Examples of descriptive quantitative design include:
- A description of child’s Christmas gifts they received that year
- A description of what businesses sell the most of during Black Friday
- A description of a product issue being experienced by a customer
Correlational
This design type looks at two or more data types, the relationship between them, and the extent that they differ or align. This does not look at the causal links deeper – instead statistical analysis looks at the variables in a natural environment.
Examples of correlational quantitative design include:
- The relationship between a child’s Christmas gifts and their perceived happiness level
- The relationship between a business’ sales during Black Friday and the total revenue generated over the year
- The relationship between a customer’s product issue and the reputation of the product
Causal-Comparative/Quasi-Experimental
This design type looks at two or more data types and tries to explain any relationship and differences between them, using a cause-effect analysis. The research is carried out in a near-natural environment, where information is gathered from two groups – a naturally occurring group that matches the original natural environment, and one that is not naturally present.
This allows for causal links to be made, though they might not be correct, as other variables may have an impact on results.
Examples of causal-comparative/quasi-experimental quantitative design include:
- The effect of children’s Christmas gifts on happiness
- The effect of Black Friday sales figures on the productivity of company yearly sales
- The effect of product issues on the public perception of a product
Experimental Research
This design type looks to make a controlled environment in which two or more variables are observed to understand the exact cause and effect they have. This becomes a quantitative research study, where data types are manipulated to assess the effect they have. The participants are not naturally occurring groups, as the setting is no longer natural. A quantitative research study can help pinpoint the exact conditions in which variables impact one another.
Examples of experimental quantitative design include:
- The effect of children’s Christmas gifts on a child’s dopamine (happiness) levels
- The effect of Black Friday sales on the success of the company
- The effect of product issues on the perceived reliability of the product
Quantitative research methods need to be carefully considered, as your data collection of a data type can be used to different effects. For example, statistics can be descriptive or correlational (or inferential). Descriptive statistics help us to summarise our data, while inferential statistics help infer conclusions about significant differences.
Advantages of quantitative research
- Easy to do: Doing quantitative research is more straightforward, as the results come in numerical format, which can be more easily interpreted.
- Less interpretation: Due to the factual nature of the results, you will be able to accept or reject your hypothesis based on the numerical data collected.
- Less bias: There are higher levels of control that can be applied to the research, so bias can be reduced, making your data more reliable and precise.
Disadvantages of quantitative research
- Can’t understand reasons: Quantitative research doesn’t always tell you the full story, meaning you won’t understand the context – or the why, of the data you see, why do you see the results you have uncovered?
- Useful for simpler situations: Quantitative research on its own is not great when dealing with complex issues. In these cases, quantitative research may not be enough.
How to use quantitative research to your business’s advantage
Quantitative research methods may help in areas such as:
- Identifying which advert or landing page performs better
- Identifying how satisfied your customers are
- How many customers are likely to recommend you
- Tracking how your brand ranks in awareness and customer purchase intent
- Learn what consumers are likely to buy from your brand.
6 steps to conducting good quantitative research
Businesses can benefit from quantitative research by using it to evaluate the impact of data types. There are several steps to this:
- Define your problem or interest area: What do you observe is happening and is it frequent? Identify the data type/s you’re observing.
- Create a hypothesis: Ask yourself what could be the causes for the situation with those data types.
- Plan your quantitative research: Use structured research instruments like surveys or polls to ask questions that test your hypothesis.
- Data Collection: Collect quantitative data and understand what your data types are telling you. Using data collected on different types over long time periods can give you information on patterns.
- Data analysis: Does your information support your hypothesis? (You may need to redo the research with other variables to see if the results improve)
- Effectively present data: Communicate the results in a clear and concise way to help other people understand the findings.
Learn how Qualtrics can enhance & simplify the quantitative research process