
Global Other Reporting (Studio)
What's on this page
About “Global Other” Reporting
Each category model has a “Global Other” bucket, which is a special node containing uncategorized data within a larger category model. This way you can identify ideas, topics, words, and new themes to improve your model; for example, you can make sure the model isn’t missing topics that are important to your business.
Global Other reporting is valuable for measuring category model performance, particularly during the first few months of implementation, so you can investigate unknown or emerging trends.
How Documents Are Sorted into “Global Other”
The Global Other bucket is a collection of all of the sentences that pass the criteria for the root node of a model but not for any categories within that model. It represents “everything left over” after classification.
To end up in the Global Other bucket, a document must match the following conditions:
- Each sentence in a document cannot match any of the topics in a category model. If at least 1 sentence gets categorized into any topic, the whole document is treated as categorized.
- If a category model has a root-level rule, the document must match it. If a document doesn’t match the root-level rule, it isn’t considered for categorization into the model and doesn’t appear in that model’s Global Other bucket.
For conversational data, Global Other categorization operates at the interaction-level, showing you the volume and percentage of documents that aren’t categorized. This means there are likely many sentences that are uncategorized, even when every single document may be categorized. For example, just because someone mentioned a customer journey topic in every call doesn’t mean a topic occurred in every sentence in every call.
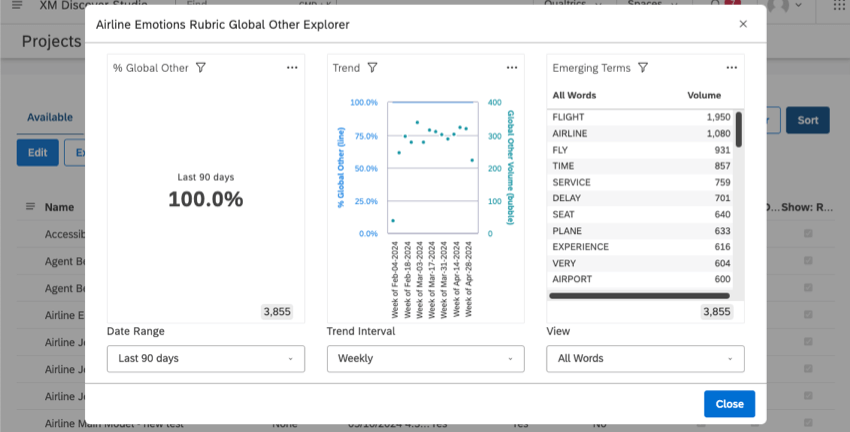
Exploring Uncategorized Data in Studio
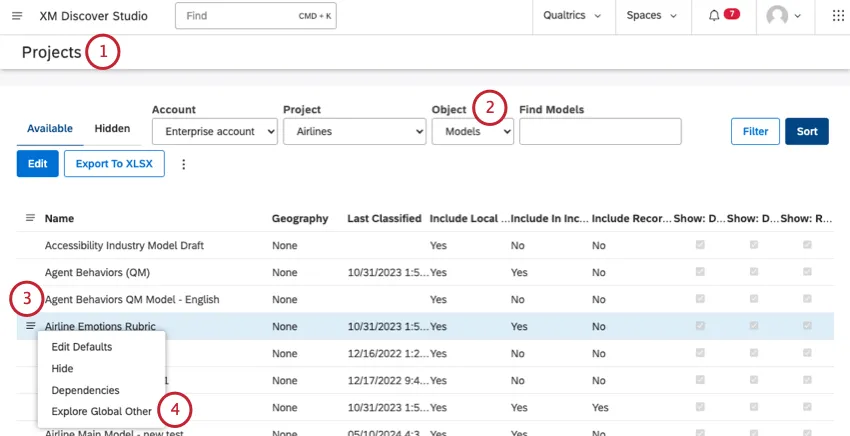
You’ll see the page shown in the screenshot below. We’ll explain each of these charts in more detail below.

The Date Range filter at the bottom affects the data shown in all 3 of the widgets. For more information on how date filters work, see Date Range Filters.
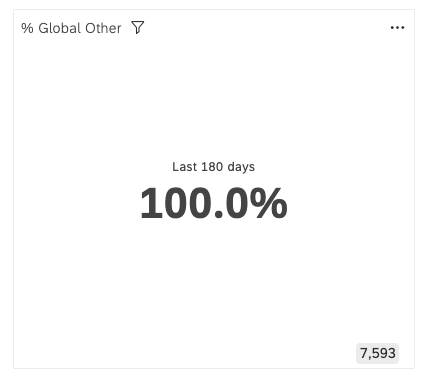
% Global Other
Percent Global Other shows the percentage of uncategorized documents over the selected date range. The percentage is calculated using the following formula:
% Global Other = (Documents in Global Other) / (Documents in Global Other + Categorized Documents) * 100
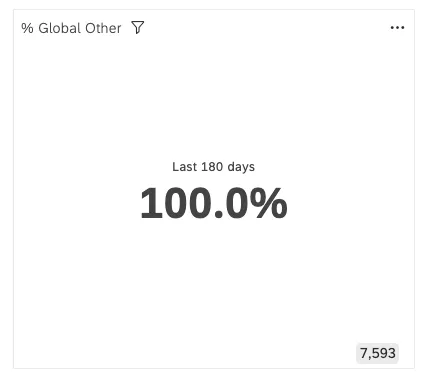
The number in the bottom-right shows the total number of documents that fit into the Global Other bucket in this timeframe.
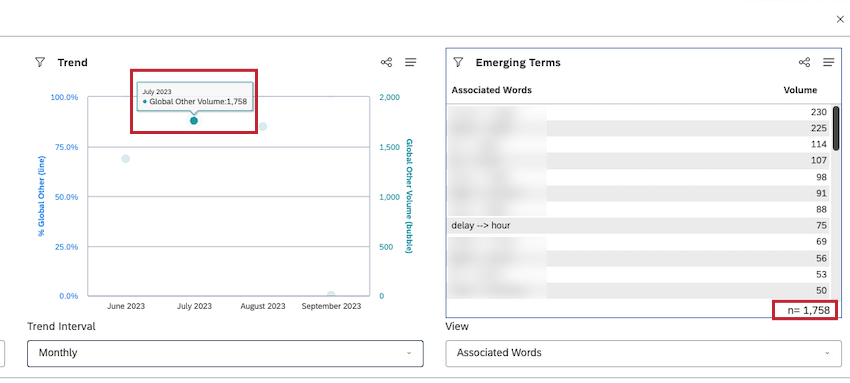
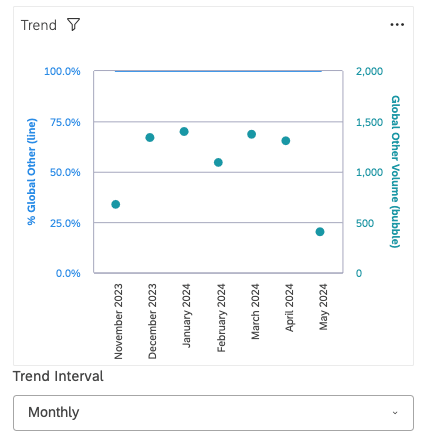
Trend
The Trend widget displays how many documents fit into the Global Other bucket over a selected time interval.
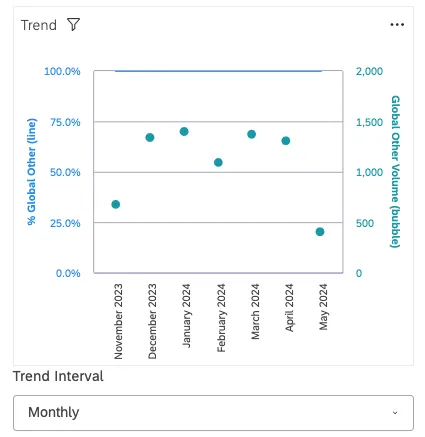
- The primary y-axis displays the Percent Global Other metric as a line. Qtip: In the example above, the line is at the top, only barely visible at the 100% mark.

- The secondary y-axis displays Global Other volume as data points.
- The x-axis displays the timeframe you’ve filtered for.
Using the Trend Interval filter, you can break out data on a weekly or monthly time interval.
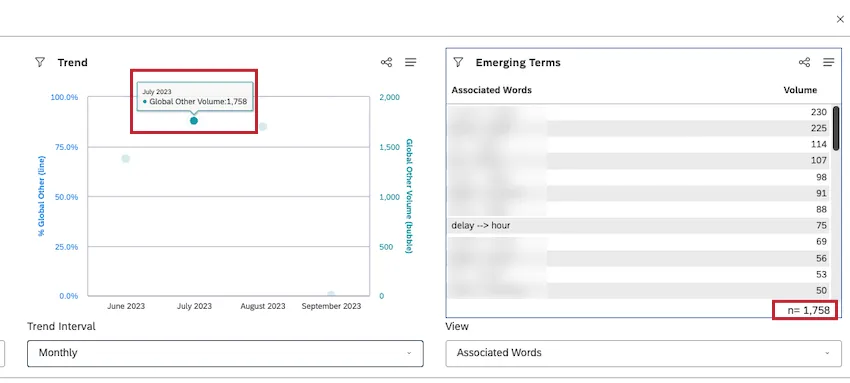
Qtip: Click any data point in the Trend widget to filter the Emerging Terms widget by that time period.
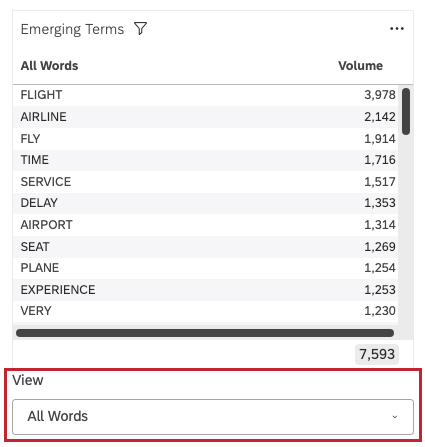
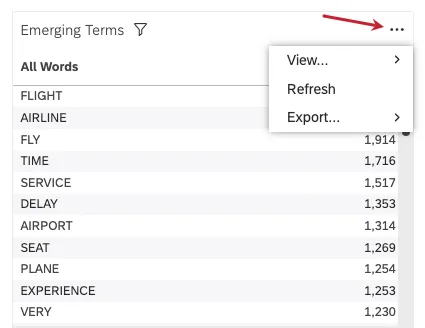
Emerging Terms
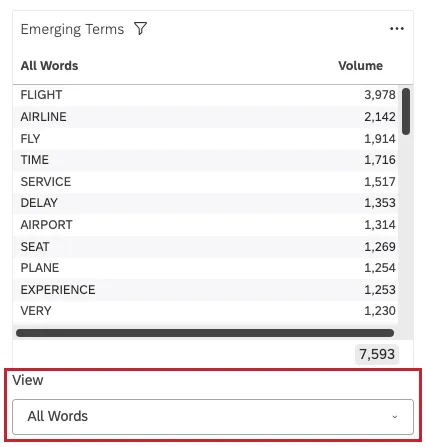
The Emerging Terms widget displays top words, associated words, or hashtags from the Global Other bucket over the selected date range and time interval.
In the View menu, you can change what’s displayed in this widget:
- All Words: Show the most common words from the Global Other bucket.
- Associated Words: Display the most common pairs of linguistically connected words from the Global Other bucket.
- Hashtags: Show the most common hashtags from the Global Other bucket.
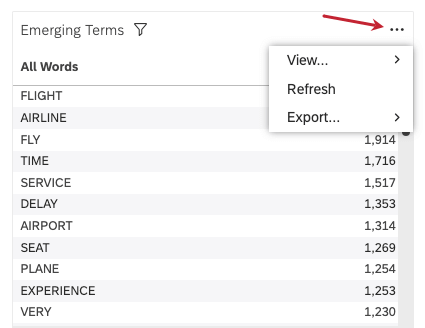
Widget Options
When you click the 3 dots in the upper-right of an of the 3 widgets, you have a few different options:
- View
- Data as a table: View the data in table format, instead. See Viewing Widget Data as a Table.
- Grouping totals (Emerging Terms only): See the total number of documents included in the widget. This will be the total volume across all of the top terms shown.
- Refresh: Refresh the data in the widget. See Refreshing Report Data.
- Export
- Widget data: Export the widget data as an Excel sheet. See Exporting Data From a Widget to Excel.
- As image: Export a widget to a PNG. See Saving a Widget as an Image.
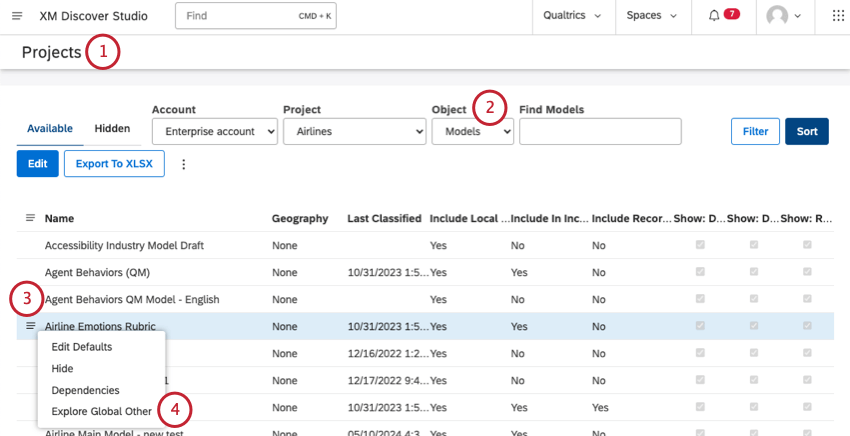
Exploring Uncategorized Data in Designer
If you have access to Designer, you can also explore your uncategorized data there. See Uncategorized Data for more details.
FAQs
What is a node?
What is a node?
For example, your category tree may be Airline Journey, and includes topics like Booking Functionality, Payment, Upgrades, and more, which all might have topics underneath them, as well. Each branching topic is a node. “Airline Journey” would be the root node.
What is considered a document?
What is considered a document?
What is the difference between feedback and conversational data?
What is the difference between feedback and conversational data?
Conversational (or dialogic data) includes transcribed conversations between representatives (or bots) and customers on audio and digital channels.
One of XM Discover’s strengths is its ability to adapt its text analytics to the differing needs of different kinds of data. For each of these kinds of data, you’ll see different information available in document explorer, as described on this page.
What’s the difference between a category and a node?
What’s the difference between a category and a node?
What is the difference between Global Other and Local Other?
What is the difference between Global Other and Local Other?
The Local Other bucket is a collection of all sentences that pass the criteria for a node in a model (other than the root node), but not the criteria for any of its subcategories. The Local Other bucket is a special node for sentences that match the parent topic, but none of its child topics.
That's great! Thank you for your feedback!
Thank you for your feedback!