
Analyzing Model Recall (Studio)
What's on this page
About Analyzing Model Recall
One of the ways to evaluate the effectiveness of a categorization model is to measure its recall. Recall is the percentage of documents that were categorized into a particular model.
To analyze model recall, you should compare the percentage of documents categorized into the model with the number of documents not categorized. To do this, you can create 2 metrics: one for categorized data, the other for uncategorized data.
Qtip: Interested in exploring your data further? See our pages on Filtering by an Entire Category Model and Exploring Uncategorized Data (global other).
Creating a Percent Categorized Metric
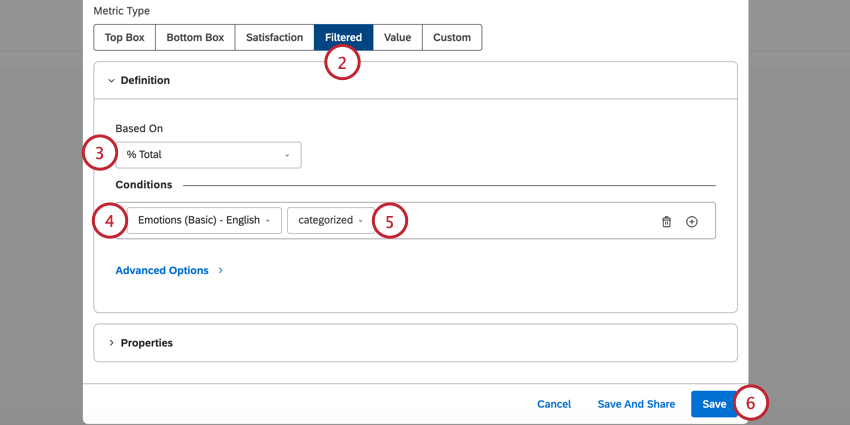
Qtip: If a model has root-level rules, the “categorized” condition returns all documents that match the root-level rule. However, no other categories within that model are taken into account. To learn more about these results, see How Root-Level Rules Affect the Categorized Filter.
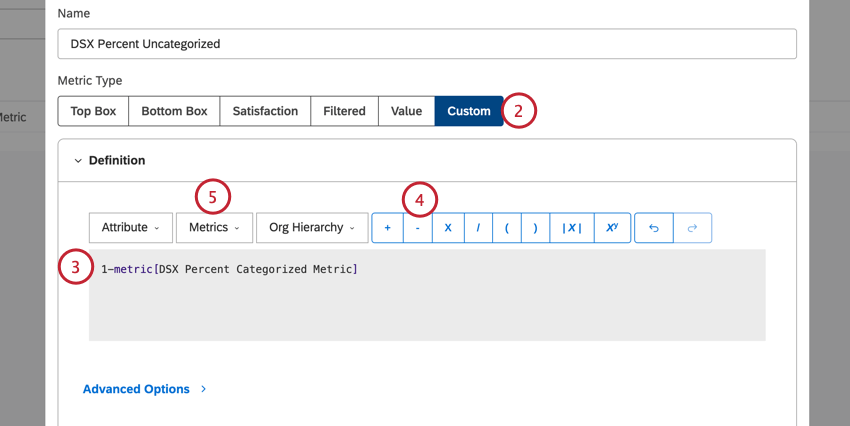
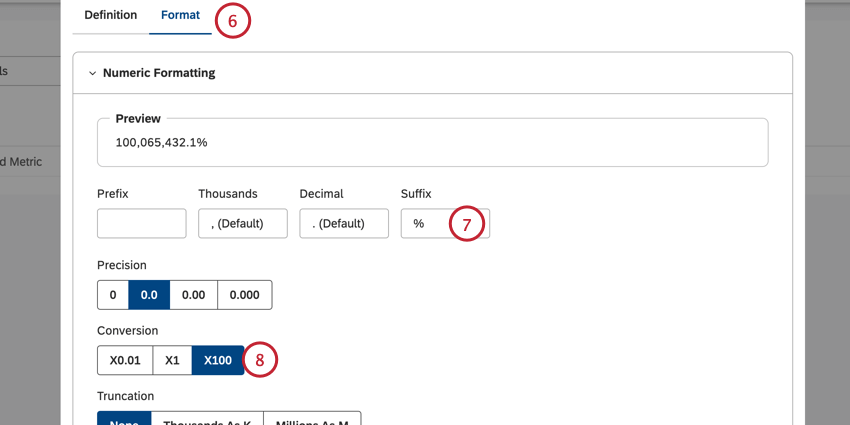
Creating a Percent Uncategorized Metric
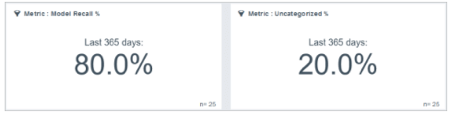
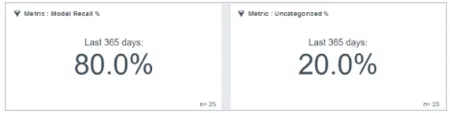
Displaying the Results
Once you’ve built your metrics, you can display them in widgets like any other metric (for example, displaying 1 value in a metric widget, or displaying both values in a pie widget). These metrics can be used interchangeably depending on your analysis.
That's great! Thank you for your feedback!
Thank you for your feedback!