
Calculating a Group’s Contribution to Overall Scores (Studio)
What's on this page
About Individual Groups’ Contributions to Overall Scores
You can use filtered and custom math metrics to calculate what an individual group contributed to an overall score.
Example: You work for an airport. In your data, you differentiate between different types of travelers, such as those traveling for business vs. leisure. When you look at your airport’s sentiment performance, you want to know how leisure travelers contributed to your airport’s overall sentiment.
To calculate this group’s contribution to overall sentiment, you’ll need to complete 3 steps:
Step 1: Group Sentiment for Leisure Travelers
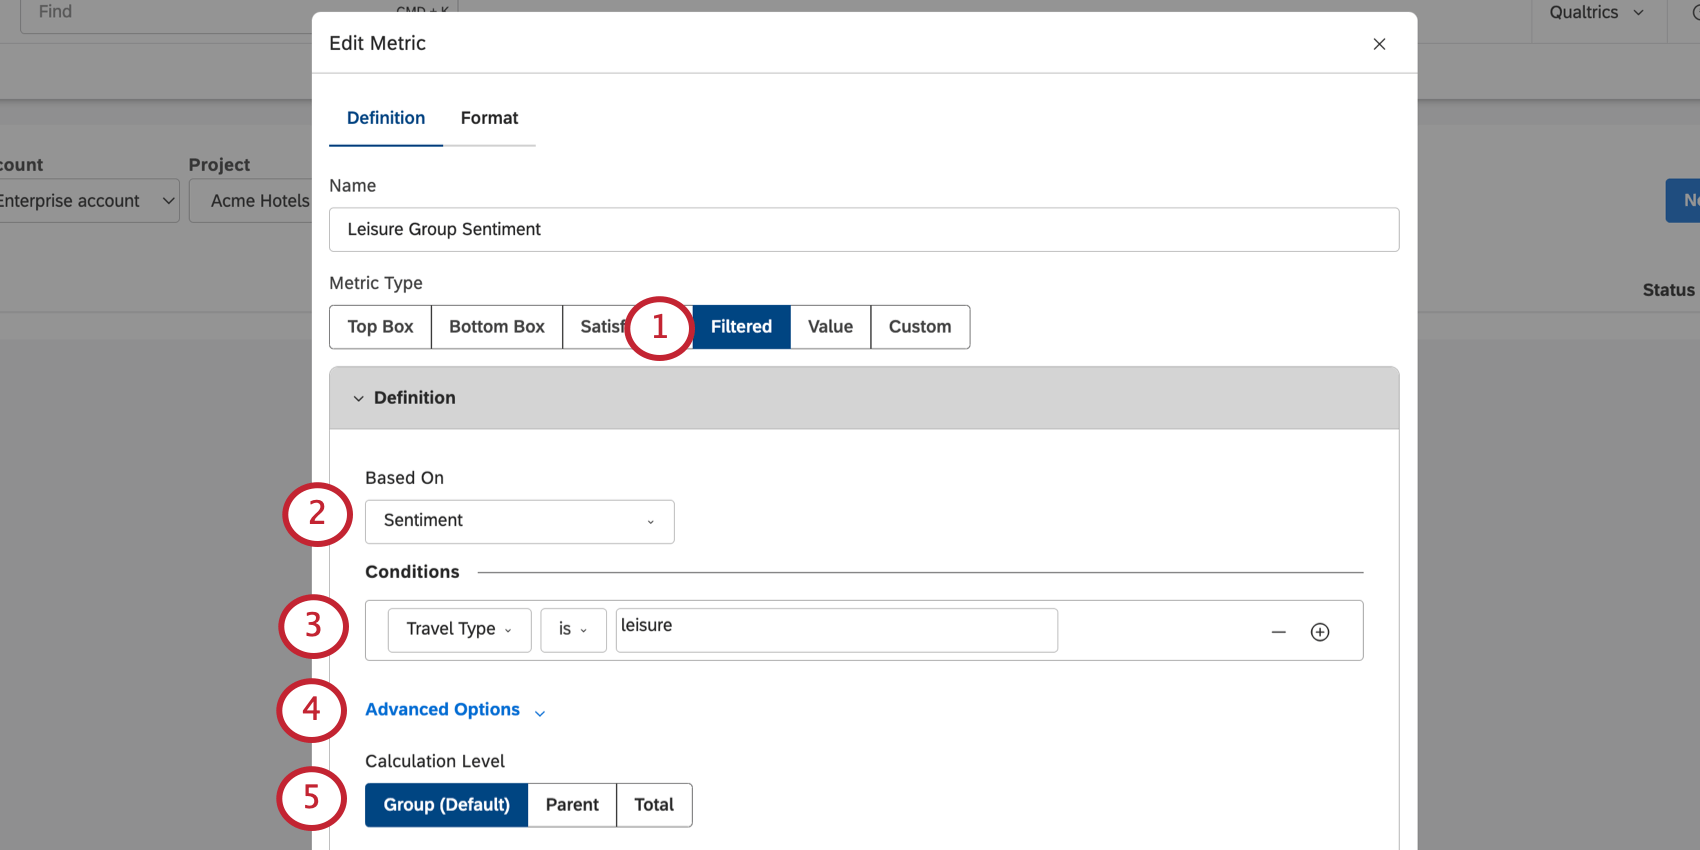
Create a filtered metric that calculates the group sentiment for leisure travelers.
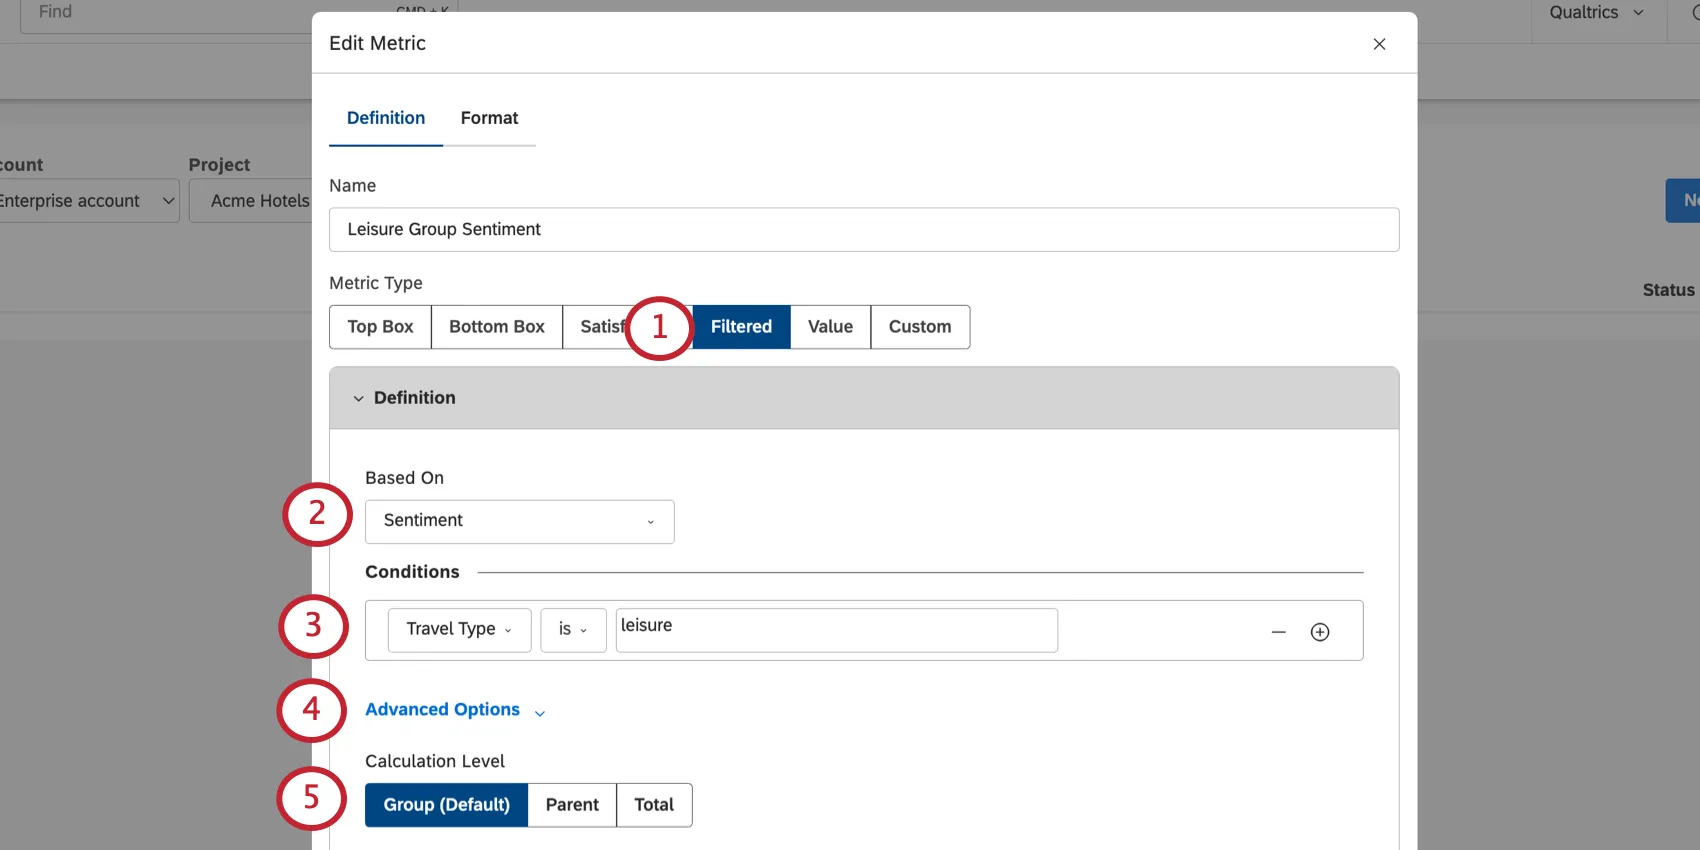
Example: You may have an attribute called Trip Purpose and set it equal to leisure.
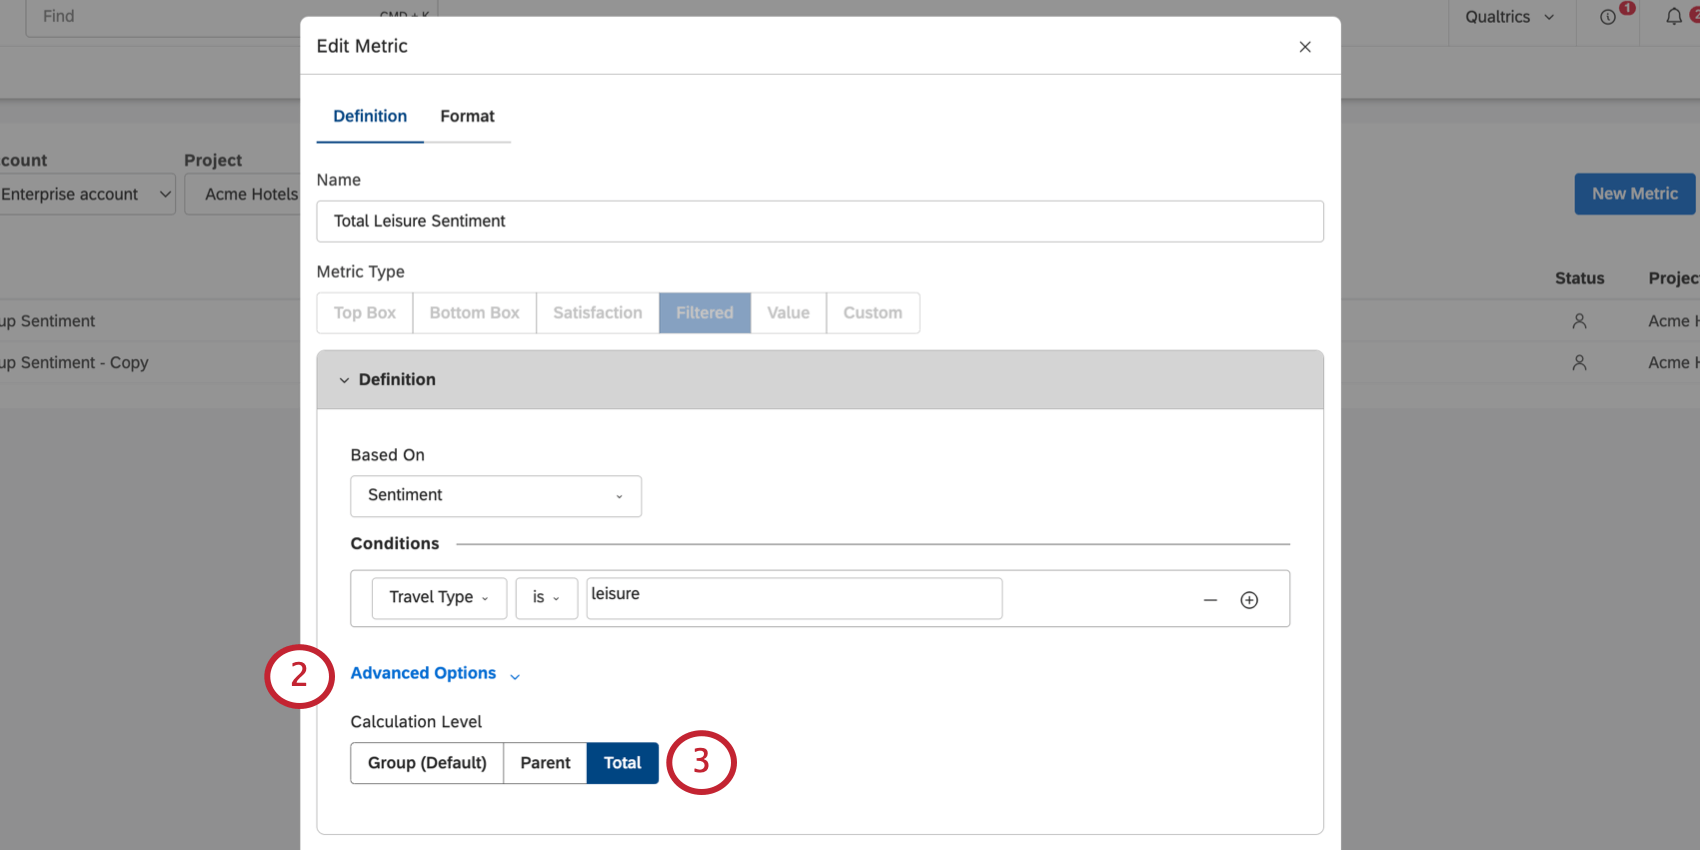
Step 2: Total Sentiment for Leisure Travelers
Create a filtered metric that calculates the total sentiment for leisure travelers.
Qtip: These metrics should have the same conditions and be based on sentiment.
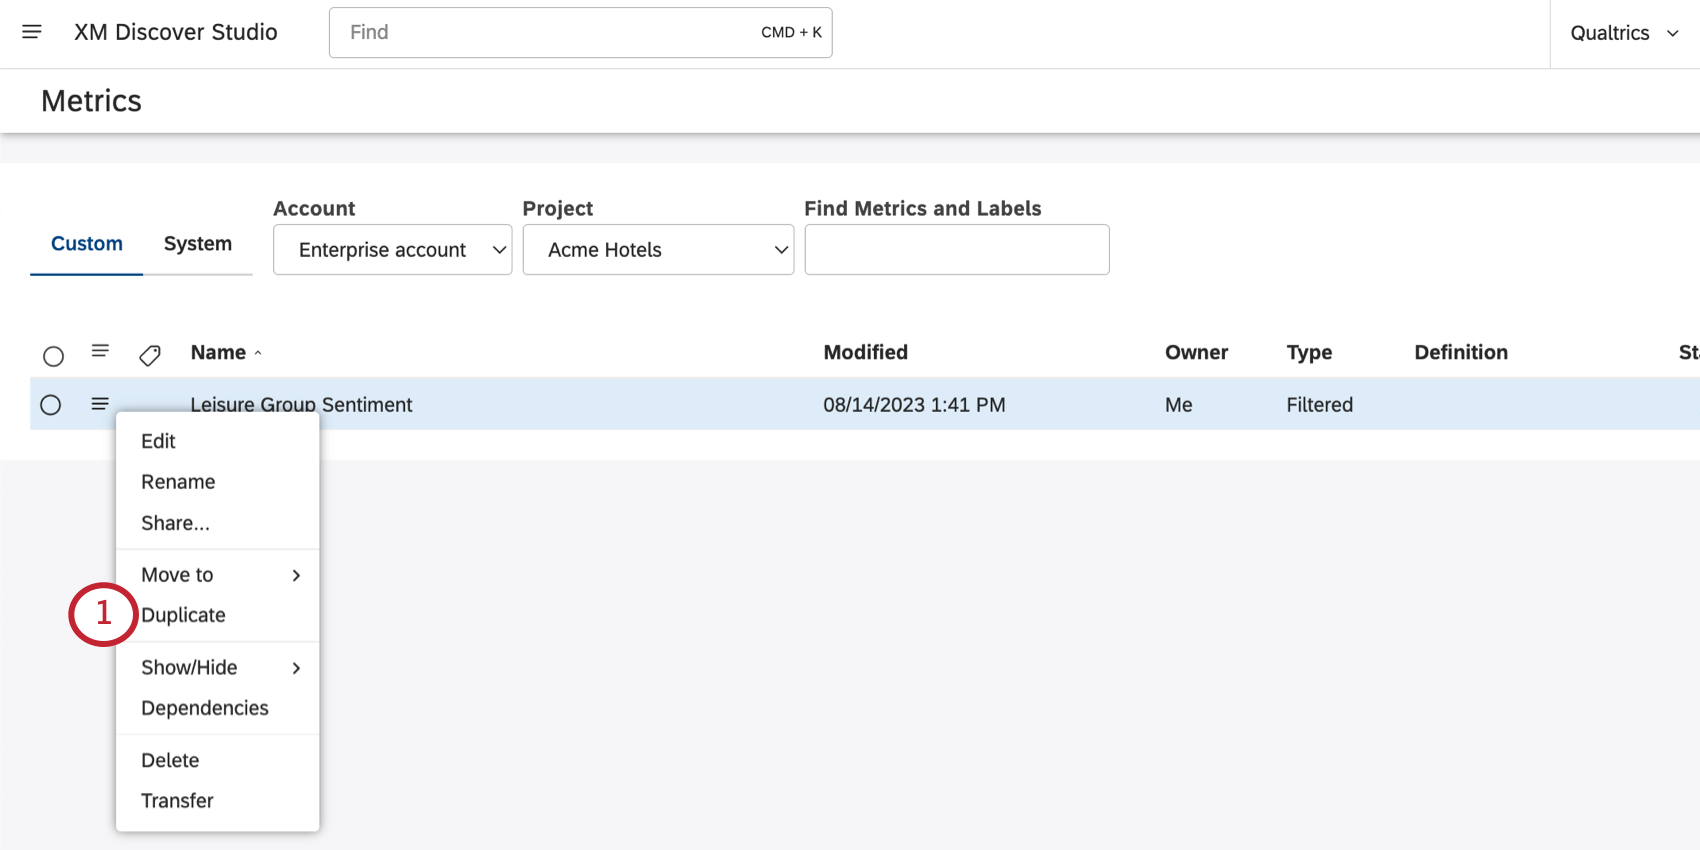
Step 3: Contribution of Leisure Travelers
Now it’s time to determine the contribution leisure travelers made to the overall sentiment.
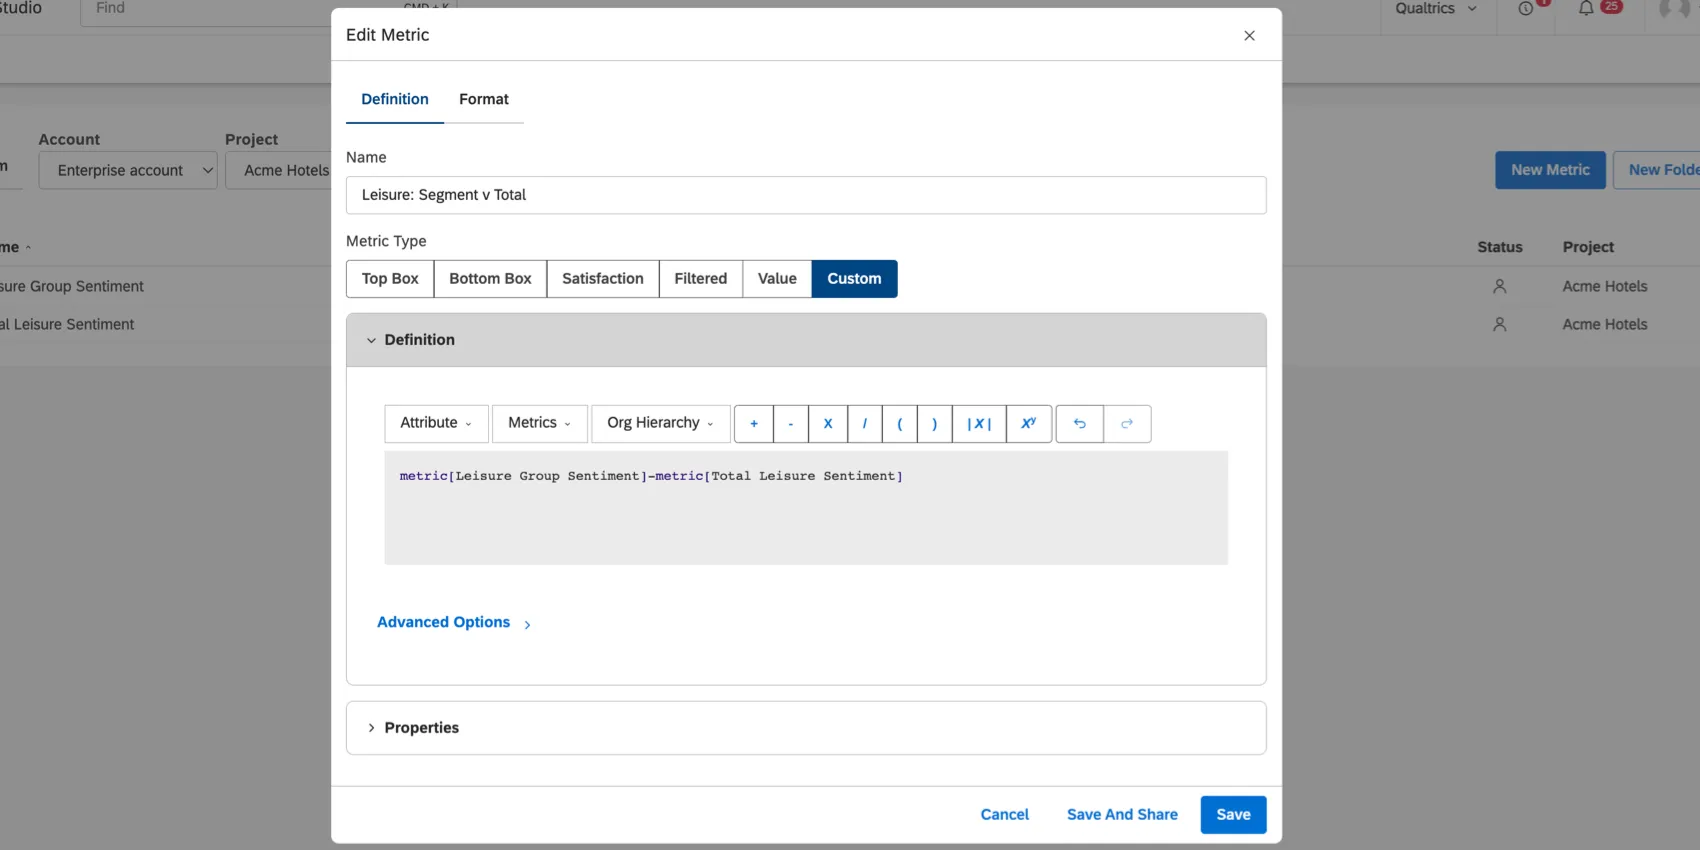
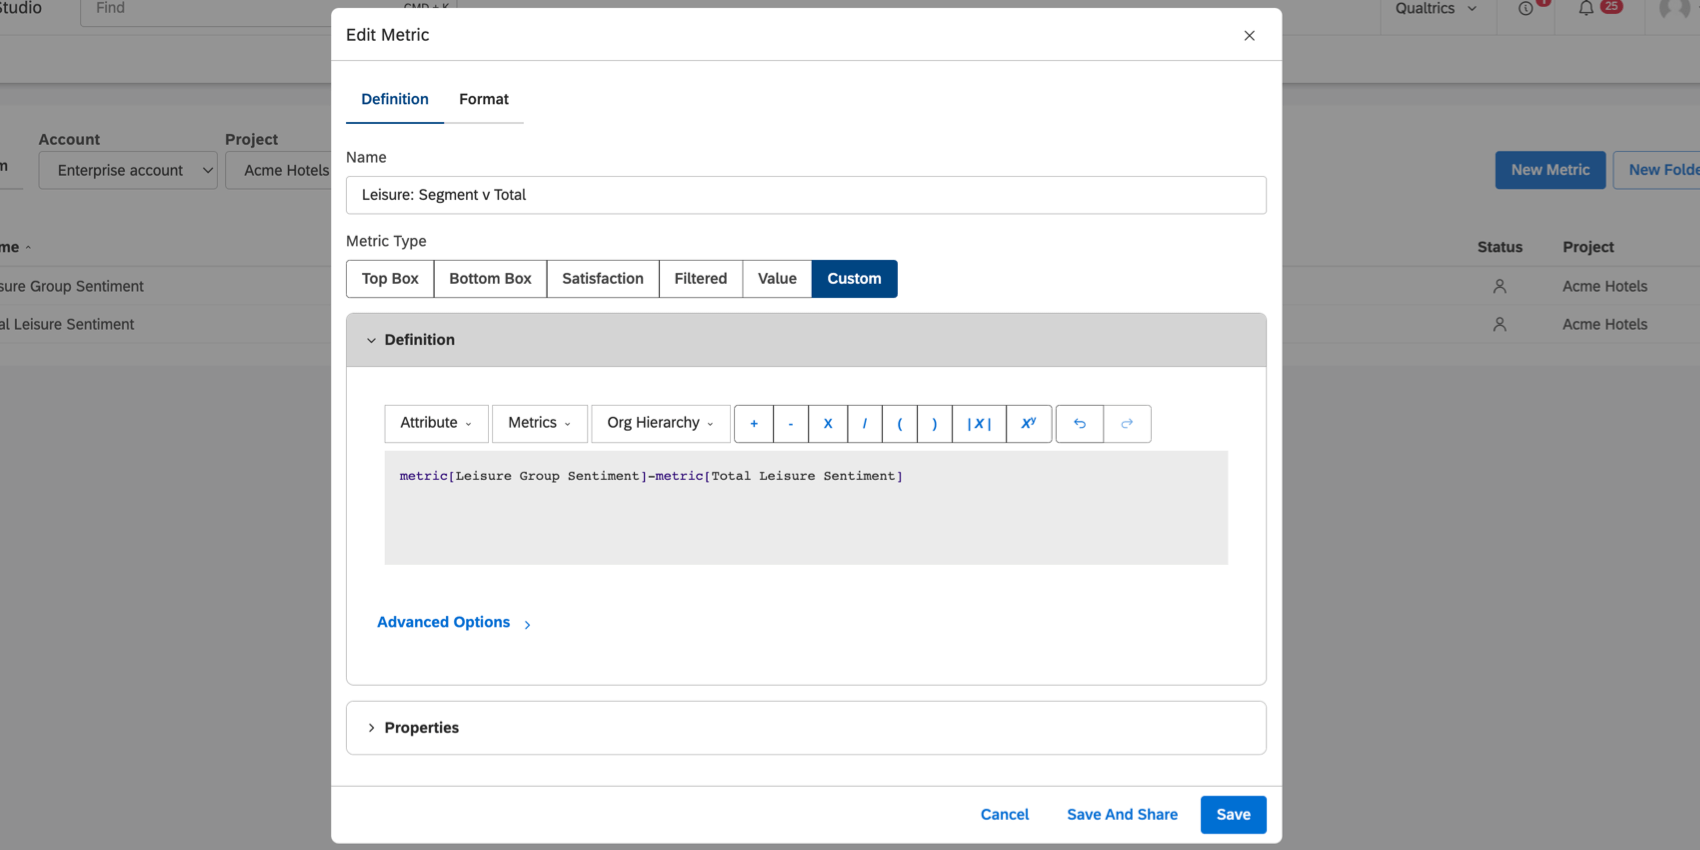
Create a custom math metric that shows the difference between the Leisure Group Sentiment and Total Leisure Sentiment.
Example: The formula can vary based on how you named your metrics. However, this is how we calculated ours:
metric[Leisure Group Sentiment]-metric[Total Leisure Sentiment]
You can now use this metric to create widgets in your Studio dashboards.
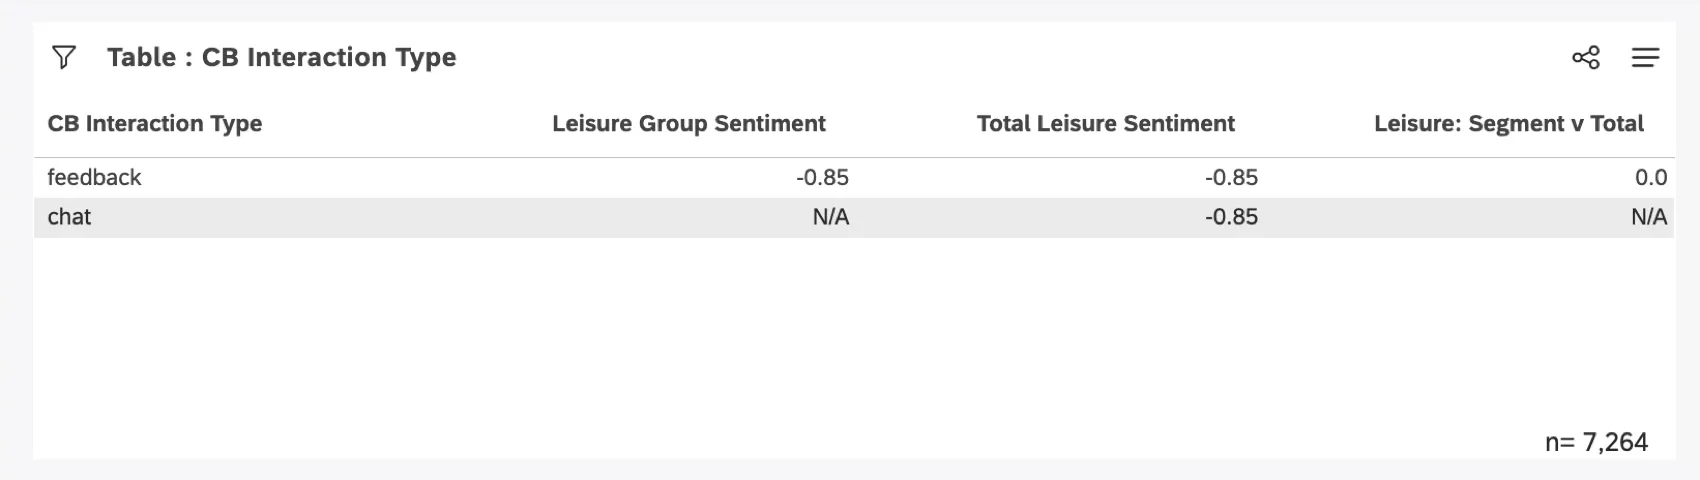
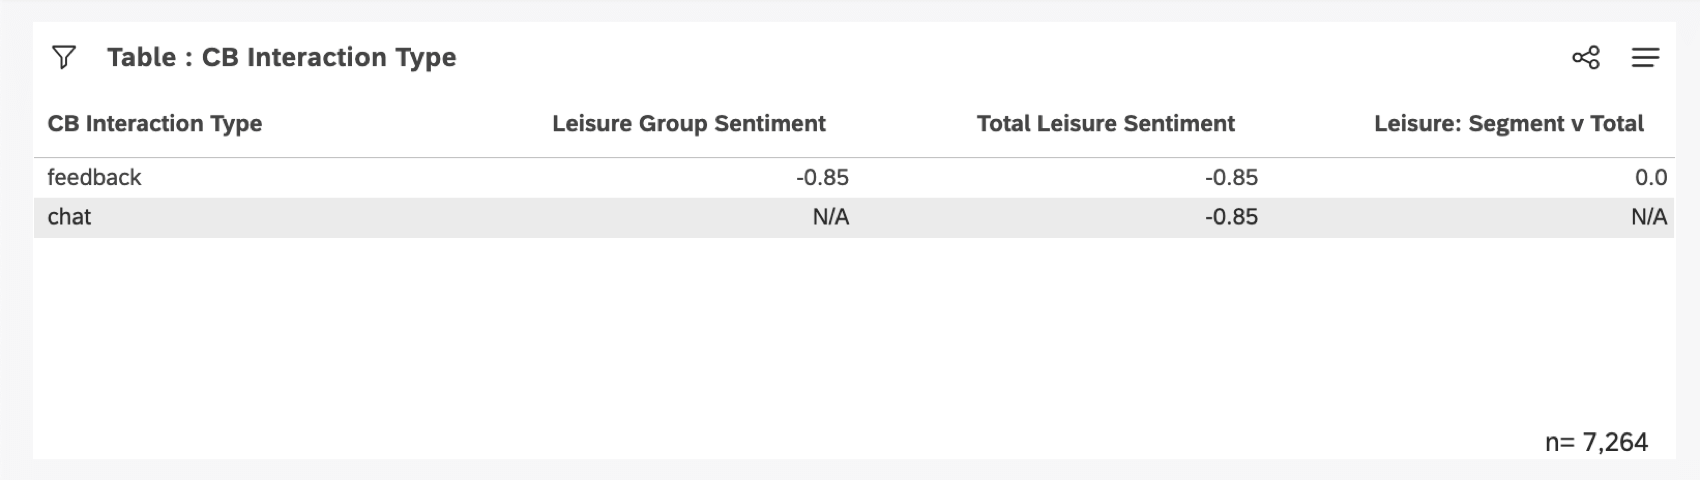
Example: Here’s a table showing group sentiment, total sentiment, and the difference, broken. These results are further broken out by interaction type.
That's great! Thank you for your feedback!
Thank you for your feedback!