Loading...
Skip to article
  • Qualtrics Platform
    Qualtrics Platform
  • Customer Journey Optimizer
    Customer Journey Optimizer
  • XM Discover
    XM Discover
  • Qualtrics Social Connect
    Qualtrics Social Connect

Creating App Configurations (Discover)


Was this helpful?


This site is protected by reCAPTCHA and the Google Privacy Policy and Terms of Service apply.

The feedback you submit here is used only to help improve this page.

That’s great! Thank you for your feedback!

Thank you for your feedback!


About App Configurations

App configurations let you choose the data you want to display in XM Discover Pulse, how you want to display it, and the users you want to display it to. Creating an app configuration is the first step in making XM Discover Pulse available to users in your master account.

Each configuration is managed separately and can have a unique set of data, customizations, and users. Users with access to multiple configurations can navigate between them in the XM Discover Pulse app.

On this page, we’ll talk about how to create an app configuration.

Creating an App Configuration

You can create up to 20 app configurations (and enable up to 10 of them). Each app configuration can have a unique set of data and customizations, as well as a unique set of users they’re available to.

Qtip: You need a Manage Settings permission to create an app configuration.
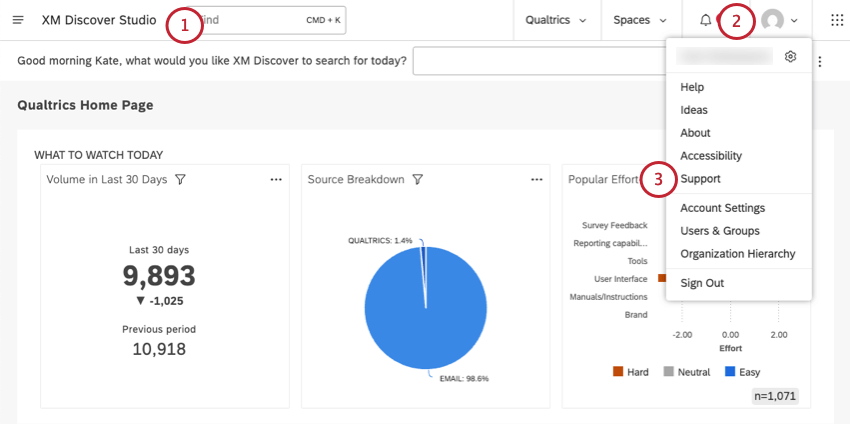
  1. Click the profile icon.
    user profile icon clicked and account settings is one of the options in the menu that opens
  2. Select Account Settings.
  3. Go to Mobile App.
    mobile app page
  4. Click New Mobile Config.

You can now configure the following:

Properties

In the Properties tab, you can name the configuration, determine the data you want to display in the app, and apply filters to the data.

GENERAL SETTINGS

properties tab, general settings section

  • App Name: Provide a name for this configuration. This name will be displayed to Pulse users who have access to multiple configurations.
  • Owner: This field automatically assigns the configuration to your user account.
  • Content Provider: Select a Designer instance to use for this configuration.
  • Account: Select a Designer account to use for this configuration.
  • Project: Select a Designer project to use for this configuration.
  • Organization Hierarchy: Select an organization hierarchy to further refine the data within the app. When an organization hierarchy is applied, app data is automatically personalized and restricted by the hierarchy rules when the user signs into this configuration.
  • Optimization for Performance: This setting lets you trade off some of reports’ precision for better performance. For details, see Dashboard Optimization in Dashboard Properties. For new app configurations, the check box reflects the default dashboard optimization setting from account settings.
    Qtip: We recommend disabling Optimization for Performance to prioritize metric accuracy, unless your project size or request complexity results in slow visualization performance even without it enabled.

DATA FILTERS

The Data Filters section appears once you’ve selected a project in General Settings.

data filters module

Here, you can apply saved, premade, or custom filters to the data within the app.

Qtip: The filters you add here are permanent and cannot be adjusted by app viewers. In contrast, in Customizations, you can add optional filters for viewers to adjust.

To add or remove filters, use the plus ( + ) and minus ( ) buttons on the right.  Multiple selected filters have an AND relationship, meaning that data must satisfy ALL of them.

  • Saved Filters: You can select up to 5 predefined or saved filters. The following types of filters are available:
    • Designer Filters: Select one of the filters created in Designer.
      Attention: In Studio, we recommend avoiding Designer filters that involve verbatim-level rules. Studio dashboards and widgets do not accurately reflect these results.
    • Studio Filters: Select the filters created in Studio.
    • CX Predefined Filters: Select the premade sentiment, effort, or emotional intensity filter.
      Qtip: Use the Effort Detected (Predefined) option to filter documents with at least 1 sentence containing an expression of effort (either hard or easy).
    • Scorecard Filters: Select one of the filters based on the intelligent scoring rubric’s target. You can choose either a passing score or a failing score.
  • Custom Filters: You can create up to 5 custom filters. For details, see Creating a Filter.

App Users

In the App Users tab, you can enable this app configuration and decide which users see it when they log onto the app.

app users tab of window

  1. Go to App Users.
  2. Turn on Enable App Access. This lets any users you’ve shared the configuration with access it on XM Discover Pulse.
  3. Enter users or groups to share the configuration with.
    • Individual Studio users: Find users by email address.
    • Studio groups: Finds groups by name.
    • Organization hierarchy members: Find hierarchies by name.
    • All Studio users: Select Share with all Users.
  4. Select an appropriate access level for each user and group in the Add The following options are available:
    • Can View: When users log into XM Discover Pulse, they can see this app configuration.
    • Can Edit: In addition to being able to see this configuration in the app, users can edit this configuration in the Users & Groups page.
      Qtip: Can Edit access is not available when sharing a configuration with all Studio users.
  5. If you own the app configuration, you’ll also see Allow Editors to Share. Select this option to let other editors share this configuration.
Qtip: You can also share app configurations from the Mobile App page. Click the dropdown next to an app configuration and select Share.
3 line icon next to app clicked, options for edit, share, duplicate, and create as dashboard

Removing Users

You can remove a user’s access to an app configuration. See users under Previously Shared and change their access to Remove Access.

previously shared section of window at the bottom

In the Navigation section of the Screen Setup tab, you can define up to 3 screens where app users can click to filter down to feedback records that match the selected criteria.

The number of screens users see in the app will adjust based on filtering and user data access. For example, you may create 2 screens, but a user may only see 1. Users will be automatically redirected to the first meaningful screen of results or the first screen that contains more than 1 option.

Screen setup tab

  1. Go to Screen Setup.
  2. Click Screen 1 to start setting this screen up.
  3. Under Summary Calculations, select metrics or data groupings you want to show at the top of the app.
    metrics along top of the pulse app

    Qtip: Sentiment, effort, and emotional intensity will be displayed with the associated colors and icon badges.
  4. Click the plus sign ( + ) to add another summary calculation.
    Qtip: You can add 1-3 summary calculations each on screens 1 and 2. The plus sign ( + ) to add a third summary calculation doesn’t appear until you’ve chosen a second summary calculation.
    Qtip: Screen 3 does not include summary calculations.
  5. This field is Grouping. This controls how data is listed on the screen. You can choose any attribute or topic model that exists in your chosen Designer project.
    app screenshot shows sentence types linked, with requests and suggestions, generic negative, and cry for help included as options you can click
  6. Under Grouping Calculation, decide what numeric data to show next to each grouping.
    volume for each sentence type

    Qtip: Sentiment, effort, and emotional intensity will be displayed with the associated colors and icon badges.
    Qtip: For the grouping calculations available, see Calculations.
  7. Click Screen 2 to choose what summary calculations, groupings, and grouping calculations to show after someone clicks a grouping on Screen 1.
  8. If you’d like to add a third screen, select New Screen. This screen will have a grouping and grouping calculation, but no summary calculations.
    a new page deeper in the app

    Qtip: You must have at least 2 navigation screens. Adding a third screen is optional.

Grouping Behavior Between Screens

If you’re setting the same topic for the Grouping in 2 consecutive screens, the screens will automatically be set to filter based on the selection made on the previous screen. This will turn off co-occurrence and only show topic relationships as they are defined in the category model hierarchy.

To change this behavior:

  1. Go to the second of the consecutive screens.
    fixing screen setup

    Example: Both screens 2 and 3 have the Allergen Risk topic set as their grouping. We open Screen 3.
  2. Click the cog icon next to the topic.
  3. Deselect Update when filtered by previous screen.
    inclusion list settings
  4. Click Update.

select the cog icon next to the topic model grouping selected on the 2nd screen and clear the Update when filtered by previous screen option.

Feedback Screens

In the Feedback Screens section, you can control the way individual feedback is displayed and which attributes or topics are shown for context.

feedback screens module

  1. List View: Display what level of feedback is displayed in the list view.
    • Sentence: Show sentence-level feedback. This is the most granular level of feedback.
    • Context: Show snippets. Snippets are sentences in the context of adjacent sentences (with one sentence before and one after).
    • Verbatim: Show sentences in the context of an entire verbatim (or textual feedback field).
  2. Sentiment Text Formatting: Enable sentiment visualization for the list view. This option is only available for Sentence and Context list views.
  3. Show Enrichment Badges: Show additional icons for premade metrics like sentiment, effort, and emotional intensity. This option is only available for Sentence and Context list views.
  4. Document View
    • Sentiment Text Formatting: Enable sentiment visualization for the document-level view.
    • Topics and Attributes Available: Click up to 3 topic models and up to 5 attributes and/or metrics to display along with customer feedback. Note that empty attribute values or topics do not show up.
      chat interaction in the pulse app. more info expanded on the bottom

Customizations

In the Customizations tab, you can decide which filters app viewers can use, as well as control whether or not users can share the feedback they see.

DATE RANGE

You can choose up to 5 preset date range filters to display in the app.

Click date ranges on the left. Click Use as Default to make this the default date range app viewers see when they view this configuration or reset their filters.

customizations tab where you select a date range

Qtip: The longest date range you can set is a quarter (90 days).

FILTERS

Select up to 10 saved or predefined filters for app viewers to use.

saved filter list

Qtip: You can set permanent filters viewers can’t adjust in the Properties tab.

SHARING CONTROL

Determine how app viewers can share the documents they see in the app.

sharing control settings

  • External Sharing: Decide whether app viewers can share feedback through mobile apps like text and email. When this option is enabled, app users will see sharing icons.
  • Create and Share Links: Decide whether app users can create and share links to specific documents. When this option is enabled, the app shows link icons.
  • Feedback Reporting: Decide whether users can report feedback that appears to be categorized to the wrong topic or contains incorrect attributes. When this option is enabled, a flag icon appears in the app that can be used to report inaccuracies.
  • Select Report Recipients: This option is only available if Feedback Reporting is enabled. Choose users who should get emails about inaccuracies reported in app feedback. Find users by email..
    Qtip: Users must have access to the app configuration and have a Configuration Analyst license to be a report recipient.

Saving the App Configuration

When ready, click Save to save the configuration or Cancel to close the window without saving.

save button bottom of the window

If the configuration has errors, you’ll see a banner. Click Jump to Errors to jump to a required setting, define it, and then save your configuration. This banner will disappear when all of your errors have been resolved.

jump to errors

Qtip: For advice on how to avoid errors, see Best Practices for App Setup.

Editing App Configurations

You can edit app configurations from the Mobile App page. Click the dropdown next to an app configuration and select Edit.

3 line icon next to app clicked, options for edit, share, duplicate, and create as dashboard

From there, you can edit the same fields you filled out to create the app configuration.

Best Practices for App Setup

Think about your intended users.

As an app administrator, you have the ability to build a guided experience for your end users. When configuring an app, keep the user’s experience and context in mind:

  • Don’t overwhelm your users with too many options. Be mindful about the amount of feedback you’re loading into the app. When possible, refine data and options to what is the most relevant for your users.
  • Think about when you expect your users to reach for your app. How do you build an app experience that provides the most value quickly?

Create a Test Dashboard

Set up a dashboard in Studio to help test your configurations. See Creating a Dashboard from an App Configuration.

Use a series of table widgets with the use widget as filter functionality to get a one-page view of the data displayed in your app.

Determine Whether Your Data is Sensitive

If data is highly sensitive, we recommend disabling the sharing options (the default).

Pilot Test Your Configuration

When rolling out your app, consider deploying the app to a small stakeholder group before granting access to more users within your organization.

FAQs