-

Qualtrics Platform -

Customer Journey Optimizer -

XM Discover -

Qualtrics Social Connect
Statistics in Website / App Insights Projects
About Statistics in Website / App Insights Projects
In every Website & App Insights project, you can monitor visitor interactions for all intercepts and creatives in the project. You can also view statistics for an individual intercept or creative.
Project Statistics
The Statistics for your entire project is found in the Intercepts tab, under Statistics..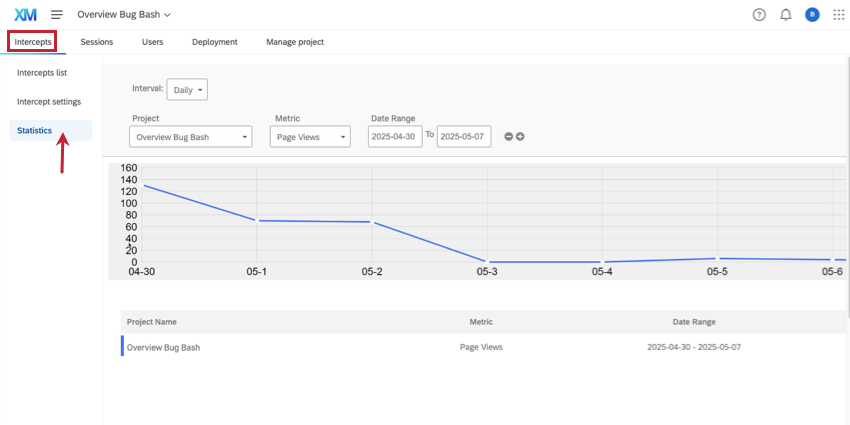
This tab contains:
- Statistics for the entire project – this includes every creative and intercept contained within it.
- Three measurements: Page Views, Clicks, and Impressions.
You can also use the project-level statistics to compare against other Website & App Insights projects.
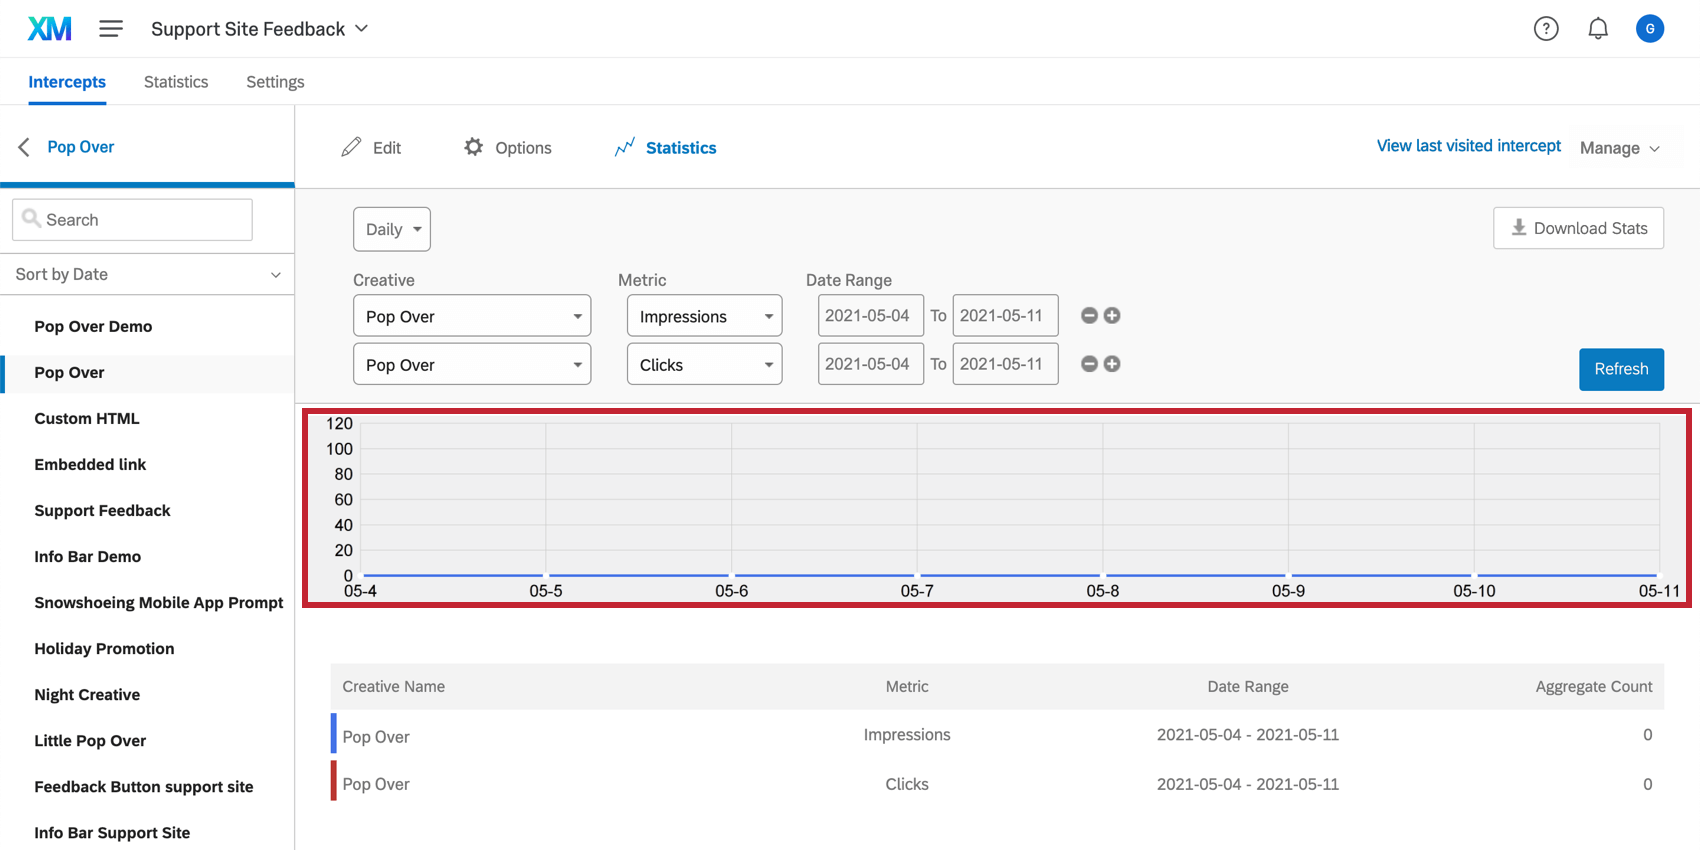
Intercept Statistics Tab
You can view statistics for a specific intercept. After selecting an intercept in your project, click the sub-Statistics tab to view statistics for that intercept.
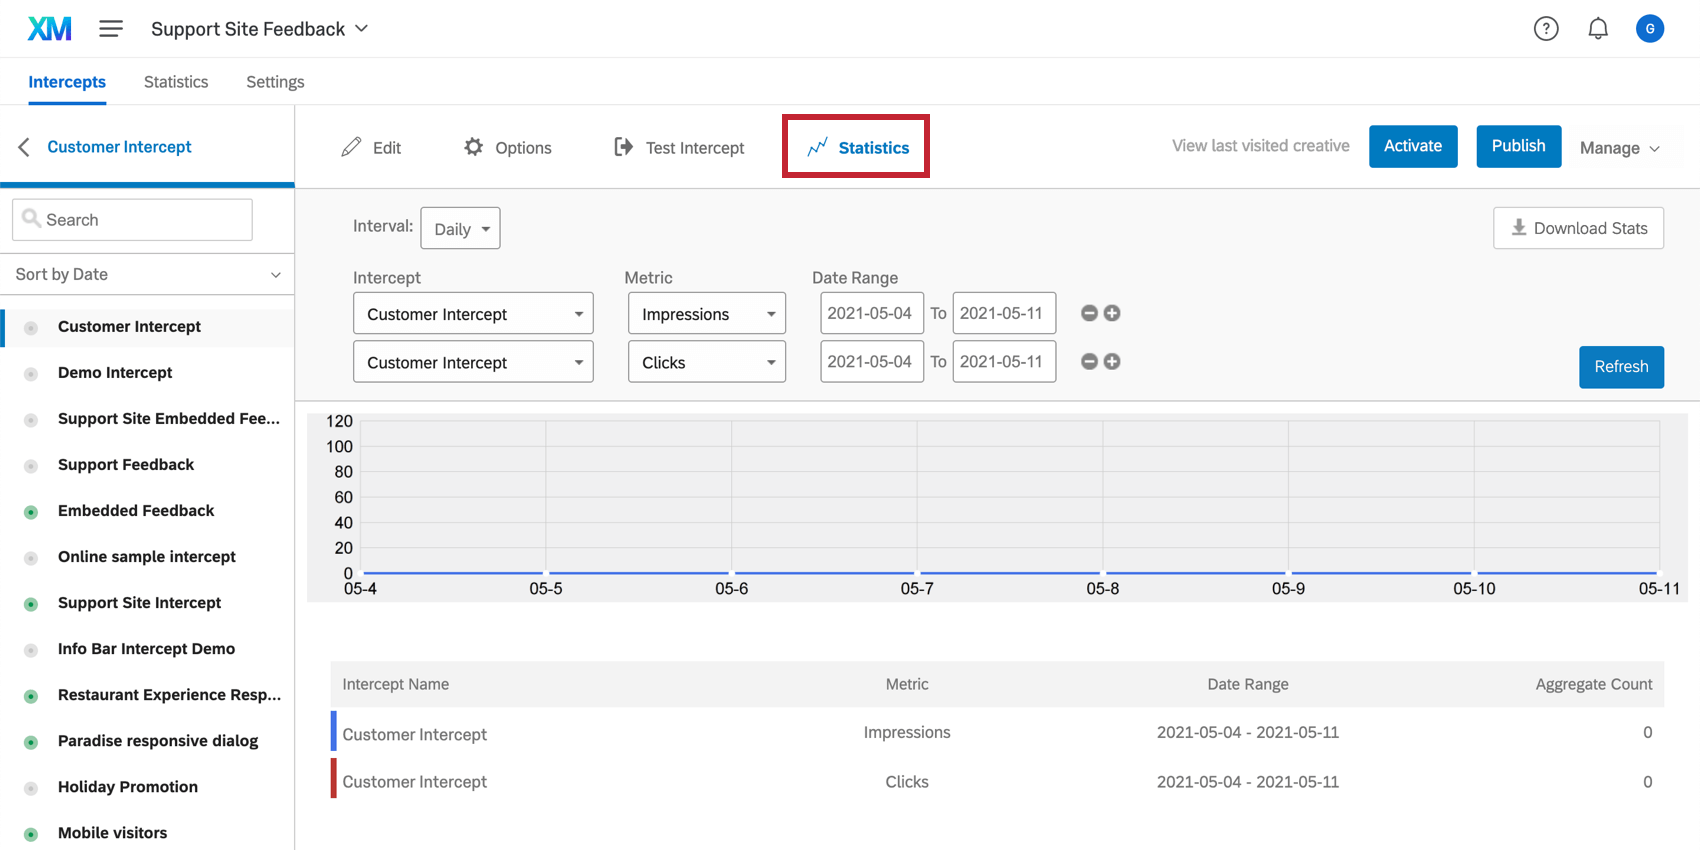
In this tab, you can find information about the number of clicks and impressions for the intercept.
Example: Pop Over A and Pop Over B are in intercept 1. Any interaction with both of these creatives in this intercept will show up in this intercept’s statistics. However, let’s say Pop Over A is also in intercept 2. Interactions with Pop Over A in intercept 2 won’t appear in intercept 1’s statistics.
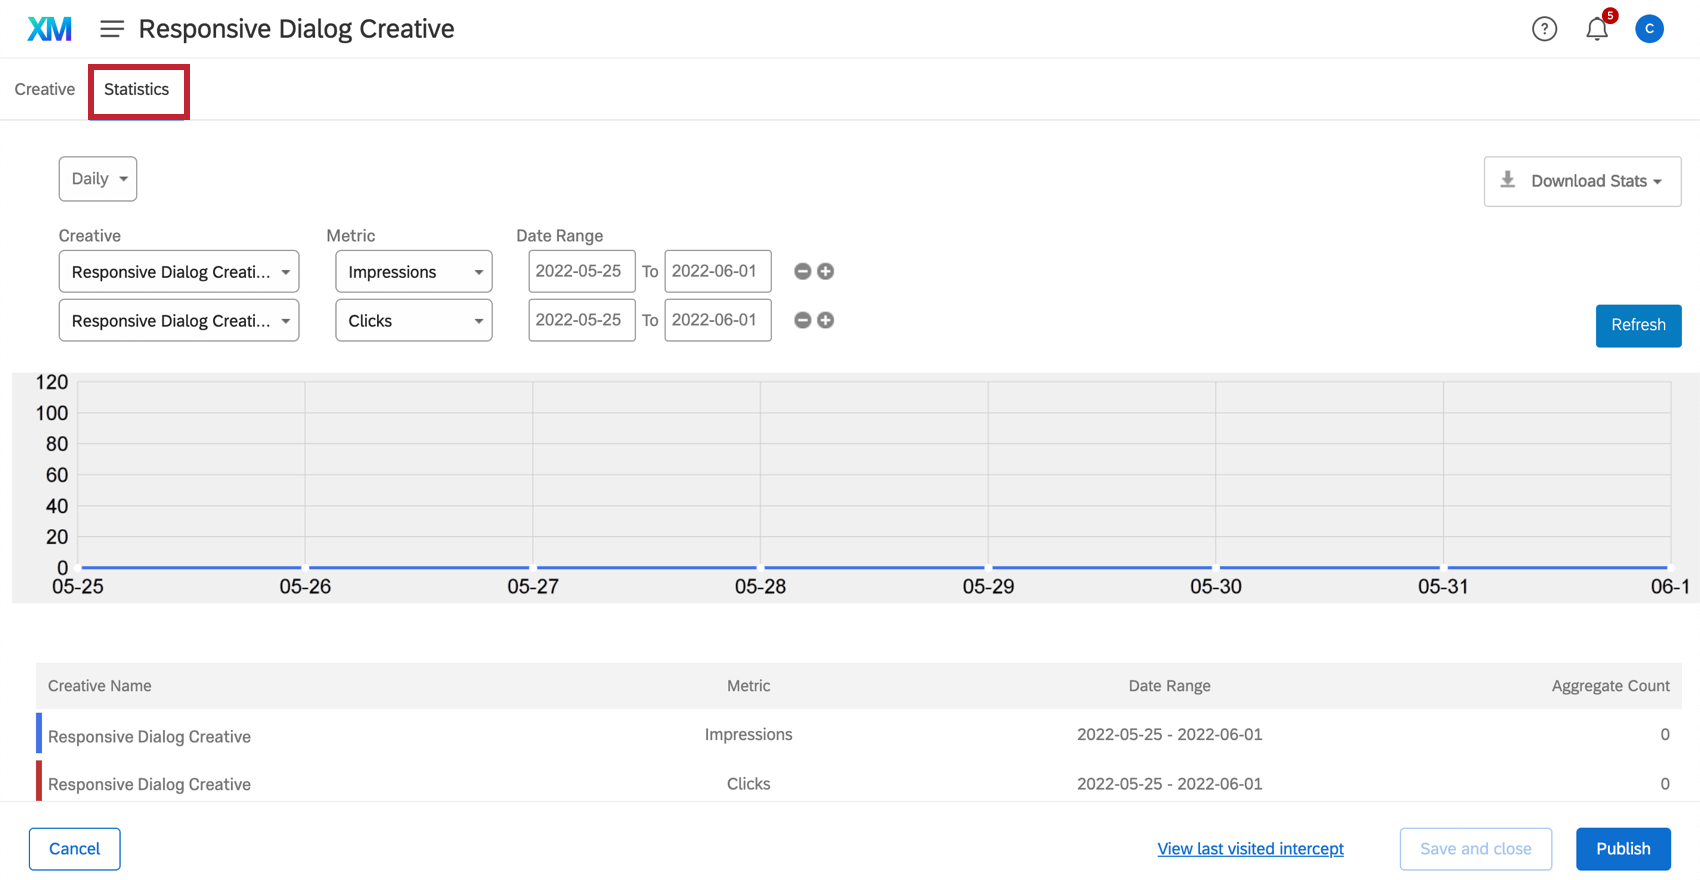
Creative Statistics Tab
You can view statistics for a specific creative. After selecting a creative in your project, click the sub-Statistics tab to view statistics for that creative.
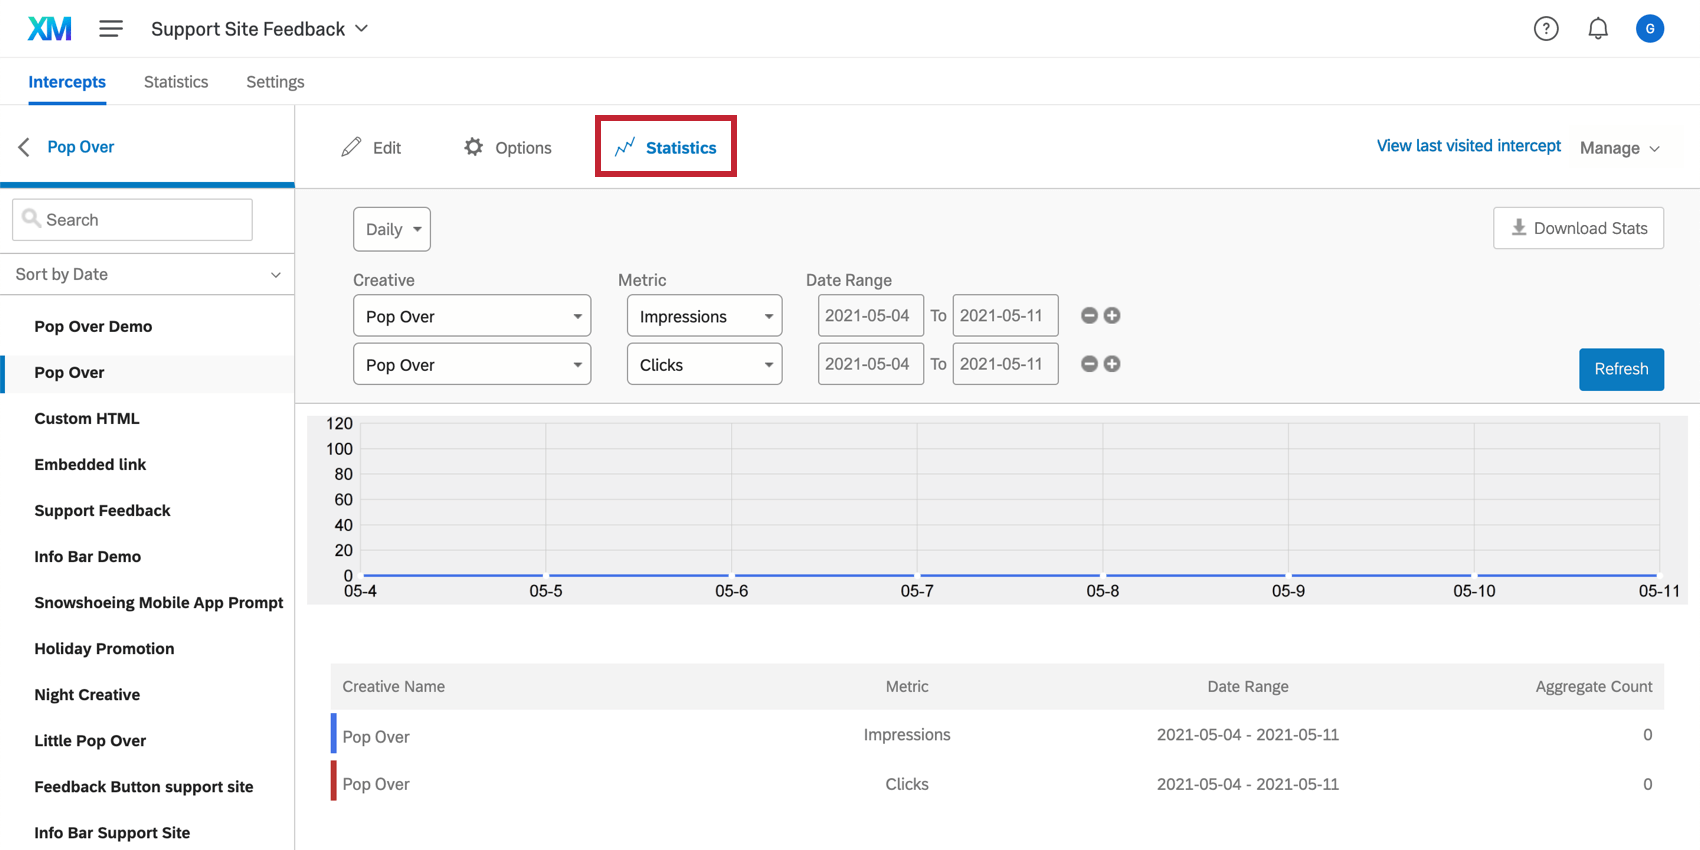
In this tab, you can find information about the number of clicks and impressions for the creative.
Selecting a Responsive Dialog, Feedback Button, Mobile App Prompt, or Mobile Notification creative within the project will open the creative for editing. Statistics can then be viewed in the Statistics tab.
Impressions
The impression metric is incremented every time a creative is shown to a visitor. This allows you to calculate a click-through rate.
Special Impression Definitions
- Website Redirect: An impression is counted every time a website visitor is redirected.
- PopUnder: An impression is counted for each visitor that interacts with the window, by either closing it or taking action. PopUnders that were generated behind the current window but then automatically closed before the visitor saw them are not counted as impressions.
- Slider: An impression is counted when the Slider is opened.
Clicks
The click metric is incremented every time a website visitor interacts with the intercept’s target. Other interactions, such as dismissing the intercept, do not count as clicks.
Dividing the number of clicks by the number of impressions will give you the number of users that click on your target out of the total users that viewed the creative, which is known as the click-through rate.
Click-through rates can offer powerful insights into the effectiveness of your creatives. They are commonly used to measure the success of online advertising campaigns.
Special Click Definitions
- Embedded Target: Rather than the visitor clicking a link to open your target, you may have creatives that display the target (usually a survey) directly within itself. A click is counted every time a visitor clicks within the target.
- Embedded Target in a Slider Creative: When using a slider creative with an embedded target and the Visible Control option, an impression will be incremented when a visitor pulls the slider out. Clicks will be incremented only when a visitor clicks within the target, which means that the number of clicks will often be less than the number of impressions.
- Embedded Target on a Pop Over: By default, an impression will not be incremented until the pop over appears, while a click will be incremented once a visitor clicks within a pop over. This can lead to a higher value for impressions than clicks if visitors leave the site without interacting with the pop over. To change the animation or the duration of the pop over delay, edit the creative’s Options.
Page Views
The Page View metric is tracked and incremented every time a visitor views a page containing the project code. When the page loads, the code sends a request to our servers to see which, if any, creatives should be shown.
If you are not running any intercepts at the moment, you can stop incrementing page views by deactivating the project code. See more on Best Practices for Minimizing Page Views.
Using the Statistics Tab
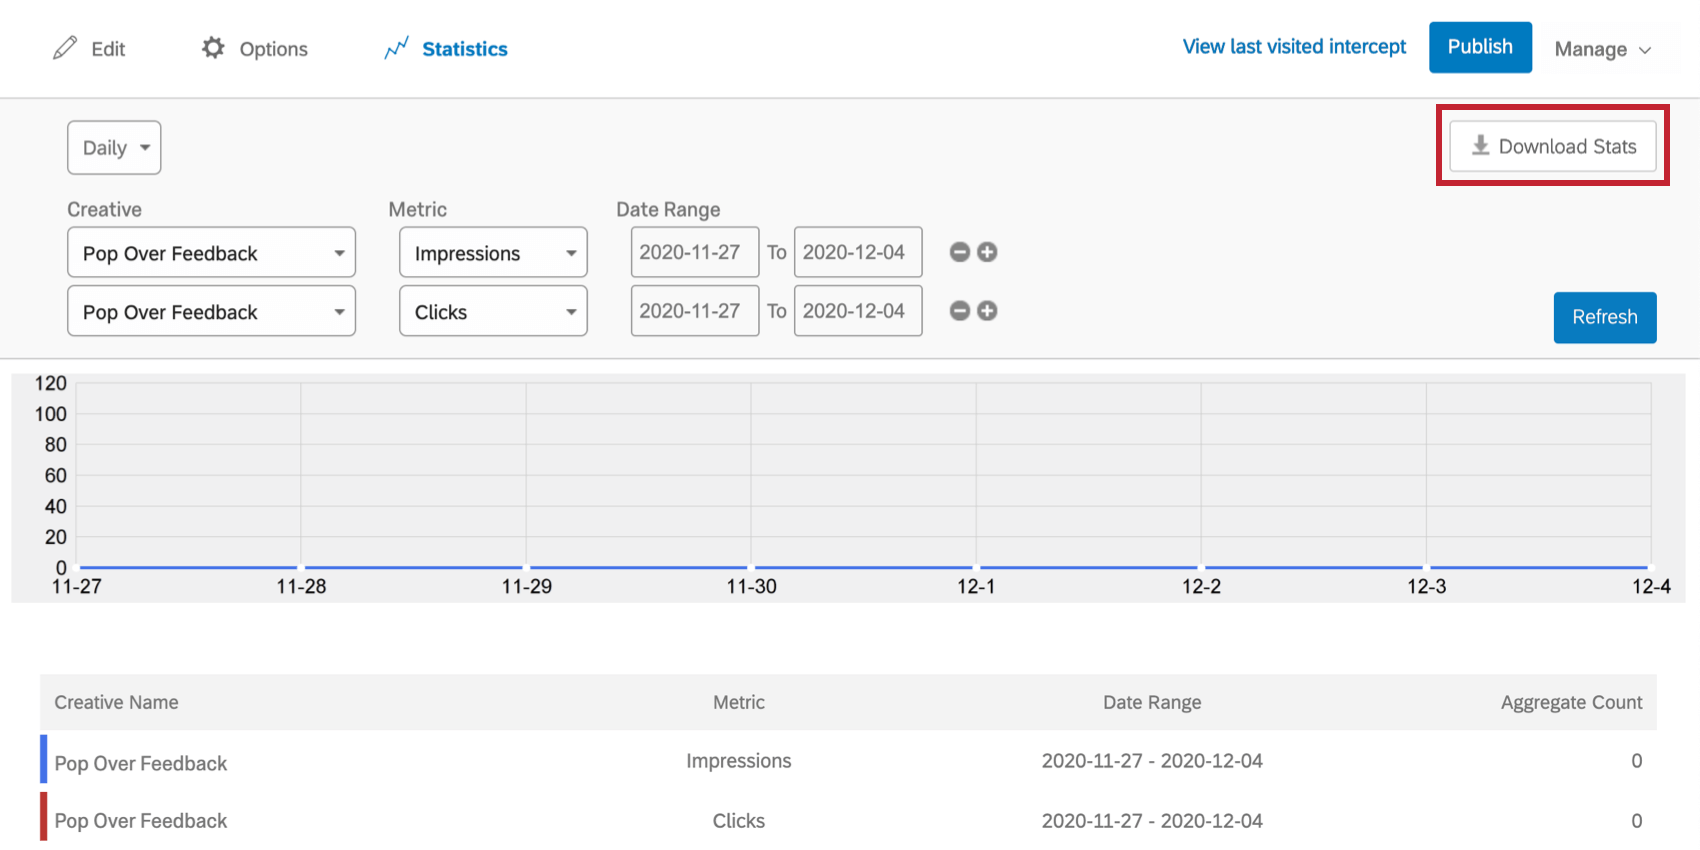
The Statistics section displays your project’s statistics as a line graph.
Below this graph is a legend that will tell you what each colored line means, the metric being measured, the date range, and the count for this metric.
Adjusting the Displayed Statistics
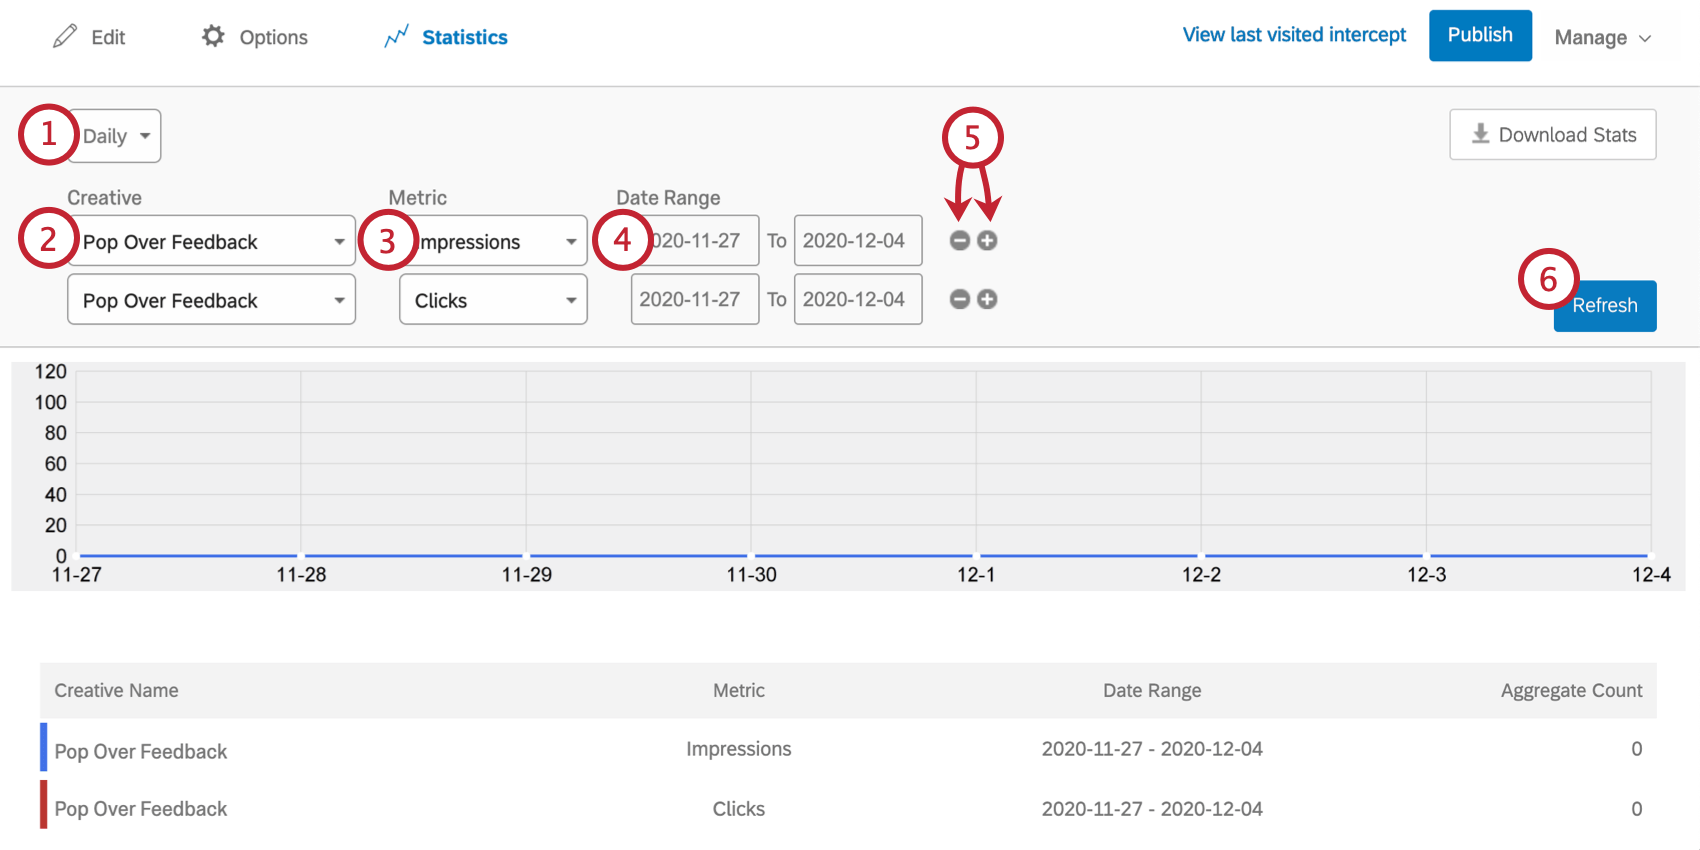
- Adjust the timeframe to Hourly, Daily, or Monthly.
- Adjust which creative you are assessing.
- Adjust whether you are measuring the impressions or clicks metrics.
- Adjust the Date Range for the chart below.
- Add additional creatives’ statistics to the chart by using the plus sign (+). Remove creatives by clicking the minus sign (–) next to a statistic to remove it.
- When you are finished adjusting 1-4, you must click Refresh to view your changes.
Downloading your Statistics
Once you have adjusted which statistics you are viewing, you can download your statistics as a spreadsheet by clicking Download Stats.