
Templated Embedded Feedback
What's on this page
Qtip: If you don’t have access to any of the features described on this page, reach out to your Account Executive. For more information about the differences between Digital Feedback and CustomerXM for Digital, see Digital Feedback vs. CustomerXM for Digital.
About Templated Embedded Feedback
Whether you run a marketing blog, support documentation, developer resources, or another site, your content needs to be kept up to date. As a website grows in size, it can get harder to focus your improvement efforts. It’s also important to determine whether the content you’re producing is effective and measure its impact.
Templated embedded feedback makes it very easy to collect data on the content you run. You can embed a simple helpfulness question on your site content, so visitors can rate the content and even provide feedback right on the page.
Qtip: We use a customized version of the templated embedded feedback to collect customer feedback on our support site. See the “Was this helpful?” survey at the end of every support page.
Attention: If you are using a Content Security Policy (CSP) on the website you would like to deploy templated embedded feedback with, you must allowlist the domain *.qualtrics.com.
Qtip: This feature used to be named Embedded Feedback.
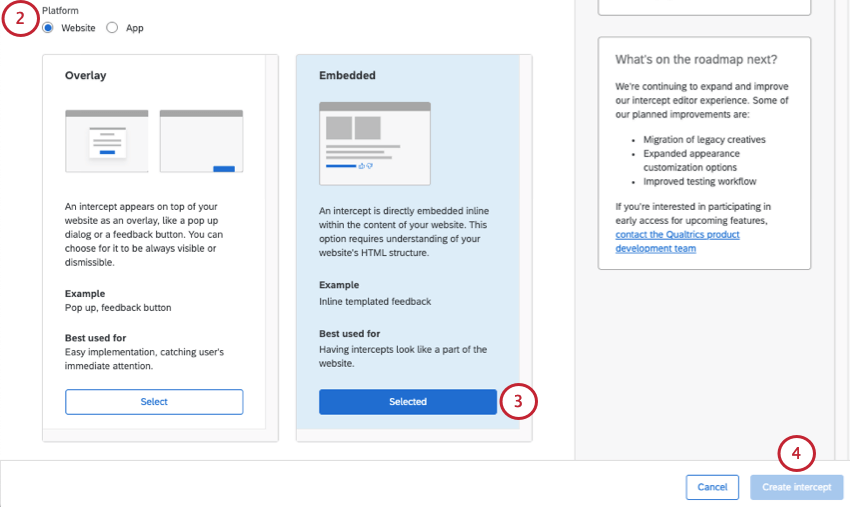
Creating Templated Embedded Feedback
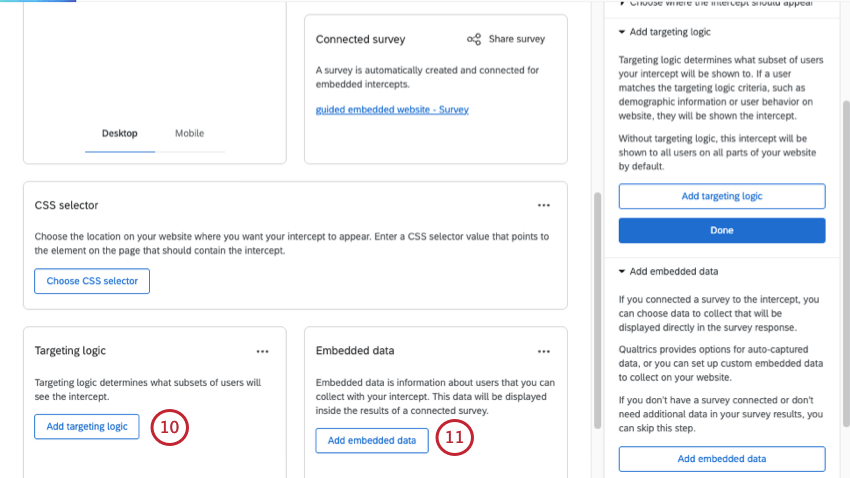
Qtip: For embedded feedback, we recommend adding targeting logic that helps you ensure the intercept appears on correct pages, such as targeting URL segments. We do not recommend using targeting logic to limit what users see the embedded feedback, since the intercept is embedded in the page, and this might cause confusion if it’s blank.
Attention: This step is critical if you want to be able to filter or break out your data by the specific pages (or sections) of content being rated.
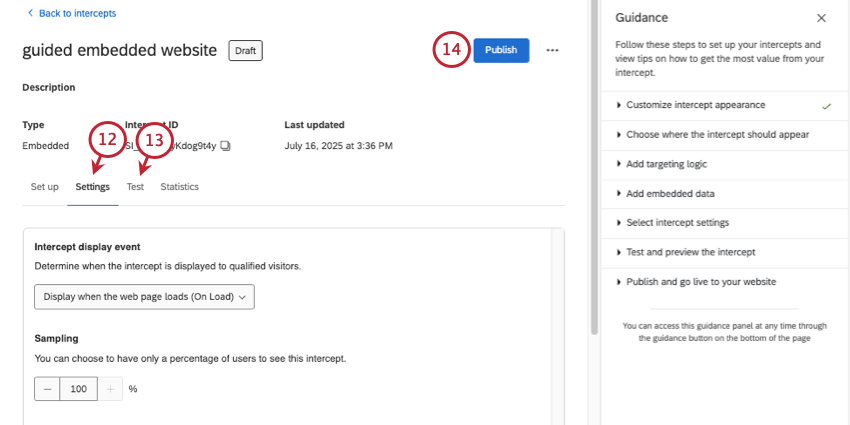
Qtip: Because the feedback is embedded right on the page and doesn’t impede the visitors’ ability to navigate or use a website, there is no reason to limit how often this intercept is seen, and in fact limiting it may be more confusing than not. We advise never hiding the templated embedded feedback, sampling 100% of visitors, not preventing repeated display, and displaying on page load.
Qtip: For the last setup steps and details on launching, you can also see Creating Guided Intercepts.
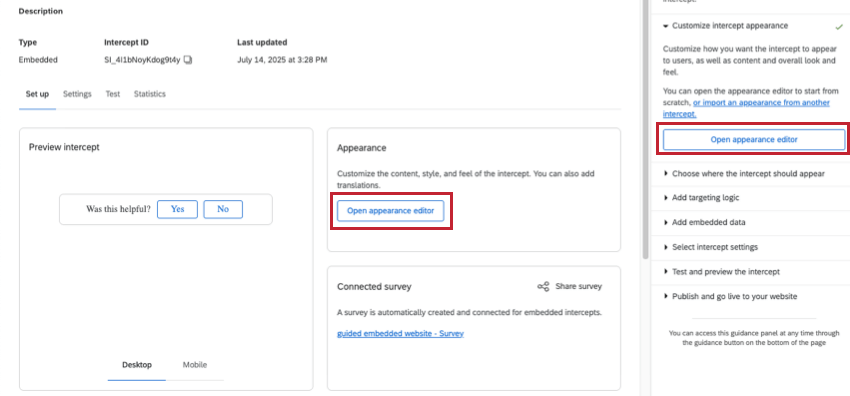
Customize the Content
Attention: For the templated embedded feedback feature, there is no need to create a separate survey. This feature will automatically take care of creating a survey for you in the back-end, without any additional work on your part.
When making a templated embedded feedback creative, the first section allows you to customize the content of the creative, including questions, button appearance, and so on. On the right side of the screen, the preview will update to match the settings you’ve added, and you can even click the buttons to test what the thank you message or follow-up question looks like.
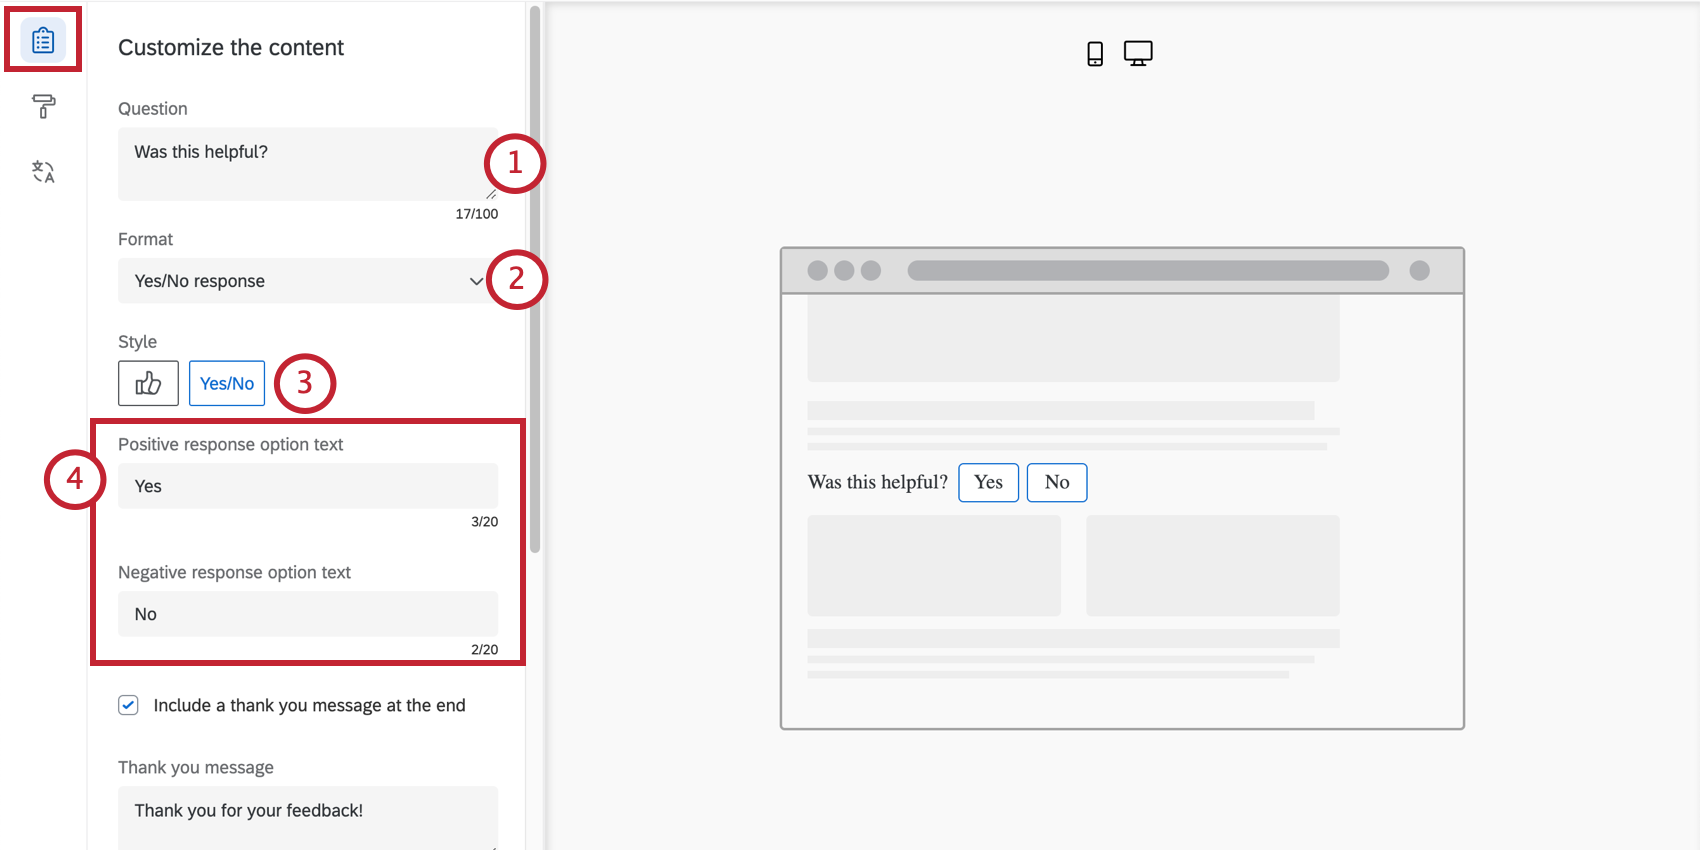
- Yes/No: Either the words “Yes” and “No,” or thumbs up / thumbs down icons.
- 5 point rating: Either emojis or stars.
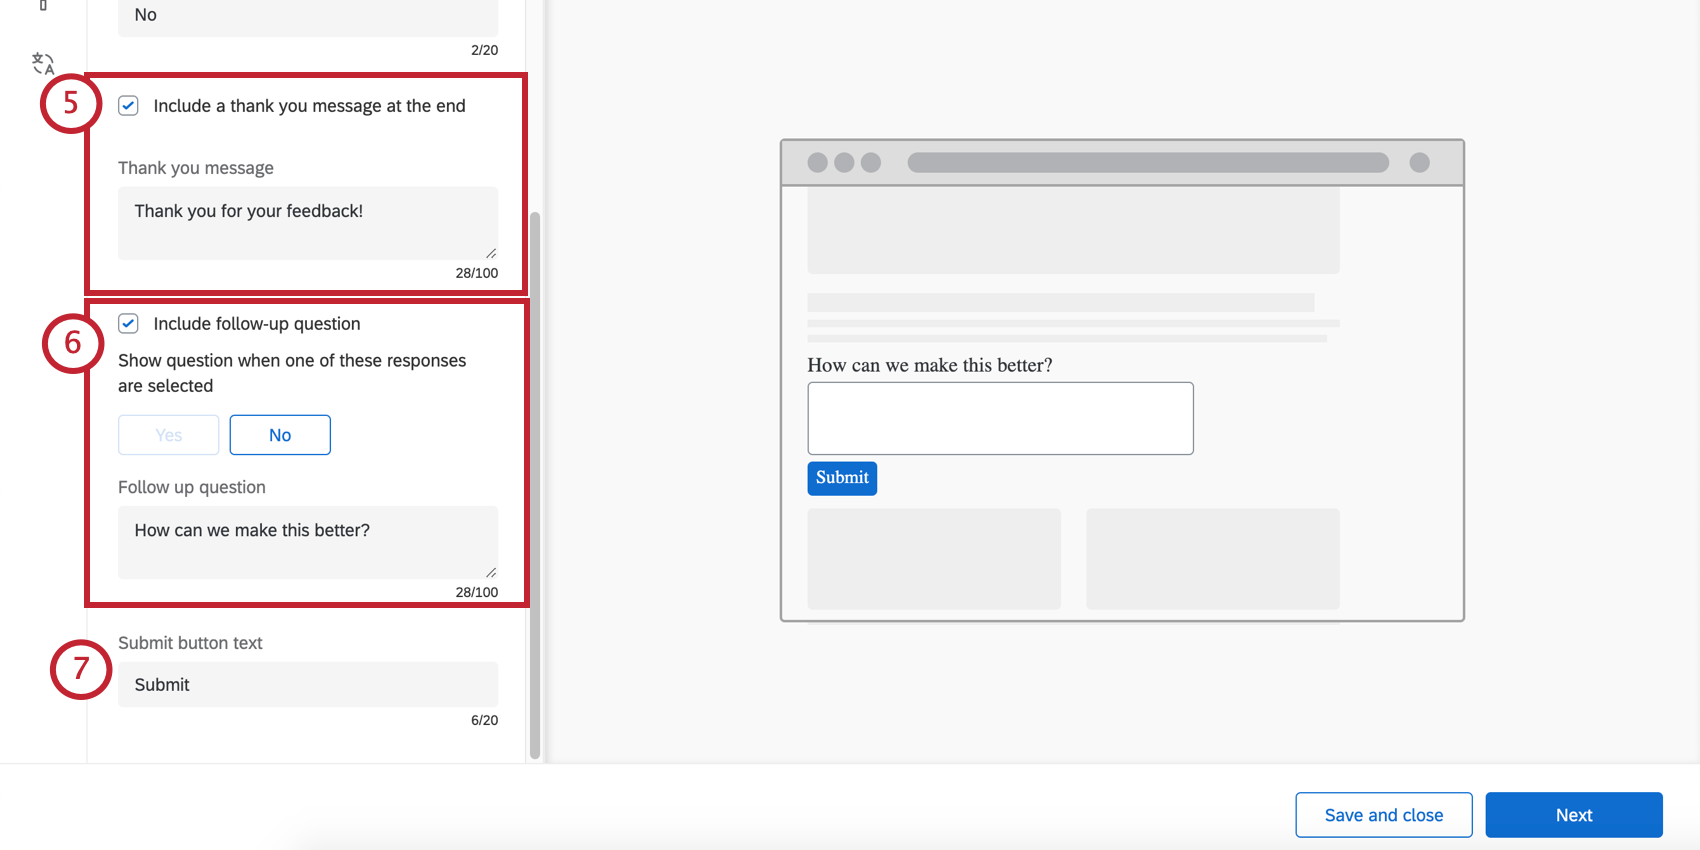
Qtip: If you include a follow-up question, this appears after the follow-up is answered.
Qtip: You cannot reverse the order that the emojis appear, e.g., switch from increasingly positive to increasingly negative.
- First, choose the answers that trigger this second question. You may select all or some of the answers, although we recommend targeting negative feedback.
- Next, write your follow-up question.
Qtip: Do not click “Next” until you are happy with the Look and feel or translations.
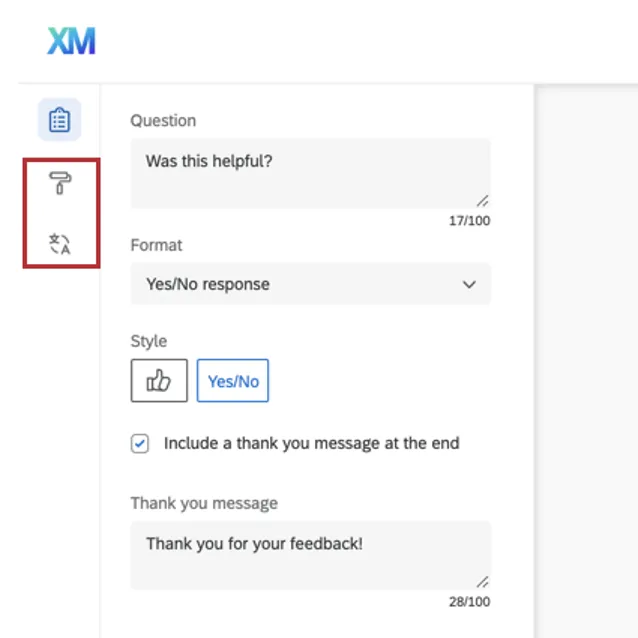
Look and Feel
The Look & Feel section allows you to adjust the layout, text weight, and colors of the creative.
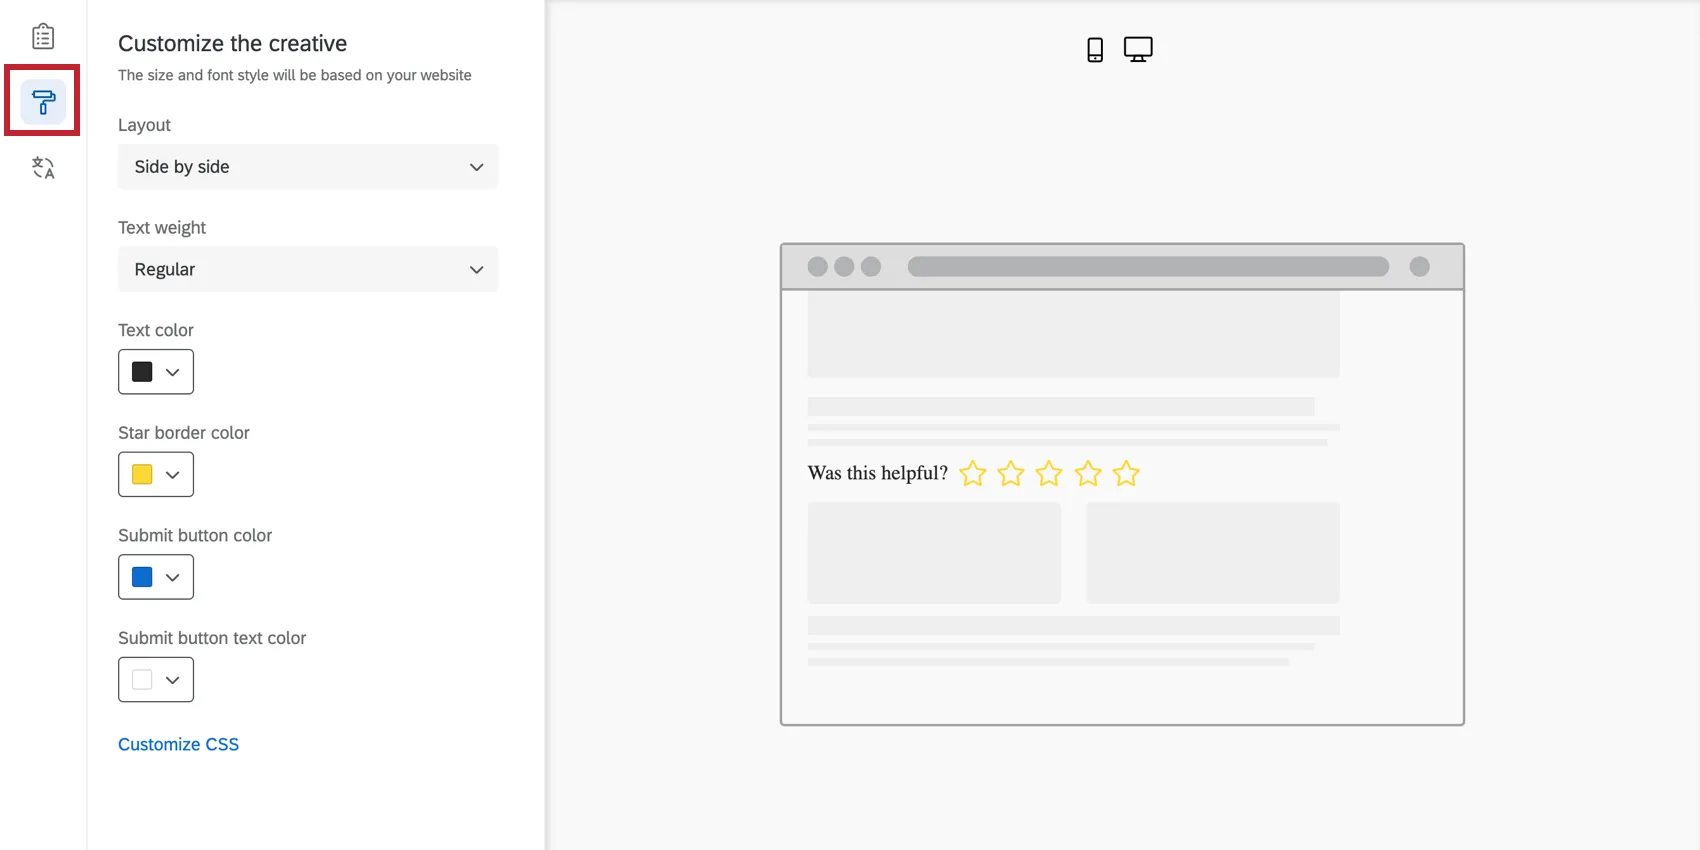
- Layout: The orientation of the question vs. the answer choices.
- Side by side
- Stacked
- Text weight: The weight of the question text. Can be regular, bold, or italic.
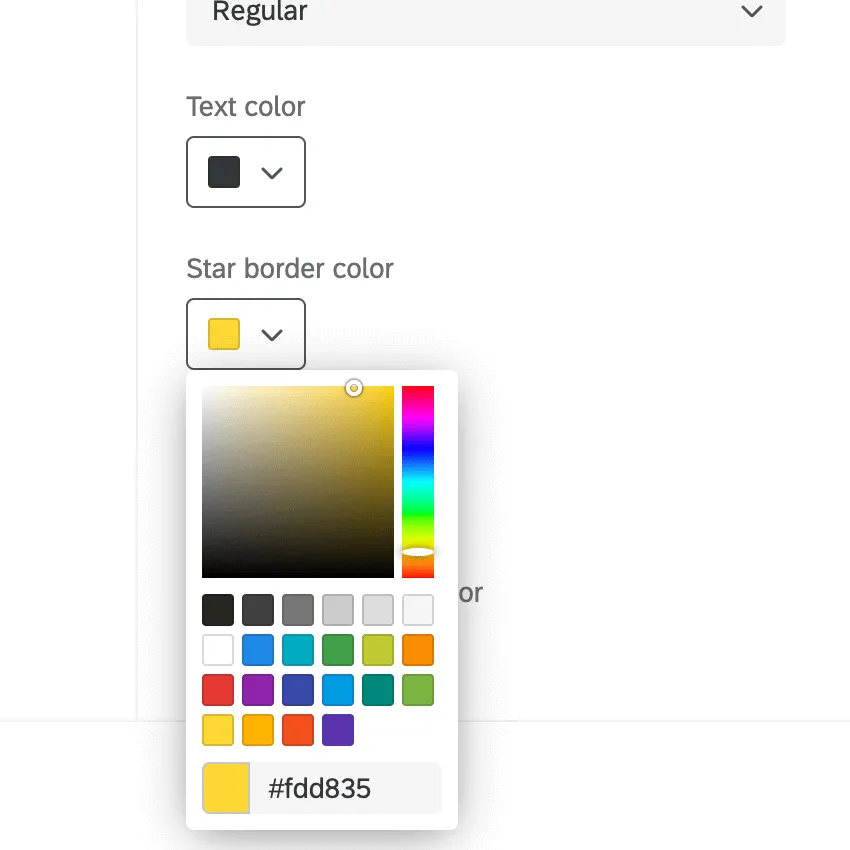
- Text color: The color of the question text.
- Button customization: The colors you can change will depend on the format and style you chose earlier.
- Yes/No: Change the color of the button text, button border, and the button fill.
- Thumbs up/thumbs down: Change the color of the button’s outline (border) and fill.
- Emojis: No customization – colors are preset.
- Stars: Change the color of the star’s outline (border). This is also the color the star will fill up with when the respondent hovers over / selects that star.
Submit button color: The submit button only appears if you’ve included a follow-up question; the submit button is how the visitor indicates they’re ready to submit feedback. This setting allows you to change its fill color.
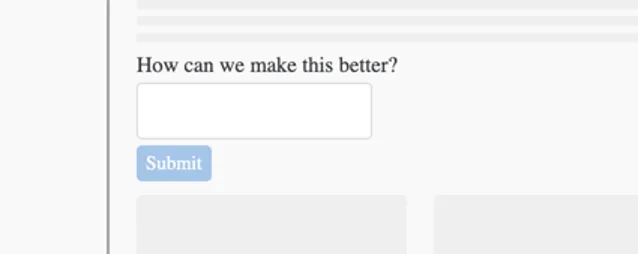
- Submit button text color: Change the text color on the submit button.
Customize CSS: Customize the CSS of the templated embedded feedback as desired. Edits made here will not be reflected in the preview; remember to test your intercept before deployment.
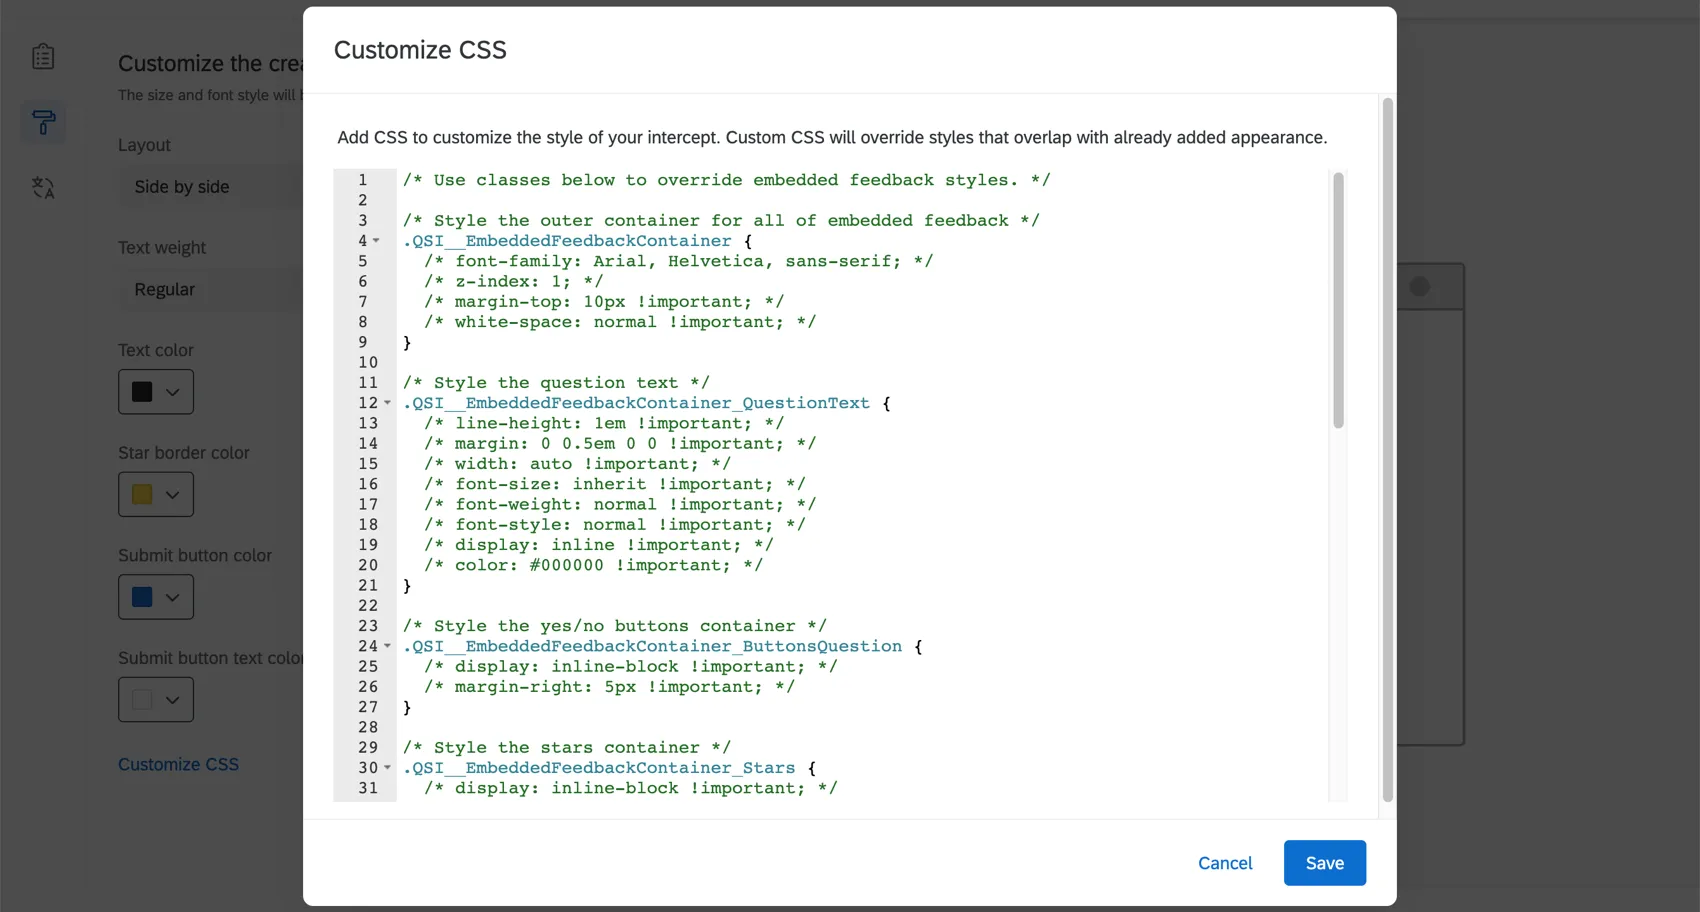

Attention: The following code is provided as-is and requires programming knowledge to implement. Qualtrics Support does not offer assistance or consultation on custom coding. You can always try asking our community of dedicated users instead.
Use a template: Use a survey theme as a template for the creative’s style settings. This will import the primary color and secondary color settings of that survey theme.


Qtip: The settings in the creative are disconnected from the theme used as a template. The creative’s settings do not update if the template theme changes, and changing the creative’s settings will not change the template theme.
Qtip: If you would like to further customize the colors in your templated embedded feedback creative, you can use the color dropdown menus in the Look & Feel section.
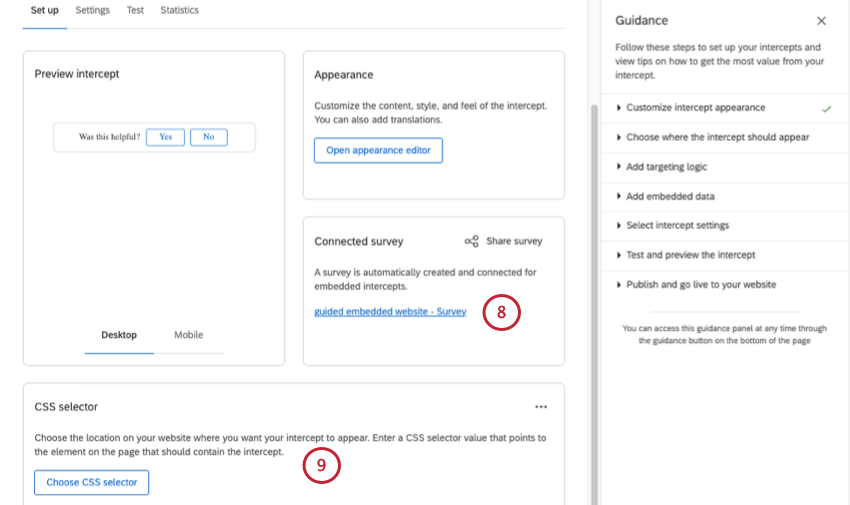
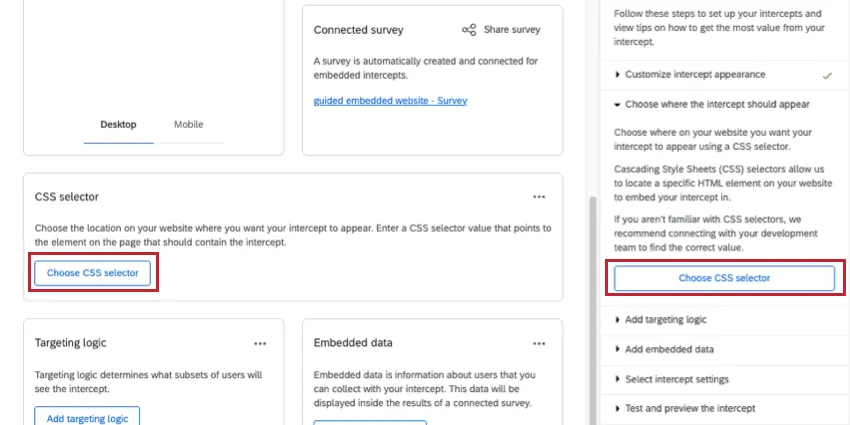
CSS Selector
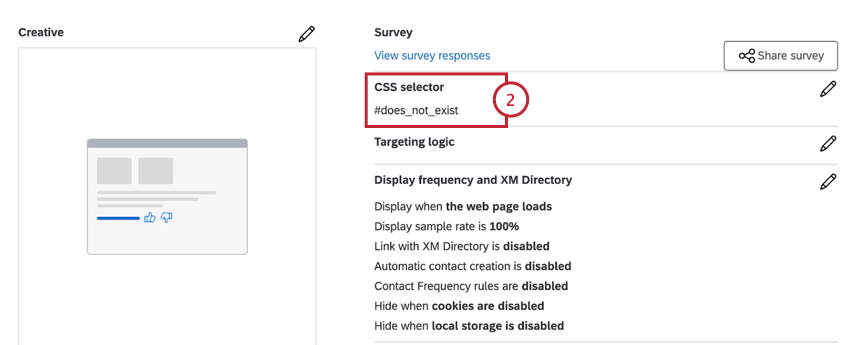
Specify the location on your web page where you want your templated embedded feedback intercept to appear. You can do this by entering a CSS selector value that points to the element on the page that should contain the templated embedded feedback.
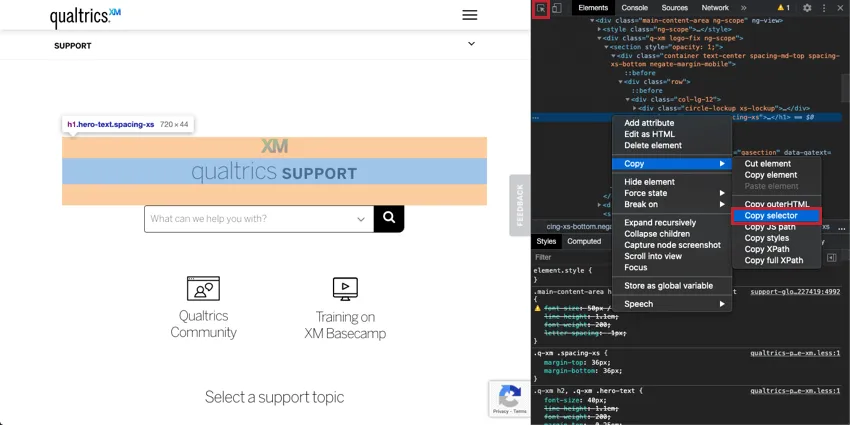
Example: You want to add your intercept to the “Qualtrics Support” section on the Qualtrics Support page. You can open your browser’s developer tools to find the CSS selector of the element where you want to insert the intercept.
When you have the correct element highlighted, right click to copy the selector. The selector should be a long string of CSS. In this case, the copied selector is “#content > div.quni-homepage.main-content > div > div > div > div.main-content-wrapper.spacing-sm-bottom > div > div.q-xm.logo-fix.ng-scope > section > div > div:nth-child(1) > div > h1”.
Once you have the CSS selector copied, paste it into the window shown below and click Save CSS Selector.
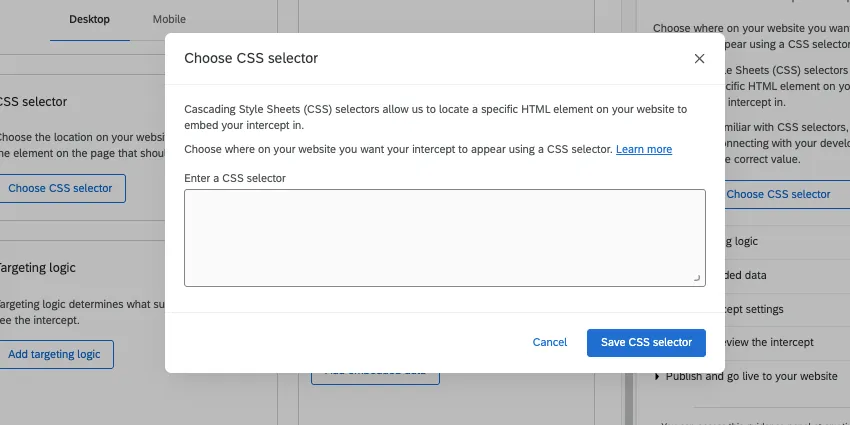
Qtip: If the CSS selector is left blank or is invalid, you will see an error in the developer tools that contains the text “DOMException: Document.querySelectorAll.” Note that this error will not be raised if the selector is valid but the element is not present on the page. For example, if you enter a CSS selector of “#.<tes,t,” the error will be raised, but if you enter a selector of “h1” and there are no h1 elements on the page, the error will not be raised.
Qtip: Please note that templated embedded feedback can only be appended to the end of a DivID or CSSSelector.
Capturing the Page URL, Total Duration, and Page Title
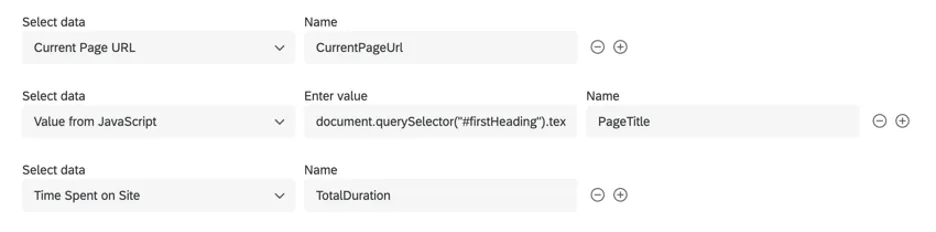
- CurrentPageUrl set to a value of Current Page URL
- PageTitle set to a value from JavaScript
- TotalDuration set to Time Spent on Site
For PageTitle, we need to set the value from JavaScript so we can capture your web page’s title. But how?
If you are using Google Chrome, simply select the title on the page, right click, and select the Inspect option. The Chrome developer tools window will open up, and it should look like the following. Right click on the corresponding HTML element and copy the selector, as shown below.
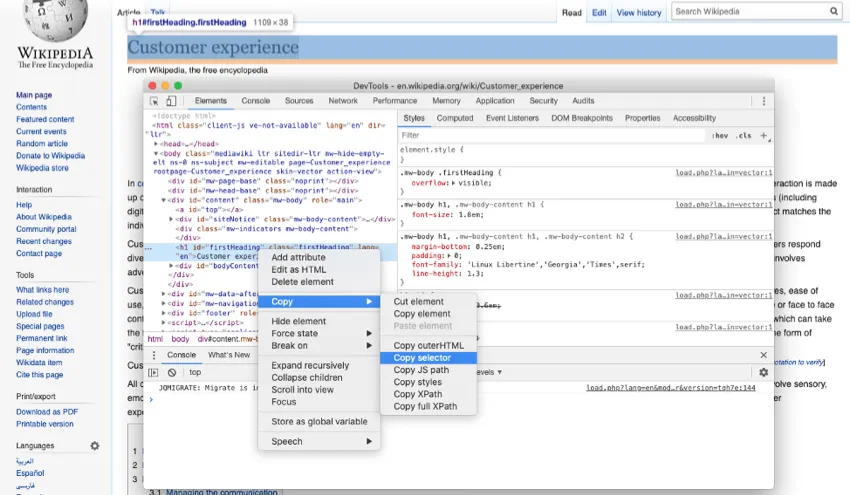
This should return something like this:
#firstHeading
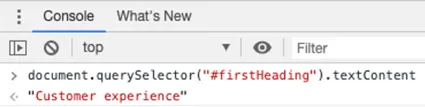
With the following JavaScript, you can get the value of the page title from the HTML element:
document.querySelector("#firstHeading").textContent
You can edit the bolded text, depending on what your selector returned.
Qtip: You can test this out in the Chrome Developer Tools console to see what the value looks like.
Now that we have the JavaScript, put it in the value for the Embedded Data field “PageTitle,” as shown earlier. Click Next on your Embedded Data when you’re done.
Embedded Surveys
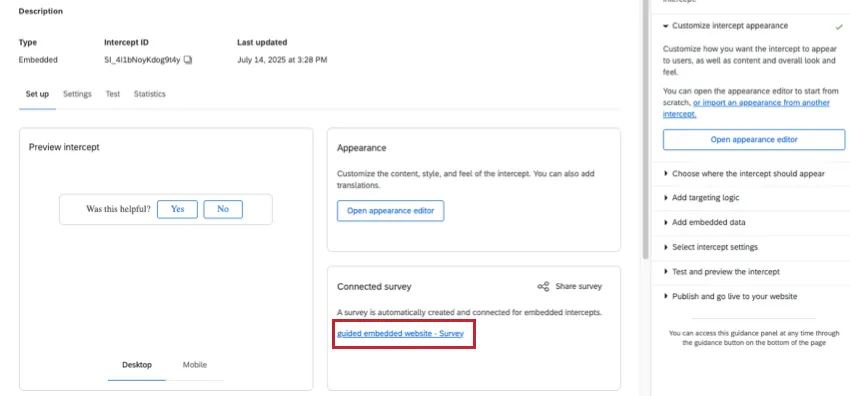
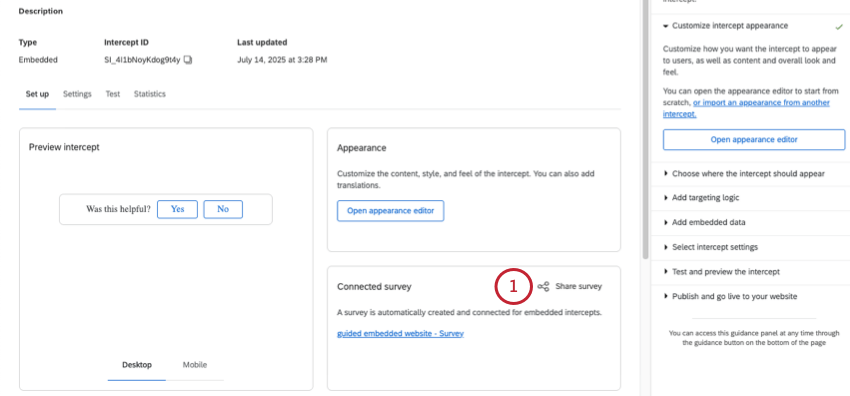
When you create Templated Embedded Feedback, a survey is automatically generated for you. To view this survey and its data, go to the Set up, see Connected survey, and click the survey’s name.
Attention: You can only access this creative’s survey by opening the Templated Embedded Feedback, as described above. This survey cannot be found directly on the Projects page, even if you have the survey ID (e.g., SV_XXXXX).
Capabilities of the survey
Workflows Tab: Trigger different tasks inside Qualtrics based on survey results that come in. For example, create tickets for your writing team when visitors express discontent with content, or send an email to a manager whenever you receive highly positive feedback.
Qtip: The workflows tab is currently only accessible to the user who created the embedded feedback survey.
- Data & Analysis Tab: Filter responses you’ve collected, export responses, conduct text analytics, edit or remove responses, and more.
- Results Tab: Create dynamic dashboards reporting your data.
- Reports Tab: Visualize your results with printable reports.
Reporting on Data
You can view and analyze this data the same way you would any other survey. Here are some ideas to get you started.
- Exporting Response Data
- Filtering Response Data
- Advanced-Reports Basic Overview
- Results Dashboards Basic Overview
Getting Started with CX Dashboards
Qtip: When adding embedded survey data as a source to a dashboard, it’ll appear under surveys, and will have the same name as the templated embedded feedback intercept, but with “- Survey” added at the end.
Editing the survey
The survey linked to a templated embedded feedback can only get visual edits through the intercept. See Customize the Content and Look & Feel to change the survey wording or appearance.
Collaborating on Templated Embedded Feedback
Attention: To share survey responses, you must be the intercept owner (i.e., the user who created the intercept). The users you collaborate with will need the Website Feedback permission called Manage Projects.
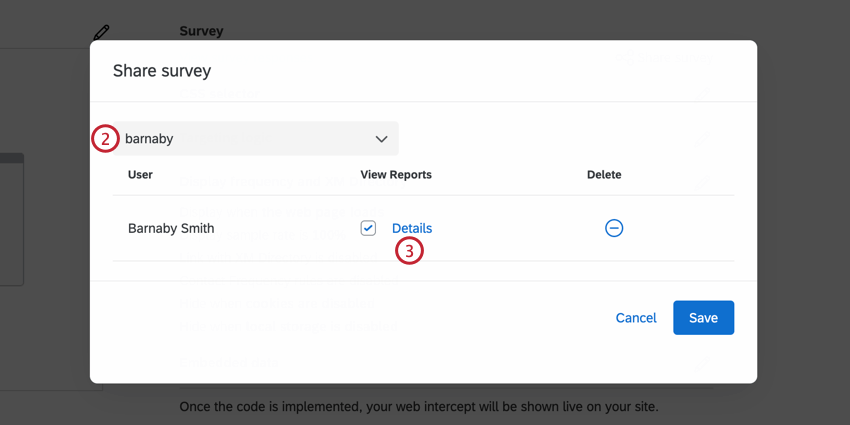
As the intercept owner, you can share your templated embedded feedback with other users in your license who need to view the survey data. To share your intercept:
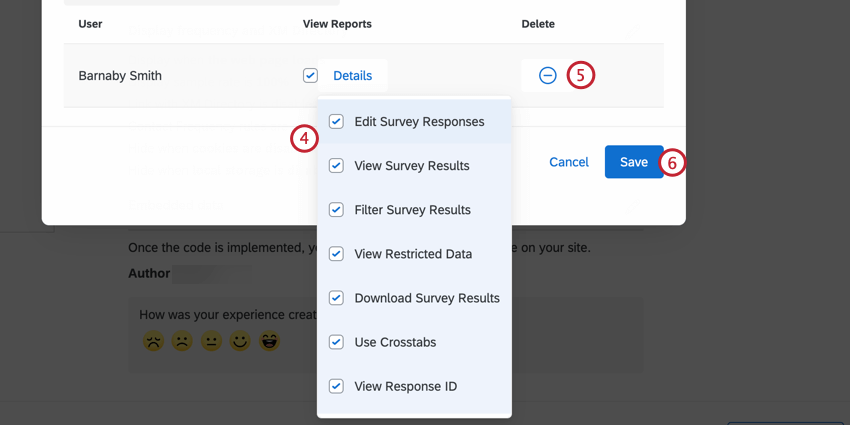
- Edit Survey Responses: Disabling this permission stops your collaborator from deleting data or using the response editing feature. Also, while you can still generate a retake survey as a new response link, you cannot generate a regular retake link. This permission, when disabled, allows collaborators to add data, but not modify existing data in any way.
- View Survey Results: Disabling this permission removes the Data & Analysis tab and the Reports tab. Attention: In order to enable any of the results permissions described in this section, you MUST also enable View Survey Results!
- Filter Survey Results: When enabled, this permission allows the user to filter the collected responses on the Data & Analysis and Reports tabs.
- View Restricted Data: Disabling this permission censors the standard contact fields, IP address, location latitude, and location longitude information in the Data & Analysis tab and in all exports.
- Download Survey Results: Allows the user to export data from the Data & Analysis tab. When disabled, collaborators can no longer export from the Data & Analysis tab, but they can still export reports.
- Use Crosstabs: Gives the user the ability to analyze the results with the crosstabs feature.
- View Response ID: When enabled, this permission allows the user to view the Response ID, a unique ID assigned to every individual response.
- View Text Analysis: When enabled, the collaborator has view access to text analysis performed in Text iQ. The collaborator will not be able to edit the details of your text analysis without the Use Text Analysis permission found in the Edit permission details.
Troubleshooting Templated Embedded Feedback
This section covers how to troubleshoot display issues with the templated embedded feedback creative. You can use these steps to test when and where the intercept appears on your site.
document.querySelectorAll('#does_not_exist').length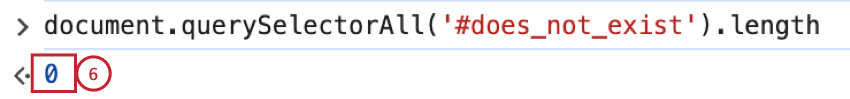
Qtip: If you see a number greater than 1 when you run the above snippet, keep in mind that the intercept will display under the first element that matches that selector on the page. You may have to scroll up to find it.
Warning: Many sites structure their website content differently for desktop vs mobile devices. You can use your browser’s dev tools to simulate a smaller screen size and run the code above to validate that the element exists on mobile and desktop.
QSI.API.unload();

QSI.API.load().then(QSI.API.run);- Having your engineering team call
QSI.API.run()after the element is added to the page. - Updating the intercept display event to “Display with custom JavaScript code (Manually)” to ensure proper timing alignment.
FAQs
I activated my intercept, but it‘s not showing up on my site. Why not?
I activated my intercept, but it‘s not showing up on my site. Why not?
- Logic: intercept targeting logic and action set logic are the conditions that must be met in order for an intercept to be displayed to a visitor. Checking this logic will be helpful in discovering why the Intercept is not displaying on a page.
- Logic sets that use “Contains”: A common cause of logic error is the use of the “Contains” vs. “Is.” To say a condition “Contains” means that the parameter you are basing the logic off (i.e., Current URL) will have the specified value present in addition to more information. For example, if I had logic that read as Current URL contains ‘qualtrics’, this would cause the intercept to display on any URL that has the word qualtrics present. The other option you have is using Current URL is [URL]. This condition depends on the visited URL being an exact match. Any differences or additional characters will prevent the intercept logic from passing.
- Intercept Revisions: When making edits to intercepts, changes are not made live until the intercept is published. When publishing an Intercept, a version of the intercept, or a “revision,” is saved. Reviewing the revisions that have been made is very useful for identifying any changes that may have suddenly prevented the intercept from appearing.
- Debug Window: The debug window is an invaluable tool for testing why an intercept is not displaying on a particular page.
For intercepts whose deployment code was implemented before March 2019, to enable the debug window, append a query string to any given URL called Q_DEBUG. This must be prefixed with a ? or a & like the following examples: https://www.qualtrics.com?Q_DEBUG, https://www.qualtrics.com/blog?item=value&Q_DEBUG.
For intercepts whose deployment code was implemented after March 2019, run the following JavaScript snippet in the Console of your web page:
 QSI.API.unload();
 QSI.isDebug = true;
 QSI.API.load();
QSI.API.run();Qtip: The Website Insights debugger does not function if the code has been implemented using a tag manager. Also, if the URL already has a query string with a ?, then the debugger will require a & instead. - Network Request: Most browsers possess a developer tools menu that allows a user to see a site’s source code, resources, cookies, and network calls. Website Insights possesses a distinct presence in the Network section of these tools. To check for these scripts running, open the developer tools and navigate to the Network section. Once here, reload the webpage and the menu should begin to populate with all network requests being made by the website. To identify Website Insights code, look for calls that begin with ?Q_ZID or ?Q_SID. This is the code itself running checks on the display logic. If you cannot find anything matching this format, then there is an issue with the implementation of your project code. You can refer to our support page on implementation for advice on where is best to place the code.
- Content Security Policy Issues: If you receive a console log that violates a Content Security Policy, there is most likely a restriction on your website that is blocking our intercepts from deploying. We recommend reaching out to your web-development team to resolve. To ensure your intercepts work, we generally recommend allowlisting the following items in your Content Security Policy headers:
- connect-src https://*.qualtrics.com
- frame-src https://*.qualtrics.com
- img-src https://siteintercept.qualtrics.com
- script-src https://*.qualtrics.com
- SPA URL Handling: If your site uses a single-page application (SPA) framework, make sure your code triggers history.pushState() when navigating between views. Some frameworks may re-render or update the URL without pushing a new history entry, which can prevent intercepts from firing. If you're using useEffect or similar lifecycle hooks, make sure your intercept logic runs after navigation is complete.
What is the difference between zone code and intercept code? Now that it’s called “project code” in the new interface, what does this mean?
What is the difference between zone code and intercept code? Now that it’s called “project code” in the new interface, what does this mean?
Zones (now “Projects”) act as collections for multiple creatives and intercepts. Zone codes contain all the intercepts in the zone. This allows you to implement a single code on your site instead of continually adding codes for individual intercepts. This can save a lot of time, since every time you activate content on the zone, it’s automatically added to the code, requiring no change.
Projects are the equivalent of zones, so project deployment code is the equivalent of old zone codes.
I have built my intercept but would like to test it before activation. How can I do that?
I have built my intercept but would like to test it before activation. How can I do that?
What’s the difference between standalone intercepts, guided intercepts, and guided creatives?
What’s the difference between standalone intercepts, guided intercepts, and guided creatives?
Guided intercepts are when you create features like responsive dialogs, templated embedded feedback, feedback buttons, and embedded app feedback using these steps. Also known as guided setups, guided intercepts combine the visual element of a creative and the settings of a creative into one easy-to-follow flow that will guide you from start to finish.
Guided creatives are when you create features like responsive dialogs, templated embedded feedback, feedback buttons, and embedded app feedback using these steps instead. With a guided creative, you need to create a separate intercept to pair it with. You still get the improved creative editor, but not the rest of the guided setup.
I created a responsive dialog as a creative, but I want to use it as a guided intercept instead. Can I switch it over?
I created a responsive dialog as a creative, but I want to use it as a guided intercept instead. Can I switch it over?
Can I save guided setups to the library?
Can I save guided setups to the library?
That's great! Thank you for your feedback!
Thank you for your feedback!