-

Qualtrics Platform -

Customer Journey Optimizer -

XM Discover -

Qualtrics Social Connect
Displaying Benchmarks in Widgets (EX)
About Displaying Benchmarks in Widgets (EX)
Benchmarks are a metric standard that enable you to understand how your organization’s overall experience compares against industry peers, and to establish overall customer experience, NPS, or digital experience goals based on company and industry comparisons. These benchmarks can be added to your EX dashboard for display in your widgets. Benchmarks can either be uploaded to the benchmark editor, or can be configured directly within a widget as a one-time benchmark.
Displaying Benchmarks from the Benchmark Editor
Displaying Benchmarks in a Dashboard
After your benchmarks have been uploaded to the editor, you can add them to your dashboard widgets.
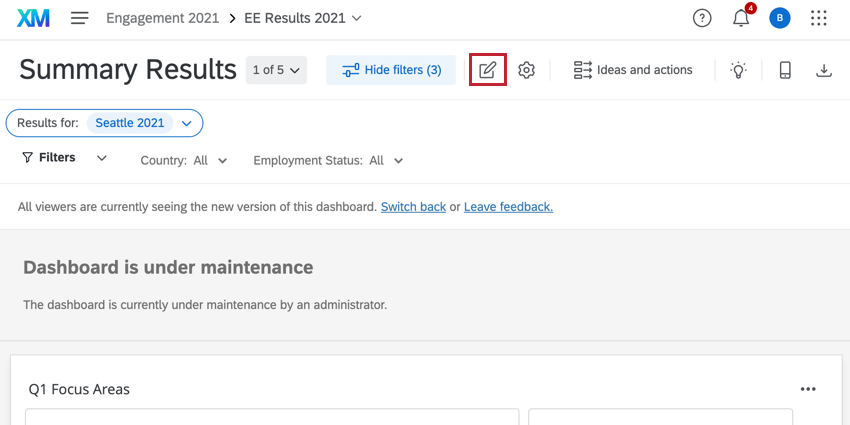
- Make sure your dashboard is in editing mode by clicking the Edit button.
- Add a widget, or double-click an existing widget.
- Click Add in the Metric section to add a metric, or click an existing metric to edit it.
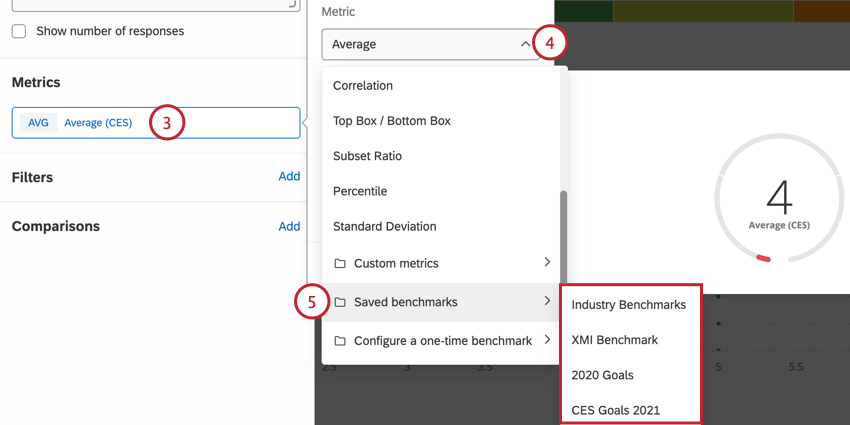
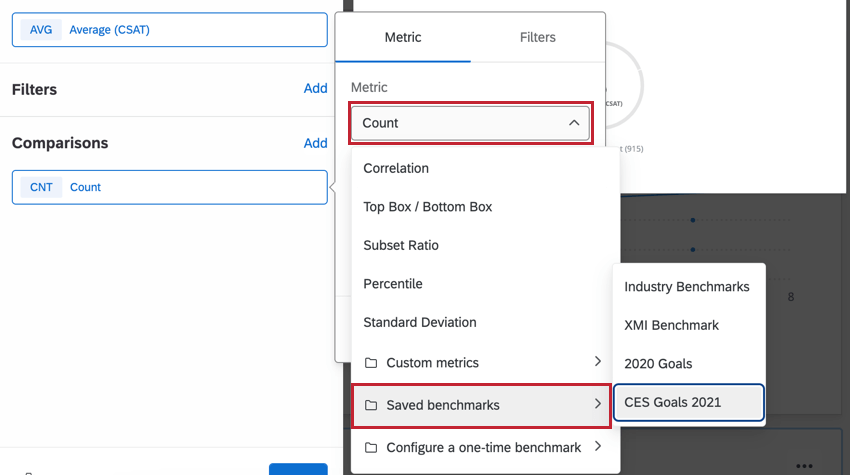
- This metric needs to be changed to a benchmark. You can select which one by selecting the Metric dropdown.
- Hover over Saved benchmarks and choose your benchmark.
- Select the Field that the benchmark should be compared against.
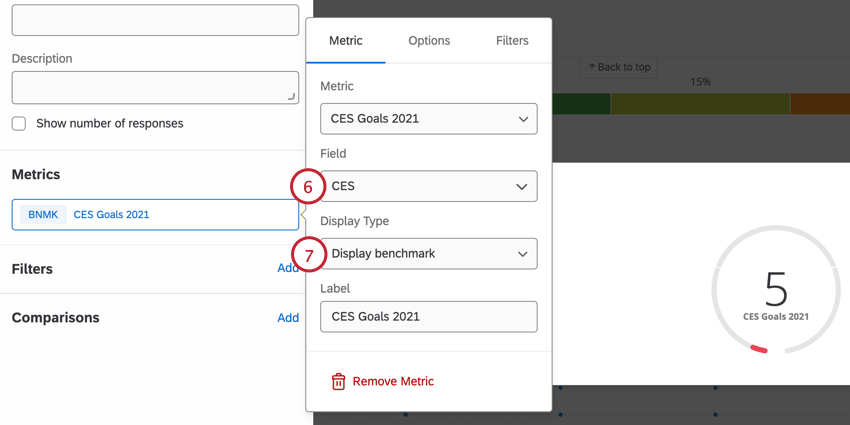 Example: For NPS benchmarks, the field you compare against should be a measure of NPS. For a CES benchmark, the field you compare against should be a measure of CES. Only Number Set and Numeric Value fields appear here.
 - Select your Display Type:
- Display difference: Display the difference between the benchmark and the field being compared against it. The value will be negative if the benchmark is higher, and positive if your data’s value is higher.
- Display benchmark: Display the exact value of the benchmark.
Displaying Benchmark Comparisons
Displaying Benchmark Comparisons in a Dashboard
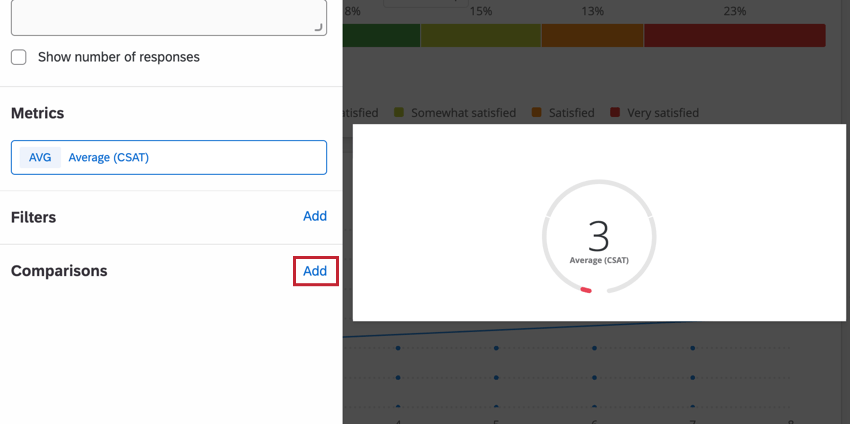
You can add benchmarks to your gauge chart widget so you can compare your data with benchmark data. To add benchmarks to your widget, you must first create benchmarks in the dashboard benchmark editor. Once you’ve created benchmarks in your dashboard, you can add them to the widget by clicking Add in the Comparisons section.
After you’ve added your benchmark, click the comparison to edit the benchmark. You can then select your desired benchmark using the Metric dropdown menu. Your dashboard benchmarks will be at the bottom of the list.
You can then customize the following aspects of your benchmark:
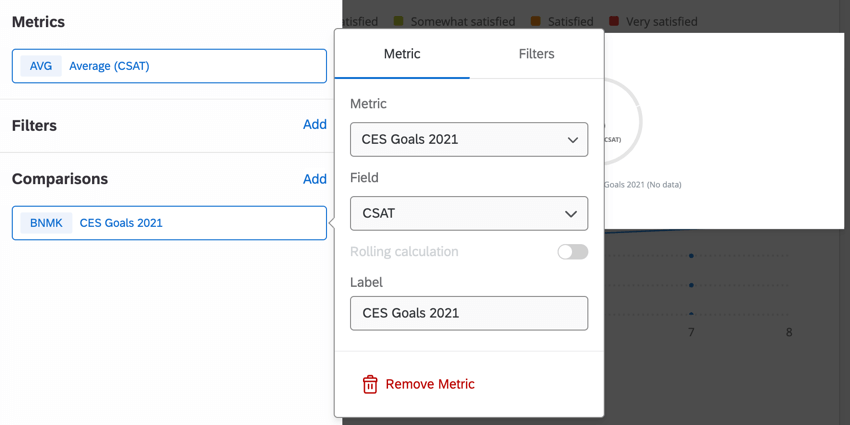
- Field: Select the field that is used for the benchmark data
- Label: Determine how the benchmark name appears in the widget.
Displaying One-Time Benchmarks
One-time benchmarks allow you to quickly visualize metrics from benchmark datasets without uploading a benchmark to your dashboard.
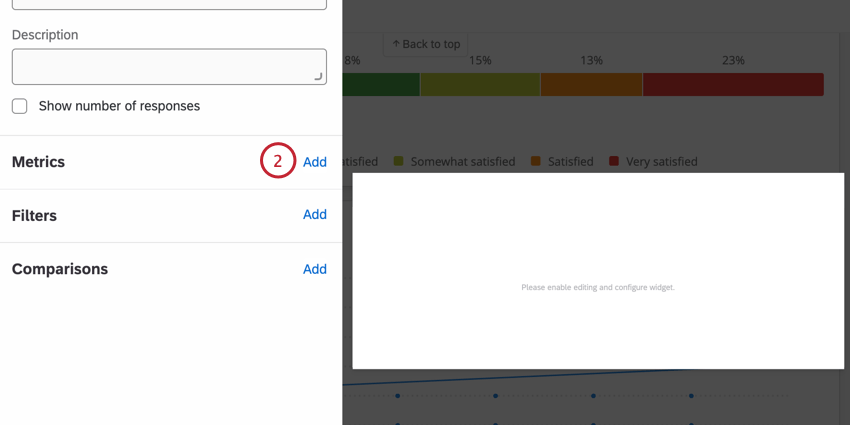
- Add a widget to your dashboard.
- Within the metric section select Add.
- Click on the metric dropdown and select Configure a one-time benchmark.
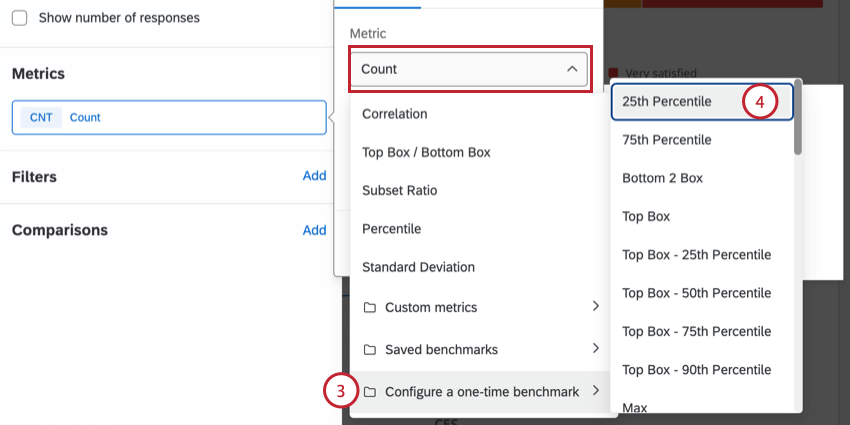
- Select your desired benchmark metric.
Qtip: If you selected Average, you can turn on Use percentile options. Select a percentile between 1-99 to display a specific percentile rank in the widget.
- Select a benchmark dataset.
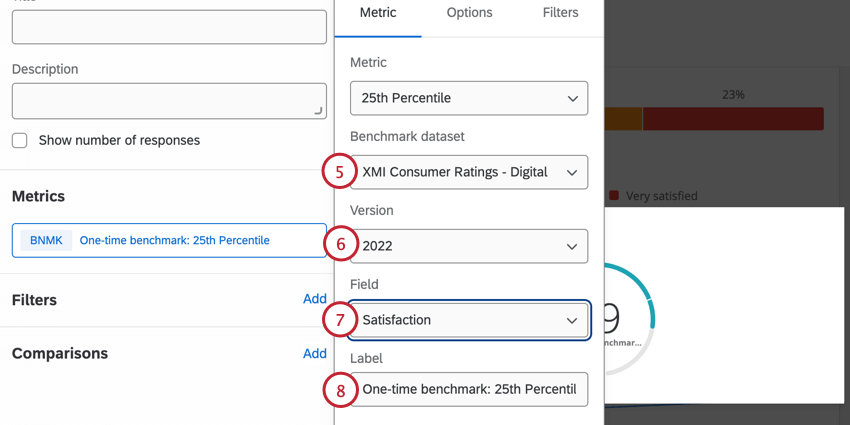
- Select a benchmark version.
- Select a benchmark field.
- If desired, edit the benchmark label.
Filtering One-Time Benchmarks
- Configure a one-time benchmark within your widget.
- Click on your benchmark metric.
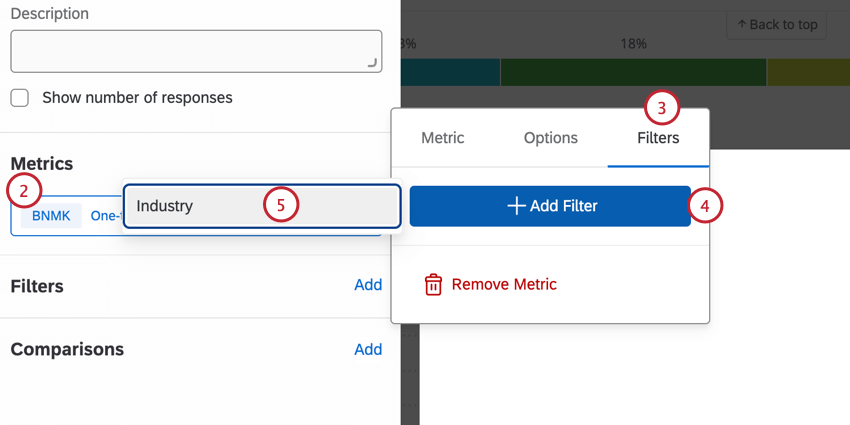
- Select the Filters tab.
- Select Add Filter.
- Choose your desired filter.
Available Benchmark Datasets
See Benchmark Types.