
Joins (CX)
What's on this page
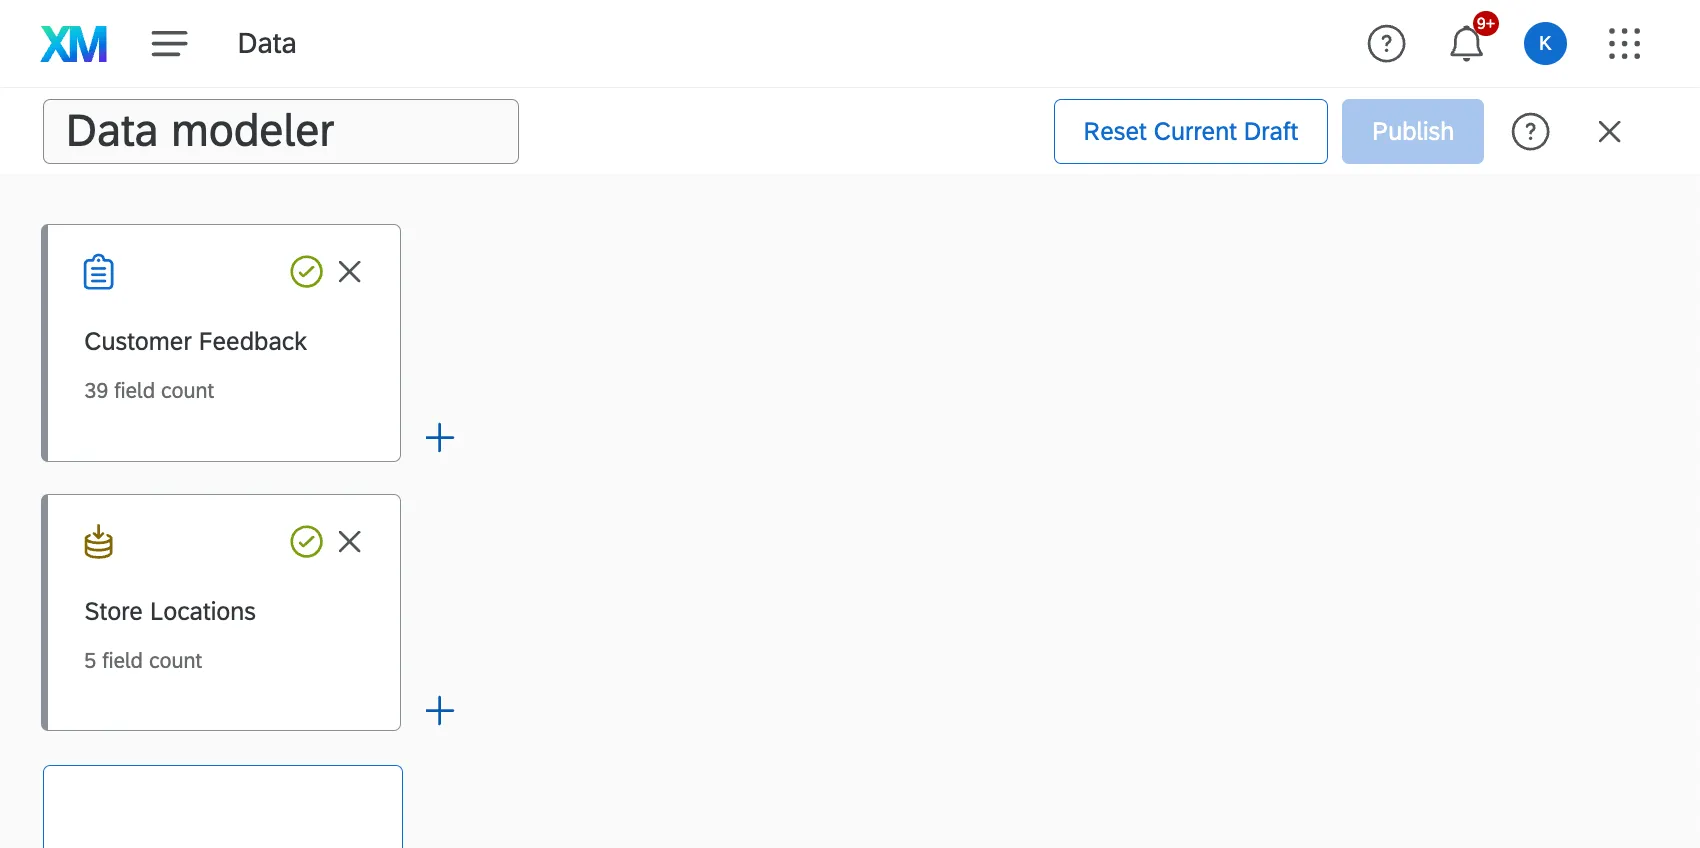
About Joins
Joins allow you to combine rows from 2 or more data sources based on a related column of data that they share. By using a join, you can gather and analyze the combined data more efficiently and effectively, creating more insights.
Example: Join the support tickets resolved for a customer with their survey data, directory contact data, and more, giving you a full profile of a customer’s interactions with your company.
The CX data modeler primarily supports left outer joins. Only left outer joins update continuously.
Qtip: Confused about what datasets are vs. data sources? Not sure how to tell the data mapper and modeler apart? Learn more about these and more key terms.
Join Keys
A join key is a field that helps match multiple datasets, identifying what records should be combined. For example, unique identifiers you map to your dashboard data, such as IDs and usernames. Join keys are important to making sure a join is set up correctly.
Some common join keys include:
- Username: The same username identifies the same customer across multiple surveys, helping you link all of their feedback in one place.
- ResponseID: A ticket created from a survey response saves the corresponding survey response ID. This response ID can be used to link the ticket information and the survey response so a customer support interaction and the customer’s feedback can be viewed as whole.
- Location ID: Location IDs are used to identify what store location customers are reviewing. You use the location ID to combine records across stores so you can compare store performance.
The data modeler does not support join keys that:
- Have been recoded.
- Have been edited.
- Are populated by any Text iQ field (for example, topics, sentiments, actionability, etc.).
Have more than 50,000 cases of the same value.

Qtip: It’s best to join by a field that has mostly unique values across records, like email address. It is not recommended to join by a large attribute that has the same value for many records, such as country.
Neither the join key added to the right or left side supports these setups.
Warning: You cannot use fields that have been recoded as join keys. If you recode a field after it’s been used as a field key, you won’t be able to publish dataset changes.
Understanding Left Outer Joins
To understand how a left outer join works, let’s look at an example. Here, we’re going to add more information about a store location to customer feedback.
Look at the image of the dataset below. The first data source on top is our “left” data source, and the second data source on the bottom is our “right” data source.
Let’s say these tables represent the data you can find in each survey:
Customer Feedback (Left Source)
| Customer ID | Satisfaction (1-5) | Location ID |
|---|---|---|
| 101 | 2 | 555 |
| 102 | 4 | 777 |
| 103 | 5 | 999 |
| 104 | 5 | 222 |
| 105 | 3 | 555 |
Store Locations (Right Source)
| Location ID | Location name |
|---|---|
| 555 | Provo |
| 777 | Dublin |
| 999 | Seattle |
| 1000 | Tokyo |
You choose to join the data based on Location ID. This field is called a “join key.”
This is the data unique to the second (right) dataset. This would be removed:
| Location ID | Location name |
|---|---|
| 1000 | Tokyo |
This is the final output, or all of the data that would be included in your results:
| Customer ID | Satisfaction (1-5) | Location ID | Location name |
|---|---|---|---|
| 101 | 2 | 555 | Provo |
| 102 | 4 | 777 | Dublin |
| 103 | 5 | 999 | Seattle |
| 104 | 5 | 222 | null |
| 105 | 3 | 555 | Provo |
Notice how the Provo, Dublin, and Seattle results contain columns of data from both the Right and Left sources, because these rows shared common location IDs.
There was no customer feedback data for Tokyo in the Left source, so Tokyo isn’t in the final dataset. Furthermore, there’s no location with the ID 222, so this store’s name is returned as “null.”
Importance of Unique Join Keys
Because join keys help to identify rows that need to be combined from the left and right sources, we recommend making sure the join key you use acts like a unique identifier. Otherwise, if there are multiple records in the right source that match the join key of the left source, only one of them will be pulled randomly.
Example: Let’s look at the example we discussed above. We have the same left source. But in the right source, we have these rows:
Location ID Location name 338 Raleigh 338 Charlotte In the resulting join, only one of the 338 rows will be saved, but not both.
If the join key isn’t unique for each record on a right source, and you want to include all records from both the right and left source, a union should be used instead. Unions pull in each of the records separately instead of combining the rows of information.
Understanding Inner Joins
Attention: Inner and full outer joins are currently in development, and are not yet available to all customers. Qualtrics may, in its sole discretion and without liability, change the timing of any product feature rollout, change the functionality for any in preview or in development product feature, or choose not to release a product feature or functionality for any reason or for no reason. If you’re interested in trying this feature, please reach out to Account Services.
Attention: Inner joins update periodically with new data instead of continuously. See linked page for details.
With an inner join, the resulting, merged dataset only includes matching rows found in both datasets. Because inner joins exclude records from either source that are missing data, the resulting datasets tend to have fewer empty columns, and the order of sources (which is left or right) matters less than with other join types.
Let’s say these tables represent the data you can find in each survey:
Customer Reward Tier (Left Source)
| Customer ID | Name | Reward Tier |
|---|---|---|
| 101 | Phil Stein | Emerald |
| 102 | Amir Dar | Gold |
| 103 | Beth Green | Silver |
| 104 | Lucia Vasquez | Emerald |
Store Experience Feedback (Right Source)
| Customer ID | Satisfaction (1-5) | Store |
|---|---|---|
| 101 | 1 | Provo |
| 104 | 3 | Provo |
| 113 | 5 | Scranton |
You choose to join the data based on Customer ID. This field is called a “join key.”
This is all of the data from each source that would be excluded from the final dataset.
| Customer ID | Name | Reward Tier | Satisfaction (1-5) | Store |
|---|---|---|---|---|
| 102 | Amir Dar | Gold | Null | Null |
| 103 | Beth Green | Silver | Null | Null |
| 113 | Null | Null | 5 | Scranton |
This is the final output, or all of the data that would be included in your results:
| Customer ID | Satisfaction (1-5) | Name | Store | Reward Tier |
|---|---|---|---|---|
| 101 | 1 | Phil Stein | Provo | Emerald |
| 104 | 3 | Lucia Vasquez | Provo | Emerald |
Even though these sources are being joined by customer ID, the customers with IDs 102, 103, and 113 are excluded from the final dataset because they are missing too much information. Only Phil (101) and Lucia (104) have full data available from both sources.
Understanding Full Outer Joins
Attention: Inner and full outer joins are currently in development, and are not yet available to all customers. Qualtrics may, in its sole discretion and without liability, change the timing of any product feature rollout, change the functionality for any in preview or in development product feature, or choose not to release a product feature or functionality for any reason or for no reason. If you’re interested in trying this feature, please reach out to Account Services.
Attention: Full outer joins update periodically with new data instead of continuously. See the linked page for details.
With a full outer join, the resulting, merged dataset includes all rows from both datasets. While records will be matched and merged by join key, even records that are missing data for the join key will be included in the final dataset.
Let’s say these tables represent the data you can find in each survey:
Customer Reward Tier (Left Source)
| Customer ID | Name | Reward Tier |
|---|---|---|
| 101 | Phil Stein | Emerald |
| 102 | Amir Dar | Gold |
| 104 | Lucia Vasquez | Emerald |
| Null | Beth Green | Silver |
Store Experience Feedback (Right Source)
| Customer ID | Satisfaction (1-5) | Store |
|---|---|---|
| 101 | 1 | Provo |
| 104 | 3 | Provo |
| 113 | 5 | Scranton |
You choose to join the data based on Customer ID. This field is called a “join key.”
This is the final output, or all of the data that would be included in your results.
| Customer ID | Satisfaction (1-5) | Name | Store | Reward Tier |
|---|---|---|---|---|
| 101 | 1 | Phil Stein | Provo | Emerald |
| 102 | Null | Amir Dar | Null | Gold |
| 104 | 3 | Lucia Vasquez | Provo | Emerald |
| 113 | 5 | Null | Scranton | Null |
| Null | Null | Beth Green | Null | Silver |
Notice how no data is excluded. Even Beth Green, who is missing data for Customer ID, is included in the results. If there were multiple null Customer ID rows, each of those rows would be included and remain separate, unique records.
Qtip: To include every row from both datasets, use a Union. A full outer join combines data from both sets while matching records based on the join key, which will result in fewer rows than the combined total from both datasets. It will include all joined records, as well as any records that failed to join from both datasets.
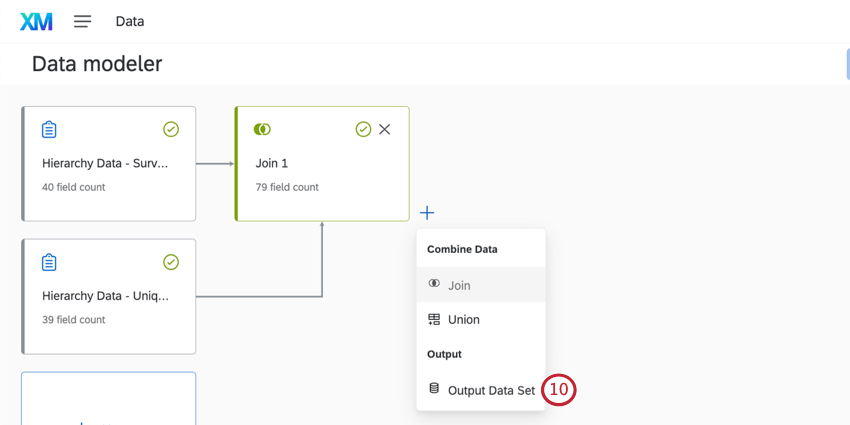
Creating Joins
Qtip: A source can only be used in a join 15 times, regardless of dataset. Joins in merge tasks count towards this limit. (That same source can still be used in additional unions, so long as there are no more than 15 joins total.)
Qtip: There’s a maximum of 6 joins per dataset. (You can still add unions to that dataset once the join limit is reached, so long as here are no more than 6 joins total.)
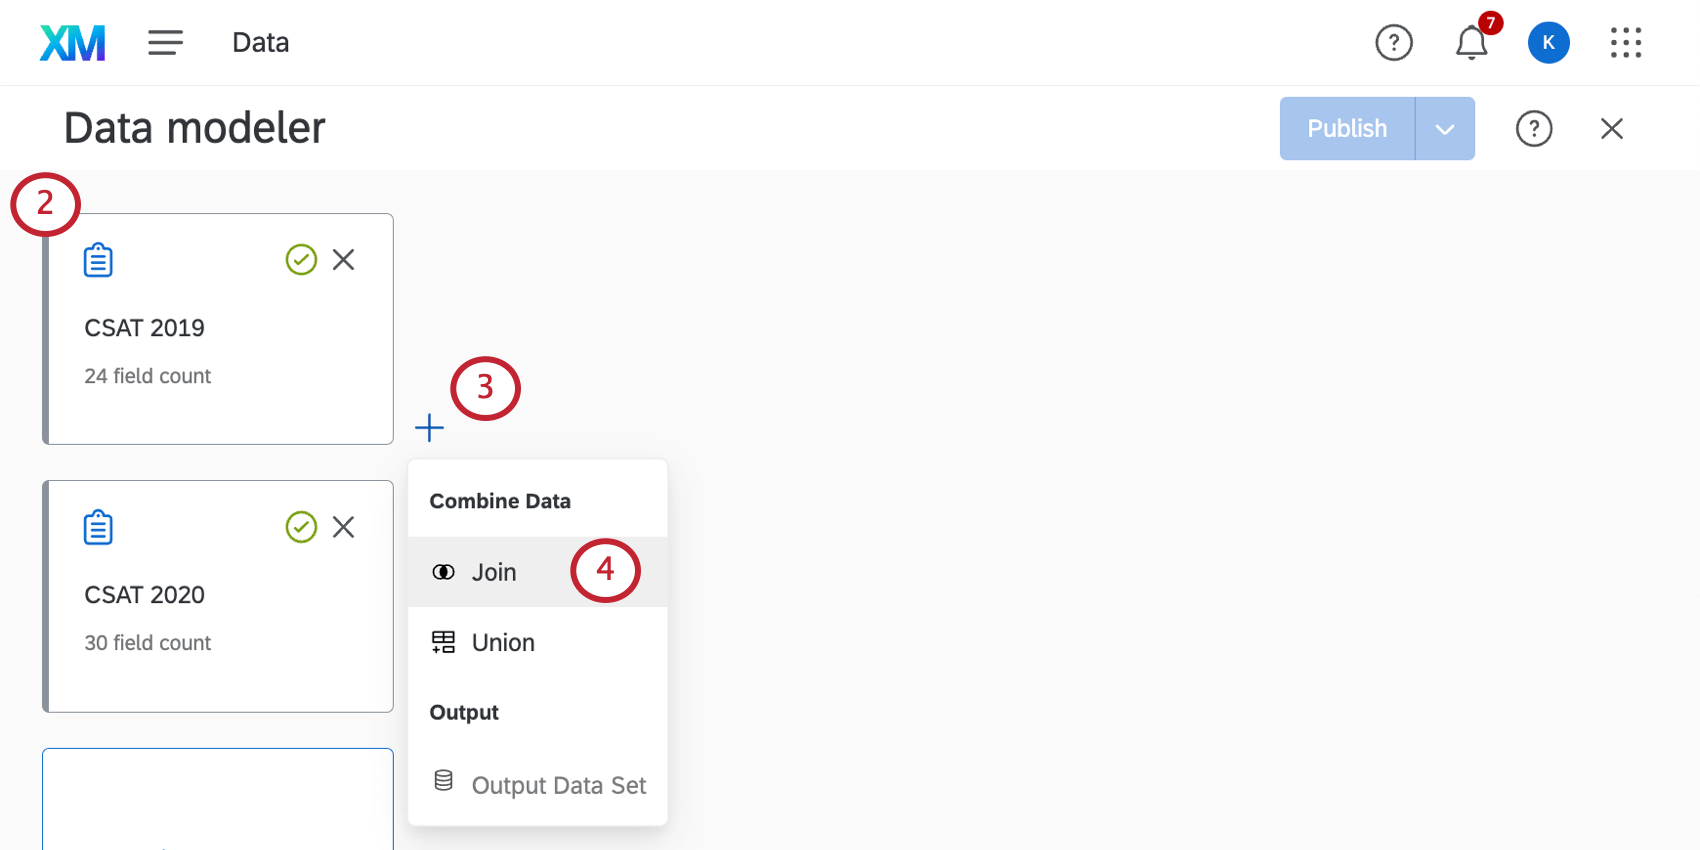
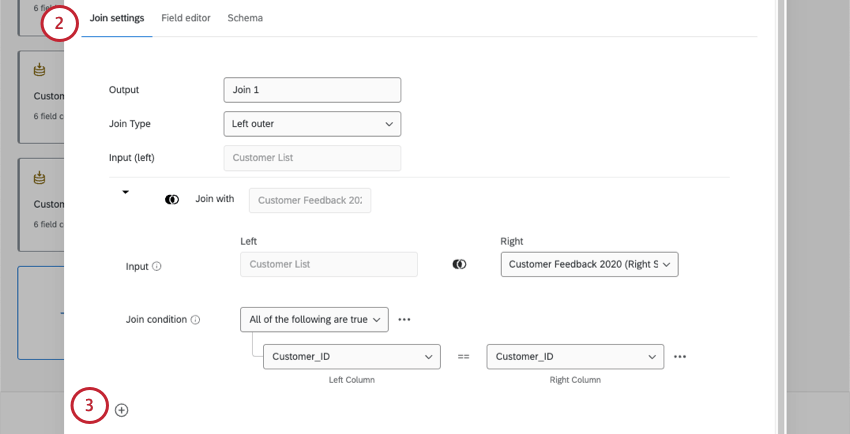
Qtip: Make sure you include all the fields you need in your data sources, including the common field you’ll use to join your data (e.g., a unique ID).
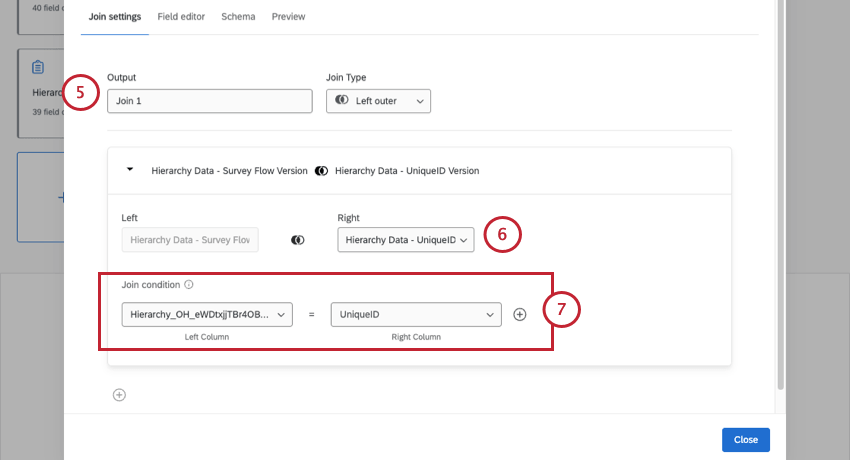
Example: Here we are mapping our Unique ID field from each data source to each other.
Qtip: Almost all field types can be used in join conditions, except Date fields and Multi-Answer Text Set fields. We highly recommend using a unique identifier that matches across both data sources.
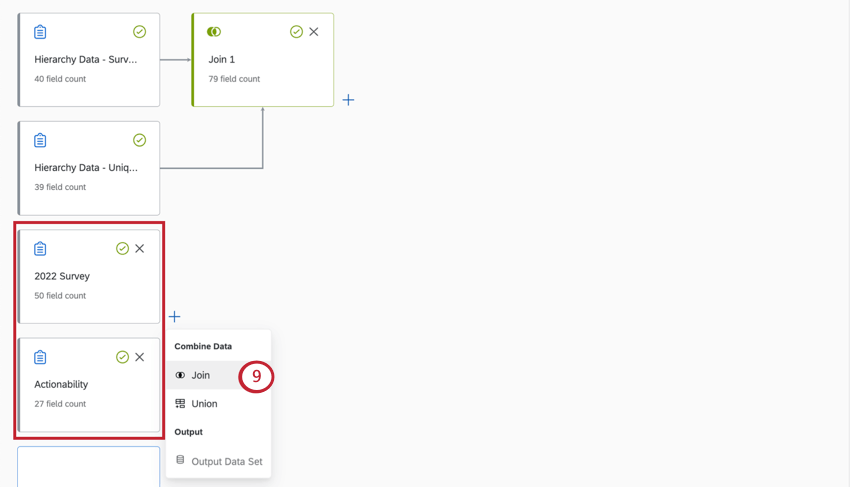
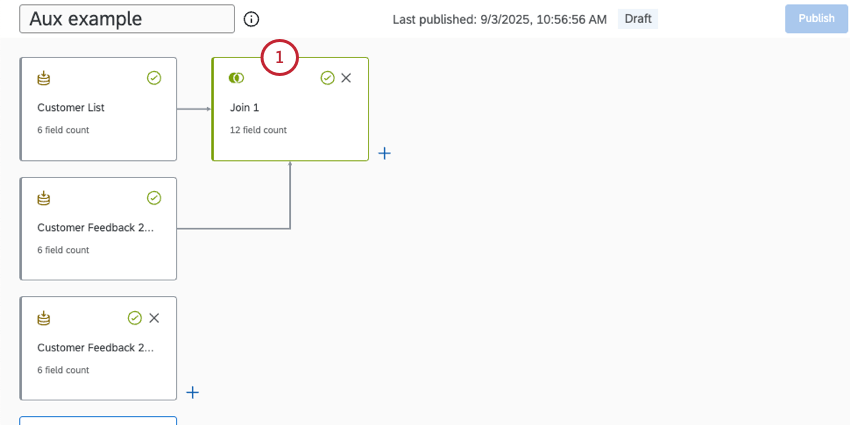
Adding Multiple Joins with the Same Condition
Joining multiple sources with the same join condition is useful when you want to create multiple, overlapping joins using the same data sources.
Earlier, we talked about how left outer joins work with 2 sources: a right source and a left source. This multiple joins method lets you set multiple right sources for the same left source in a join.
Qtip: Datasets with multiple joins that share the same condition will update continuously. See more on continuous vs. periodic dataset updates.
Example Auxiliary Join
Let’s say you have a database of customers, with names linked to IDs. You have 2 years of surveys where you collect customer feedback. In the example below, we’ll find the satisfaction rating and customer’s name for feedback submitted in 2020 and 2021.
Customer List (Left Source)
| Customer ID | Customer name |
|---|---|
| 101 | Jimmy Horowitz |
| 102 | Deepti Pathan |
| 103 | Gina Chung |
| 104 | Daniel Wagner |
Customer Feedback 2020 (Right Source)
| Customer ID | Satisfaction (1-5) |
|---|---|
| 101 | 2 |
| 102 | 4 |
| 103 | 5 |
Customer Feedback 2021 (Additional Right Source)
| Customer ID | Satisfaction (1-5) |
|---|---|
| 101 | 3 |
| 104 | 5 |
| 838 | 4 |
You join the data based on Location ID.
This is the final output, or all of the data that would be included in your results:
| Customer ID | Customer name | Satisfaction 2020 | Satisfaction 2021 |
|---|---|---|---|
| 101 | Jimmy Horowitz | 2 | 3 |
| 102 | Deepti Pathan | 4 | null |
| 103 | Gina Chung | 5 | null |
| 104 | Daniel Wagner | null | 5 |
Notice how 2020 and 2021 data have become separate columns in the same output dataset.
You’ll notice Jimmy is the only customer who submitted feedback for both years, so both of his columns have values. Everyone else has an empty, “null” cell under the year of feedback they missed.
Records with customer ID “838” were excluded from the final data source, since the customer list had no corresponding name/record for that ID. See Understanding Left Outer Joins for an explanation of how data is excluded.
Creating Multiple Joins with the Same Condition
Attention: You can add up to 6 additional joins per each individual join. This counts towards your overall limit of 6 joins per dataset.
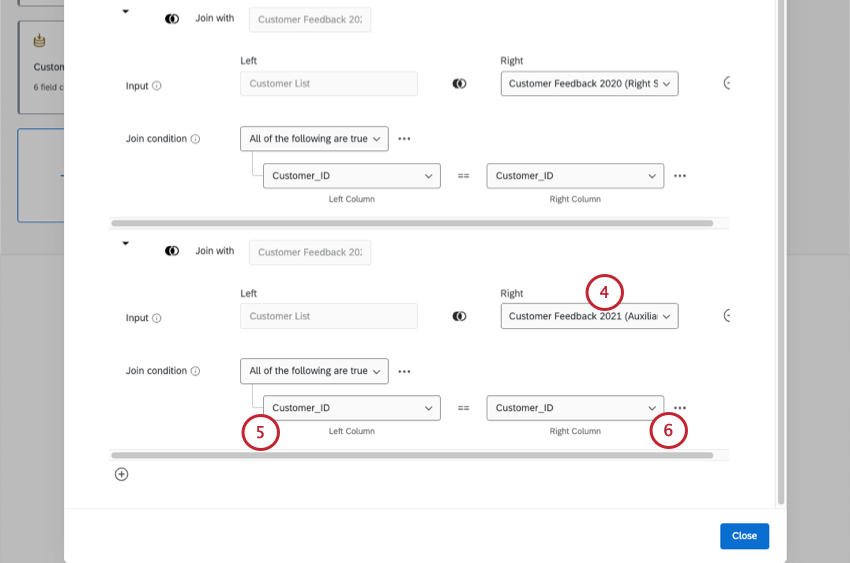
Example: This is the second source you want to join to your left source. In our example above, this would be the 2021 customer feedback survey.
Repeat steps as needed to add more joins.
Chained Joins
In a chained join, you create a join with another join inside it. In this case, the join is defined inside the same single node, with overlapping sources. Data models currently support chained joins. However, once a dataset has chained joins, it updates periodically instead of continuously.
Qtip: A chained join is different from multiple joins that share the same condition. Joins that share conditions are also supported.
The below example is a chained join. Note how there are separate joins inside other joins.
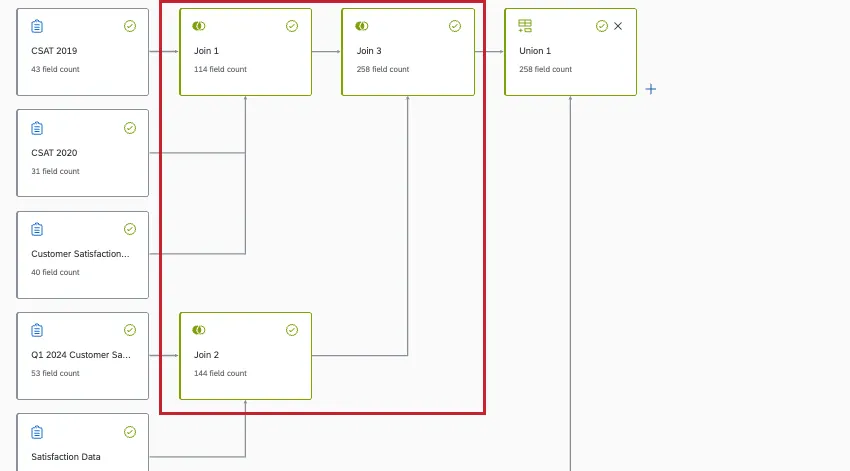
Qtip: In general, we recommend creating your union nodes first, then joins. If you need to make joins first, this will results in slower data, but is ok so long as your join nodes come together into a union node, not another join node.
FAQs
Are changes to data models reflected immediately in dashboards?
Are changes to data models reflected immediately in dashboards?
If you have multiple sources of the same type in your dataset (such as tickets and surveys), we generally recommend creating unions before you create joins.
What happens if I edit a field that’s being used to join 2 data sources together?
What happens if I edit a field that’s being used to join 2 data sources together?
That's great! Thank you for your feedback!
Thank you for your feedback!