
Employee Experience Journeys
What's on this page
About Employee Experience Journeys
There are many types of employee journeys, and studying them can help you understand what areas to target in order to improve your employees’ overall experience. With Qualtrics Journeys, you can split the journeys you’re interested in into different stages (or milestones), and see how each is performing.
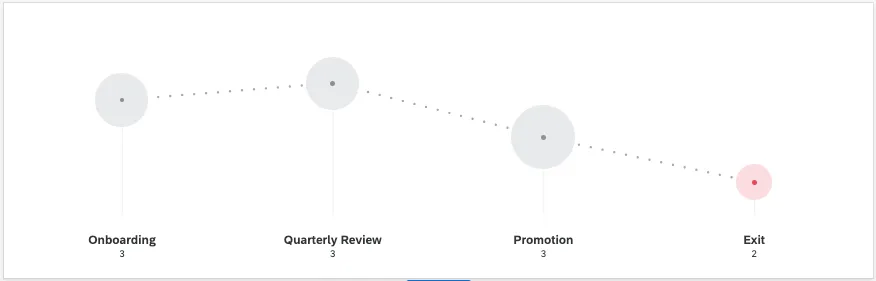
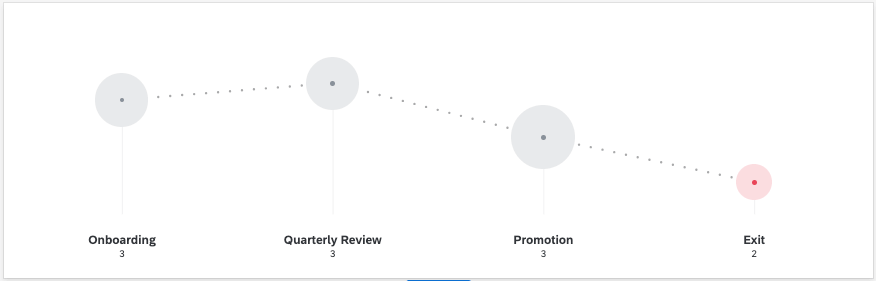
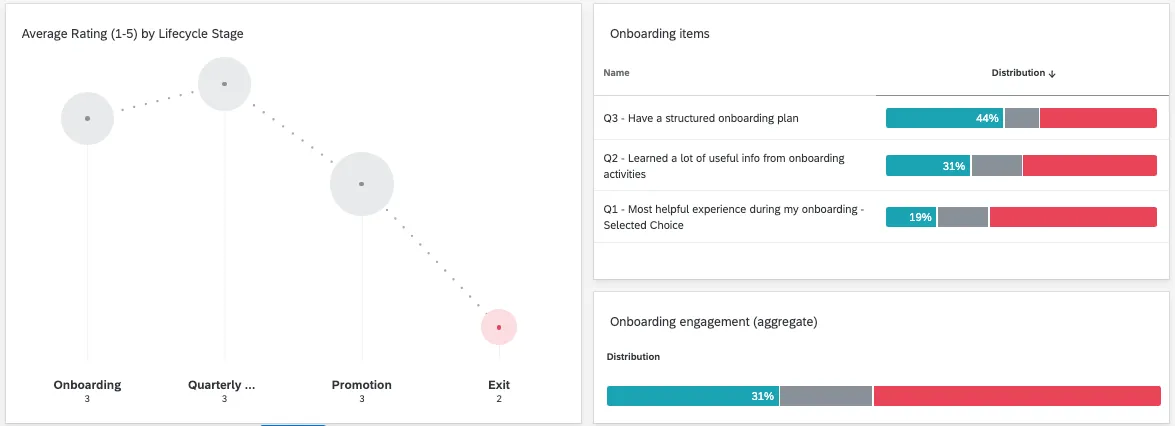
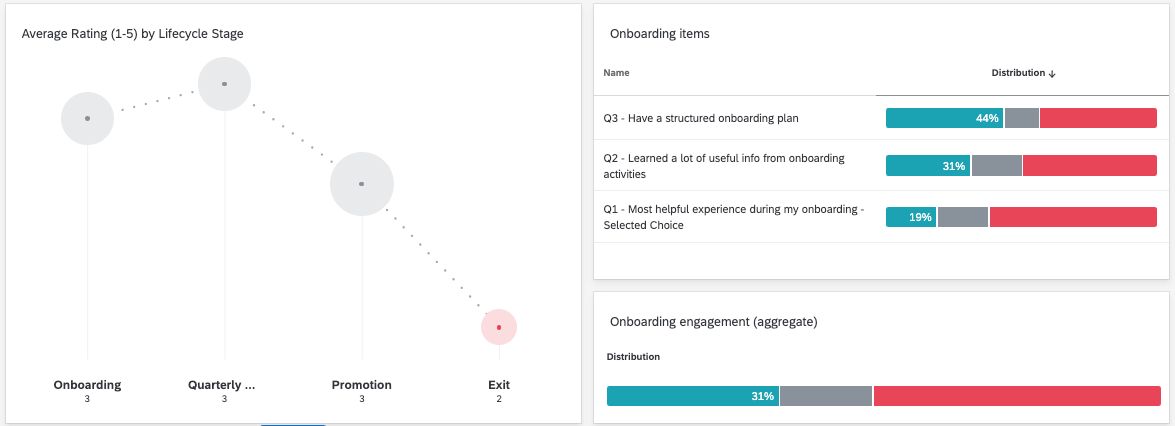
Example: Here is a basic employee lifecycle journey. This widget shows the average rating for employee engagement in each stage, from a scale of 1-5.
This page will cover best practices for using journey features with the Employee Experience product line. These best practices cover every step, from the surveys’ first creation, to data reporting.
Qtip: This page focuses on the Journeys feature, which is only available in certain licenses. See more on how to get Journeys enabled. This feature can be used with Employee Journey Analytics, but they are separate features with separate enablement.
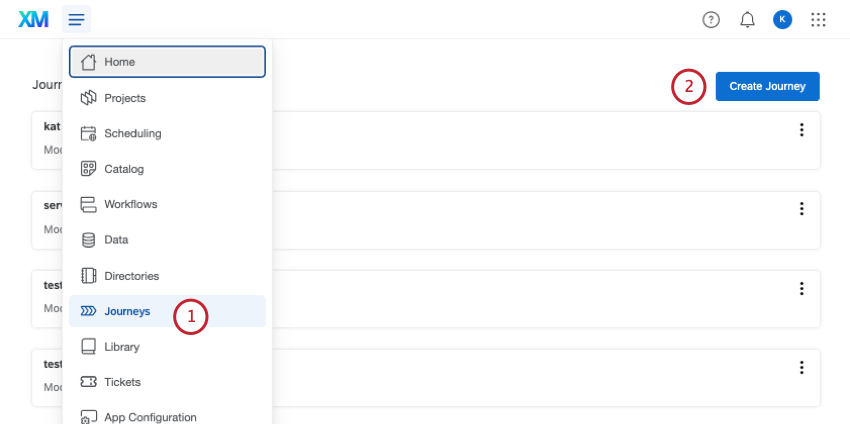
Step 1: Defining an Employee Journey
Qtip: If you’re not sure how to define your journey, its stages, and its outcome, it can help to check out our introduction to journeys.
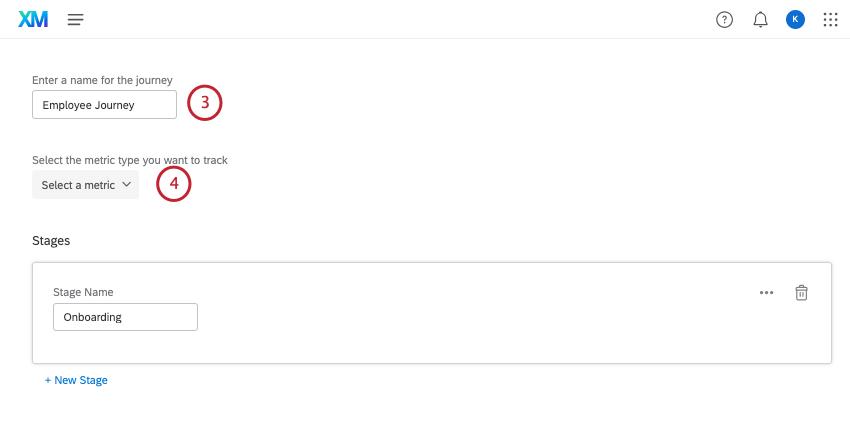
Qtip: These metrics are specialized for customer experience research, but they are not a required field. If you select a metric, you’ll need to create a new journey from scratch.
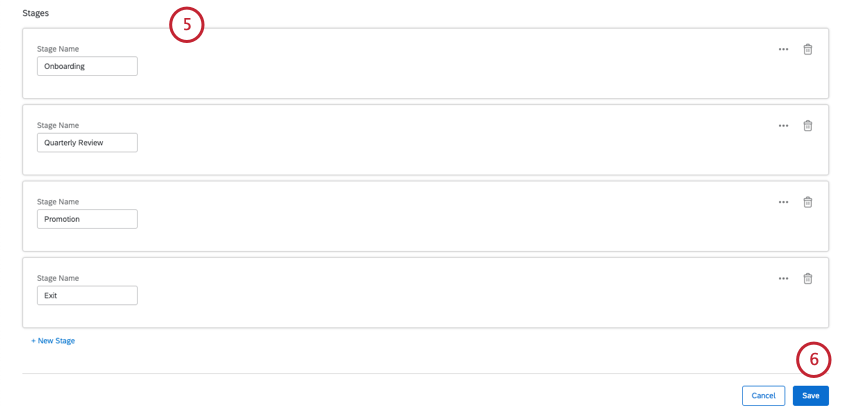
Qtip: For more details, see Defining Your Journey Stages.
Step 2: Creating Milestone Surveys
Choosing Project Types
Employee Experience comes with a few different project types suited to experience research. One of the benefits of these projects is the participant list, which can link data back to a larger employee directory and, in some cases, help keep responses organized by employee structure, for reporting.
While journey data is technically compatible with many project types, we recommend using:
Ad Hoc Employee Research is designed for exactly its name: any employee research you want to conduct that doesn’t easily fit into a box. Lifecycle projects, on the other hand, often capture the exact moments you want to cover in your employee journeys, such as onboarding and exit.
Survey Structure
Once you’ve chosen your project types, it’s time to create your surveys.
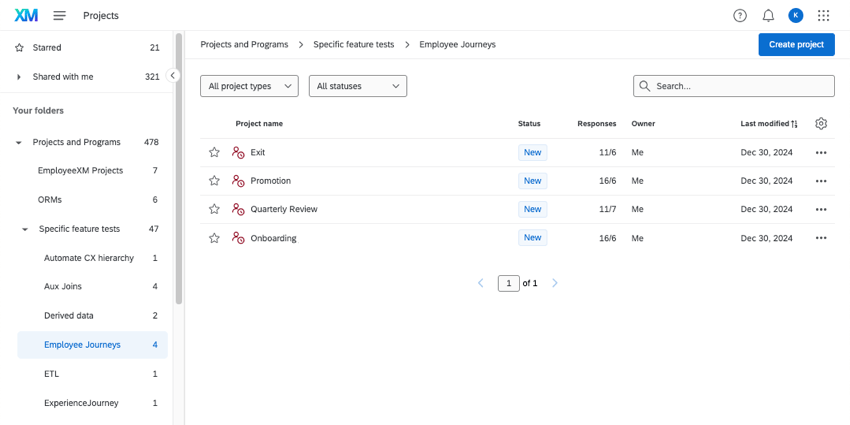
Example: We created a Lifecycle project for each of the following:
- Onboarding
- Quarterly Review
- Promotion
- Exit
Qtip: See Outcomes for information on creating an effective outcome metric.
Attention: You must use the same names for your stages that you used on the Journeys page.
Example: If it’s “Quarterly Review” in your journey, it cannot be “QuarterlyReview” in your embedded data.
Step 3: Setting Up Dashboards
You can set up your dashboard and its data inside any of the stage projects you created.
Qtip: See more on adding multiple sources in employee projects.
Once you finish these steps, you can create a journey chart widget.
You can also use other widgets to create deeper reports into each stage of the journey, just as you would any other data.
Example: Next to this journey chart, this dashboard shows how the onboarding stage performs on other engagement criteria.
Other Optional Ideas
Using Categories as Outcome Metrics
Categories are a commonly used feature in employee projects. Categories allow you to aggregate many related questions into a common theme. So long as you have the same set of questions in each of your stage surveys, using categories can be a great way to customize your journey chart’s outcome metric and show the impact of each milestone in your employee journey.
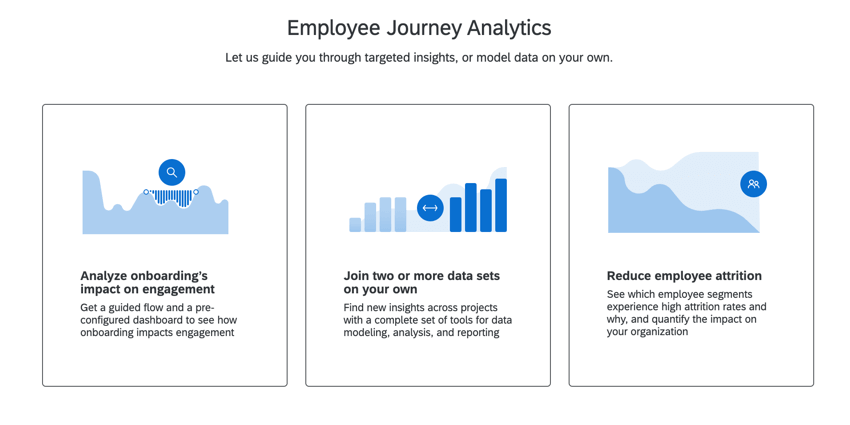
Using Employee Journey Analytics for the Dashboard
Employee Journey Analytics is a special project type that can bring data from other existing projects into one big dashboard. As you can guess from the name, Employee Journey Analytics is another way to analyze employee journeys. If you’re interested in creating journey analyses different from what we’ve described on this page, you can try out some of the guided flows. These will help you build dynamic projects step-by-step, complete with premade dashboards.

Employee Journey Analytics has a unique way of mapping data called the data modeler. The modeler can do everything the mapper can, but with a different interface, and with more advanced functionality. For example, you aggregate data and create joins.
Thus, you can either use prebuilt project setups, or build Employee Journey Analytics from scratch. If you make your own custom Employee Journey Analytics dashboard, you can use it to report on the data we’ve described on this page.
Employee Journey Analytics dashboards can use journey charts.
That's great! Thank you for your feedback!
Thank you for your feedback!