-

Qualtrics Platform -

Customer Journey Optimizer -

XM Discover -

Qualtrics Social Connect
Response Weighting in CX Dashboards
About Response Weighting
Response weighting allows you to establish alternate weightings for your dashboard data so that your dashboards are based on a desired distribution, rather than the actual distribution. This can help you correct your data for under-surveyed populations that you want to represent appropriately. Qualtrics will automatically determine how to weight each response and correct your widgets as new data comes in. This means you only need to set up your weighting once per dashboard data mapping.
Setting Up Response Weighting
- Map your dashboard data sources.
- Go to the settings of a CX Dashboard and select Response weighting.
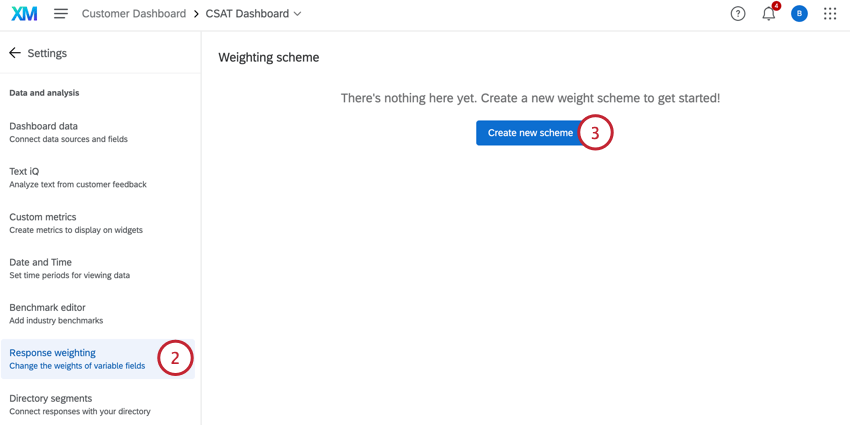
- Click Create new scheme.
- Follow the steps under Adding Weights. Although this linked page is for weighting in a survey, the functionality is exactly the same as in CX Dashboards.
Currently, you cannot export your calculated weights for raked weighting.
Weighting Multiple Variables: Raked vs. Interlocked
For an explanation of how the different types of weighting work, see Weighting Multiple Variables: Raked vs. Interlocked. Although this content is on a survey support page, the functionality is the same in CX Dashboards.
Using Time as a Dimension
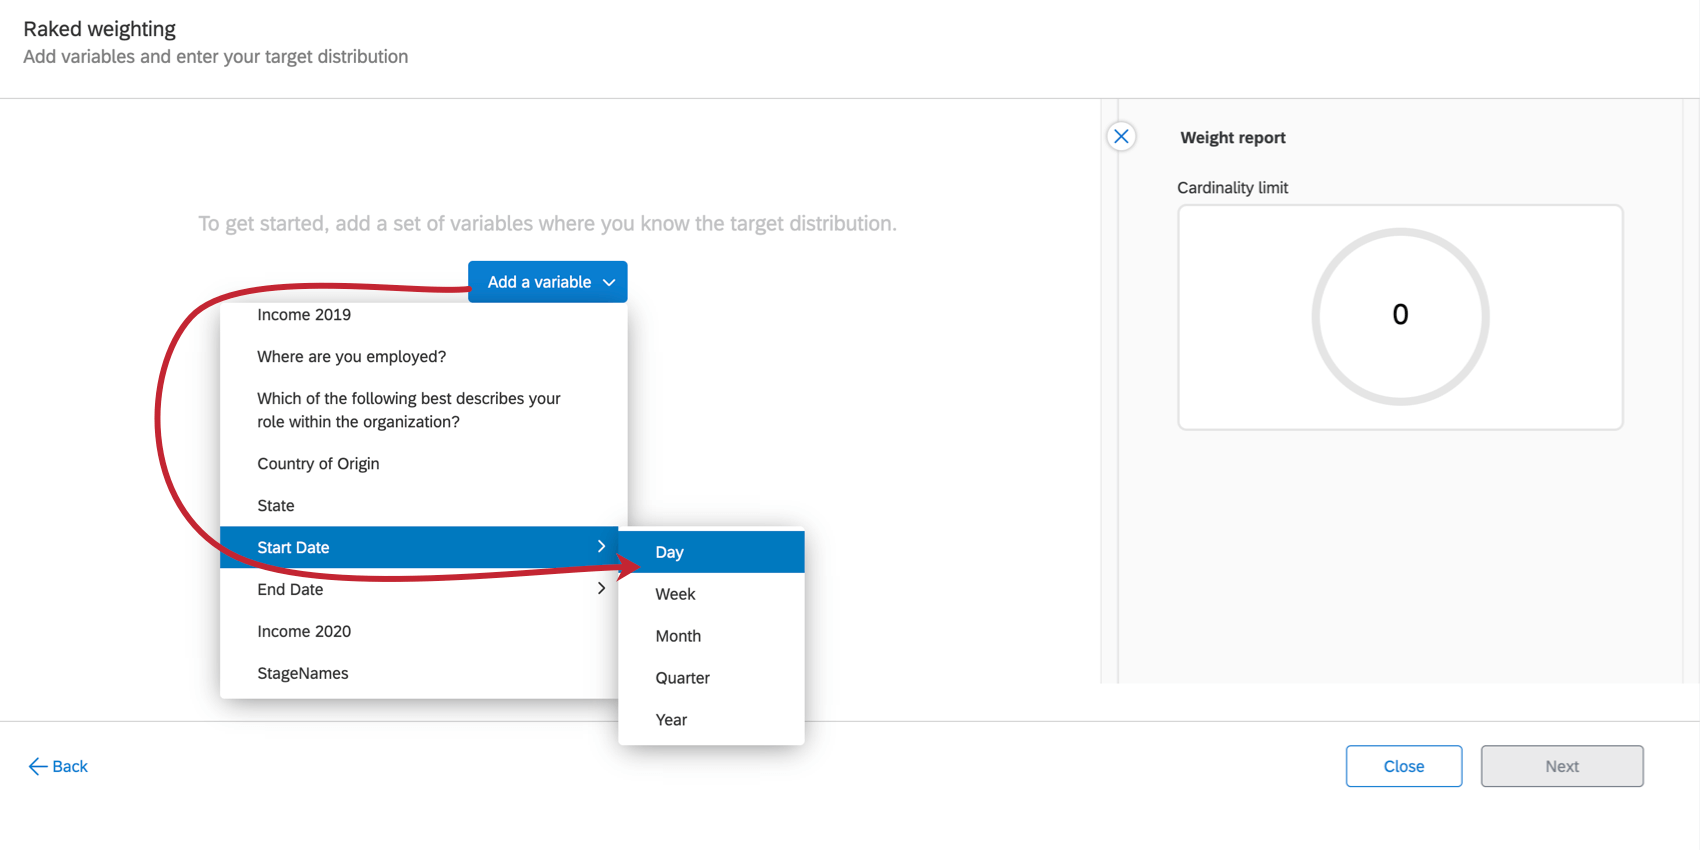
If you end up using a date data field type as a dimension, you will be prompted to choose the time periods you want to group the weighting by. For example, in the screenshot below, we choose Start Date, and then can choose between day, week, month, quarter, or year.
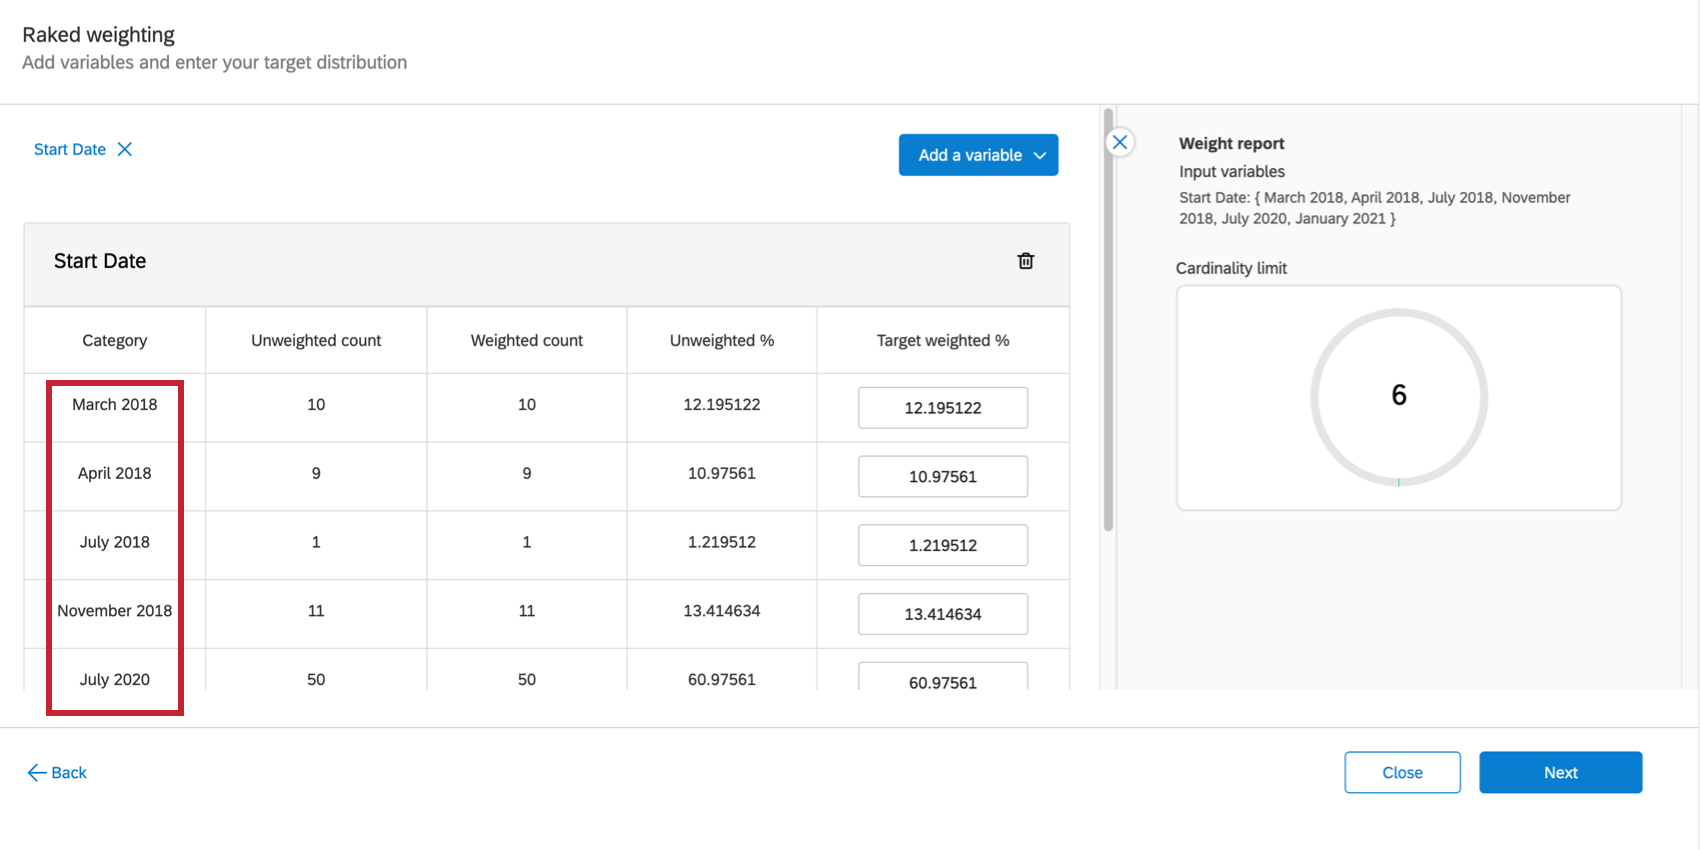
After saving your choices, CX Dashboards will automatically create groups for your time periods. You can then add weights to these periods just like you would for any other dimension.
Setting Widgets to Use Weighted Data
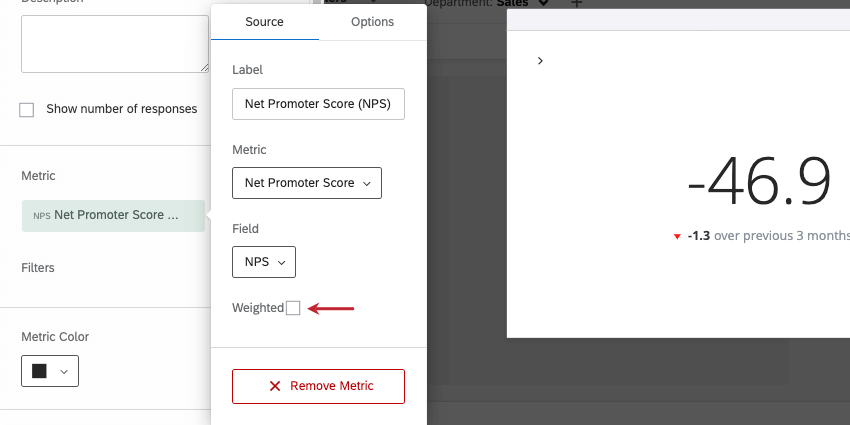
After setting up your response weighting, you can configure widgets to use the weighted values by editing the metric of the widget.
In the widget editing menu view, when you select the metric, there is a checkbox that allows you to toggle between weighted and unweighted response data. Note that this will only work for widgets that are using numeric data.
Exporting & Importing Weights
You can export your weights from Qualtrics and edit them outside of the platform. You can then re-import these weights for them to take affect in your CX Dashboard.
To learn more, see Exporting & Importing Weights. Although this content is on the survey support page, this functionality is the same as it is in CX Dashboards.