-

Qualtrics Platform -

Customer Journey Optimizer -

XM Discover -

Qualtrics Social Connect
Saving Dashboard Data Edits
About Saving Dashboard Data Edits
Most changes to fields, like adding or deleting a field or changing a field’s type, will cause the dashboard’s data to reindex. Reindexing is when the dataset is rebuilt to fit the changes you’ve made. It may take minutes to hours, depending on the size of your dataset.
Dashboard viewers can continue to access the previous version of the dashboard during indexing, instead of seeing partial data. Dashboard viewers will see new data when reindexing is complete. Dashboard editors will have a banner showing reindexing progress and have the option to see partial data as it comes in. This means you don’t have to wait for weekends and off hours to update dashboards, or worry about negatively impacting daily work that involves these dashboards when you push an update during work hours.
Important Considerations for Project Administrators and Dashboard Editors
As a dashboard editor, you can edit the fields of the dashboard’s data source in the Dashboard Data page of the dashboard’s settings:
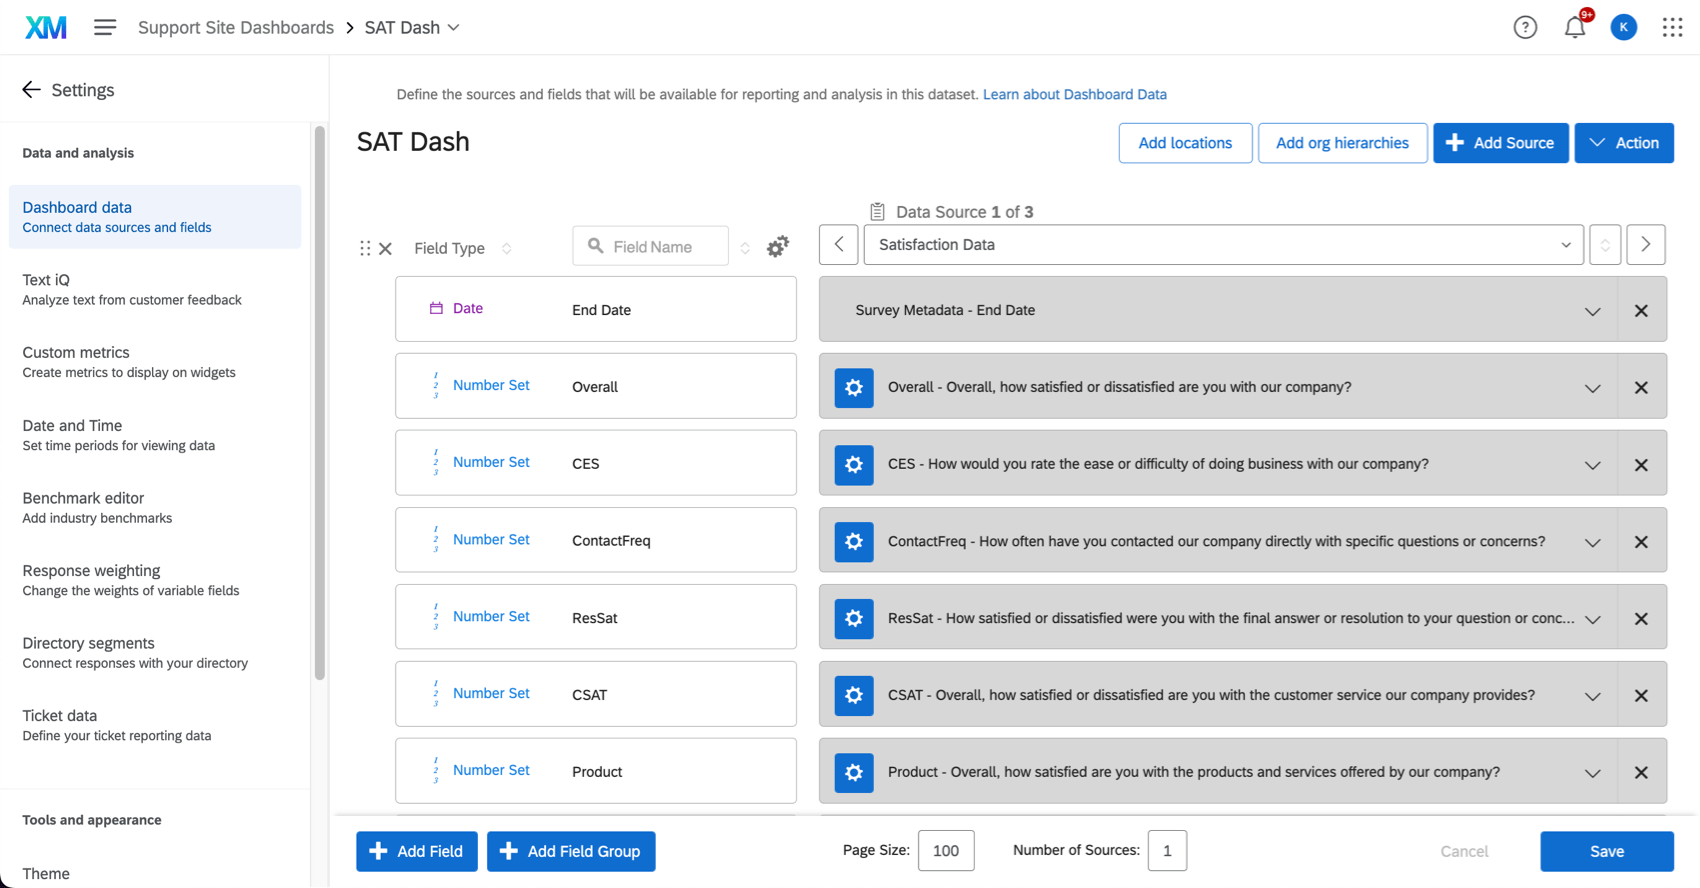
When editing the dashboard data, it’s best to make all necessary changes before clicking Save. If you save multiple times, it’ll submit multiple dataset reindexes, which may slow down the process.
Once you’ve completed all your changes, click Save. You’ll then see a modal that says the dashboard data will reindex. While reindexing occurs, the currently published version of the data will still be available for dashboard viewers.
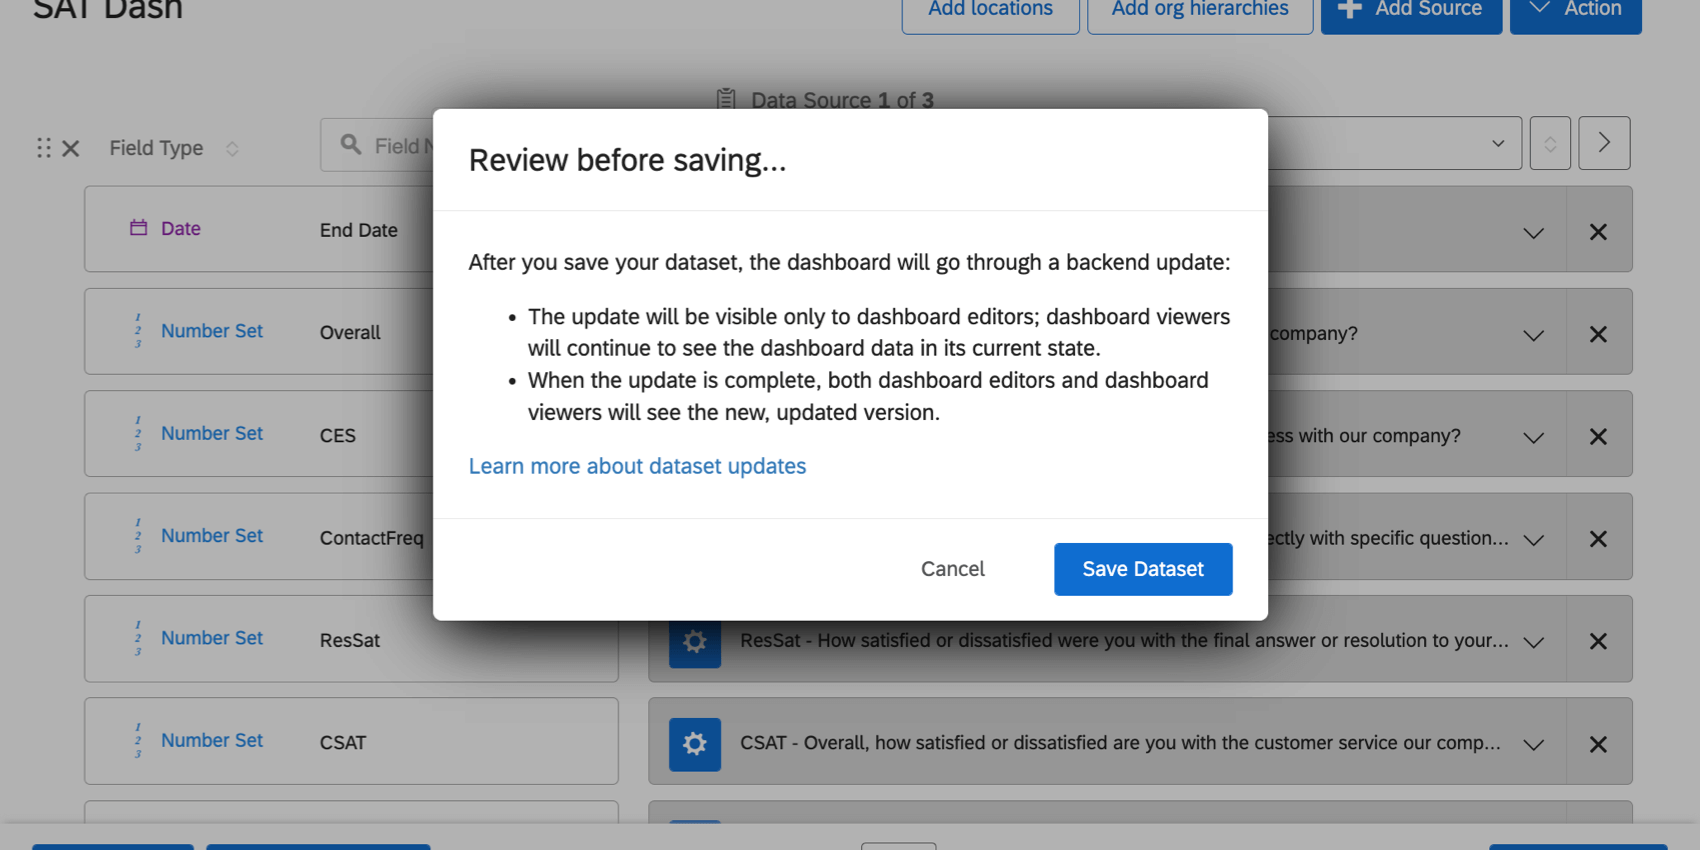
After navigating back to the dashboard, you’ll see the latest progress on the data being reindexed, meaning some widgets will display partial data. However, dashboard viewers will not see partial data. They will continue to see the last published dataset until your changes are finished reindexing.

Viewing the Published Version as a Dashboard Editor
After data starts reindexing, a banner will show up with the percentage of completion for the reindexing process. You can click the link in the banner to view the currently published version of the dashboard, which is what dashboard viewers see.
Important Considerations for Dashboard Viewers
Dashboard viewers will continue to be able to use the dashboard without any downtime while data is reindexing.
If dashboard viewers are still viewing the previously published version of the dataset when reindexing is finished, a banner will appear and let them refresh the page to view the latest version of the data.

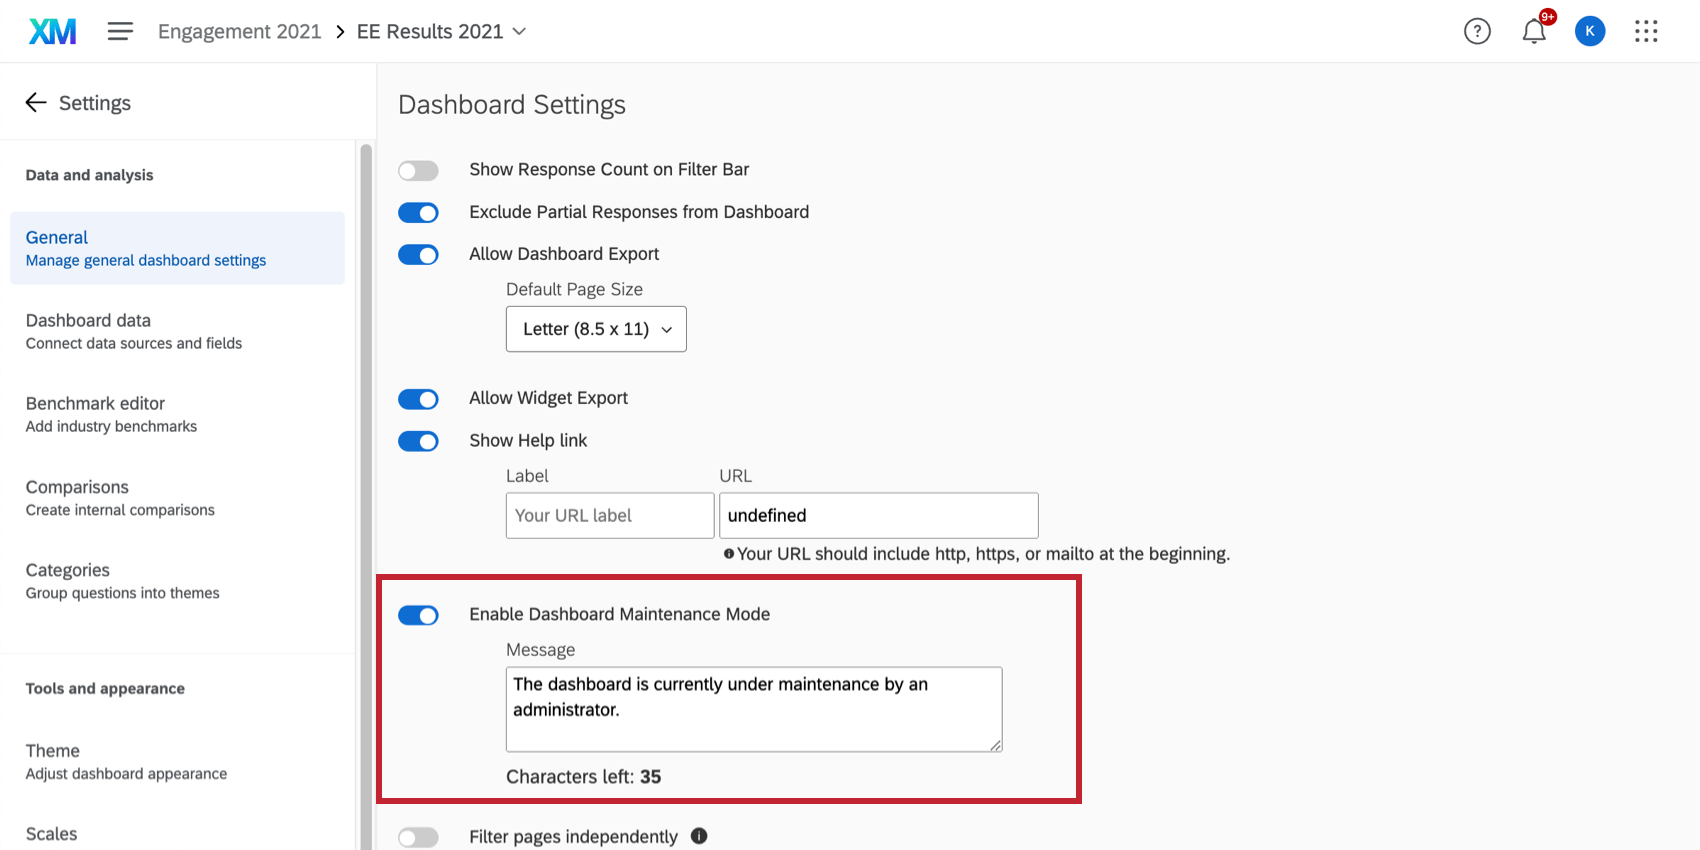
Maintenance Mode for EX Dashboards
Rather than giving dashboard viewers access to the previous data, you can instead make the dashboard data inaccessible to dashboard viewers during reindexing.
To do so, enable dashboard maintenance mode. If you are a dashboard editor, you will see the dashboard and be able to make edits, but dashboard viewers with no editing access will only see the message.
FAQs
- What are CX Dashboards?
-
Customer Experience Dashboard (or CX Dashboard) is another name for a Qualtrics Dashboards project. Because there are a few different kinds of dashboards across the XM Platform, and Dashboards projects are most often used in CX solutions, we use this name to help differentiate them.
- Can Dashboards projects only be used for customer experience research?
-
We call Dashboards projects "CX Dashboards"to help differentiate them from the many other types of dashboards we offer at Qualtrics. However, CX Dashboards are versatile, and can also help with IT, academic, or even healthcare use cases, and as such, can be included in Strategy & Research bundles. If you’re wondering how dashboards can benefit your organization, talk to your Account Team.
- What are EX Dashboards?
-
The term Employee Experience Dashboard (or EX Dashboard) refers to any dashboard created in a project specialized for Employee Experience (EX) research. To see a list of EX projects, see this page.