-

Qualtrics Platform -

Customer Journey Optimizer -

XM Discover -

Qualtrics Social Connect
Using Premade Qualtrics Benchmarks (CX)
About Qualtrics Industry Benchmarks
In addition to allowing you to set your own custom benchmarks, Qualtrics provides you with pre-made industry benchmarks you can use to measure your organization’s performance on common KPIs. These benchmarks are based on research collected by our expert Experience Management scientists. For many of these benchmarks, we refresh the data on a yearly basis, offering you the most up-to-date industry performance to measure your organization against.
List of CX Benchmarks
- Business to Business: The Business to Business benchmark contains key CX metrics such as NPS, CSAT, Likelihood to Renew, and more using data from companies across 11 industries.
- Business to Consumer: The Relational Net Promoter® Score (NPS®) benchmark is derived from Qualtrics’ vast Customer Experience database. The data include hundreds of anonymized and aggregated Qualtrics customers of various regions, countries, and industries.
- Consumer Net Promoter Score (NPS): The XMI Customer Ratings – Consumer NPS® are comprehensive Net Promoter® Score (NPS®) benchmarks based on data gathered on leaders in the Customer Experience industry.
- Contact Center: The Contact Center benchmark includes key metrics for companies looking to compare their contact center performance against peer organizations. This benchmark contains three agent performance metrics (friendliness, knowledgeability, and understanding) in addition to one overall support satisfaction metric.
- Credit Union: The U.S. Credit Union Member Experience benchmark allows credit unions to see how their member experiences compare to other credit unions. Benchmark scores include but are not limited to NPS, Overall Satisfaction, and touchpoint experiences for Branch, Digital, and Call Center. Data filters enable comparisons to similar types of credit unions on measures such as member size and total assets.
- CX Edge: A Customer Experience benchmark that uses a nationally representative sample of consumers who have evaluated individual brands. Category averages for NPS® and XMI Customer Ratings are calculated based on brand-level responses.
- Digital: The XMI Customer Ratings – Digital are benchmarks that provide a reference point for companies looking to compare their digital customer experience against peer organizations. If you select this option, you can also choose whether you’re benchmarking off of Effort, Satisfaction, Success (task completion) or Likelihood to Return.
- Overall: The XMI Customer Ratings – Overall is a cross-industry, open standard benchmark of customer experience. It evaluates experiences across three dimensions: success, effort, and emotion. If you select this option, you can also choose whether you’re benchmarking off of Effort, Emotion, Overall, or Success.
- Patient Experience: The Patient Experience Benchmark includes key metrics, such as Net Promoter Score (NPS) and Overall Rating of Care, along with modern Healthcare Experience Index questions that focus on success, effort, emotion, and trust.
Qtip: The Patient Experience benchmarks are included in CX 1, 3, and 5 licenses and will appear in the benchmark editor by default. If you have questions about your license, reach out to your XM Success Manager.
- Quick Service Restaurants Benchmark: The Quick Service Restaurant benchmark helps quick service restaurants understand how customer experience compares to industry peers. Benchmarks scores include ease of ordering, friendliness of the staff, satisfaction with the location, and more.
Exploring Qualtrics Benchmarks
Before adding a Qualtrics-made industry benchmark to your dashboard, you can preview it to get an idea of what the data looks like, and to make sure you have the right questions and data mappings to support it.
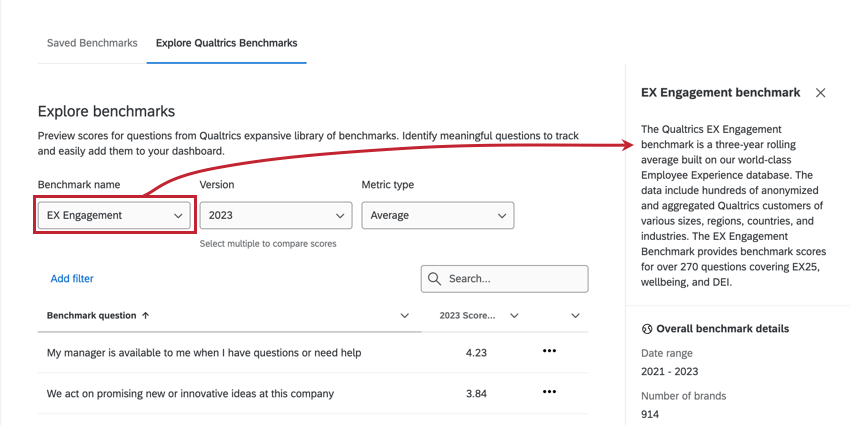
- In Benchmark settings, go to the Explore Qualtrics Benchmarks section.
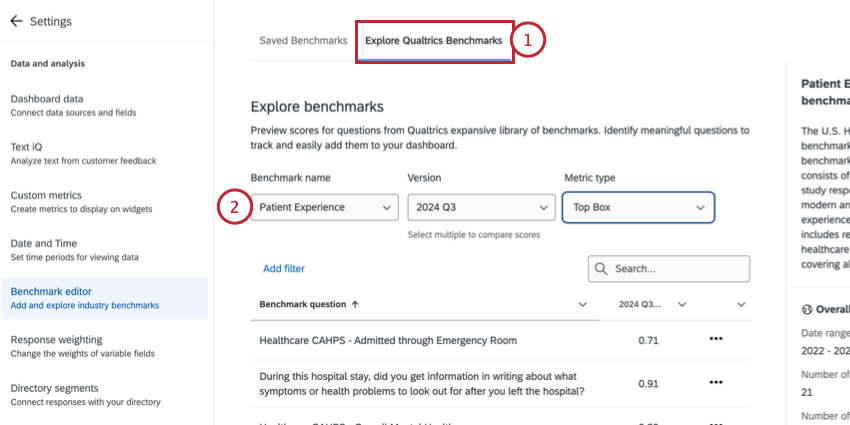
- Choose the benchmark you’d like to preview.
Qtip: You can read more information about the benchmark in the side panel to the right. This includes the methodology, number of responses, and date range.
- Select the date Version(s) you’d like to include in the benchmark. You can choose multiple versions to compare scores across time.
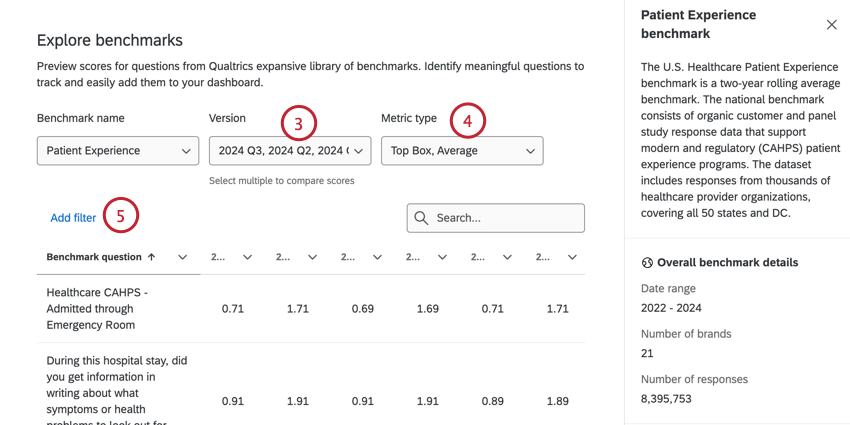
- Choose the Metric type(s) you’d like to include in the benchmark. You can select multiple metrics listed here.
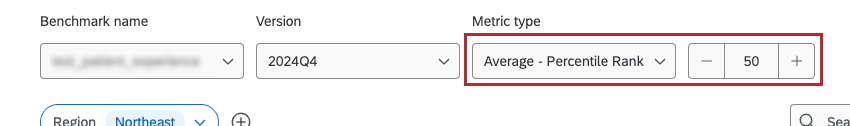
Qtip: If at least one of the metrics you selected is a percentile, a number scale will appear where you can select a number from 1 to 99. Keep in mind that not all benchmarks have percentile options.
- If desired, you can filter the benchmark by certain criteria, such as industry or country, by clicking Add filter.
Qtip: See the “Filtering Benchmarks” subsection below for step-by-step instructions.
- Use the Search to find a specific question or metric in the benchmark. The table below displays the chosen metrics for each question from the benchmark.
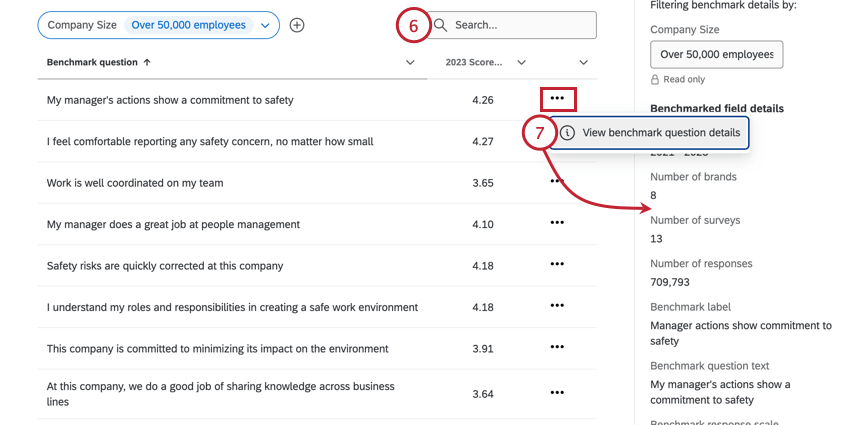
- To view a side panel with the methodology behind a specific question, click the 3 dot menu and select View benchmark question details.
Filtering Benchmarks
- Click Add filter.
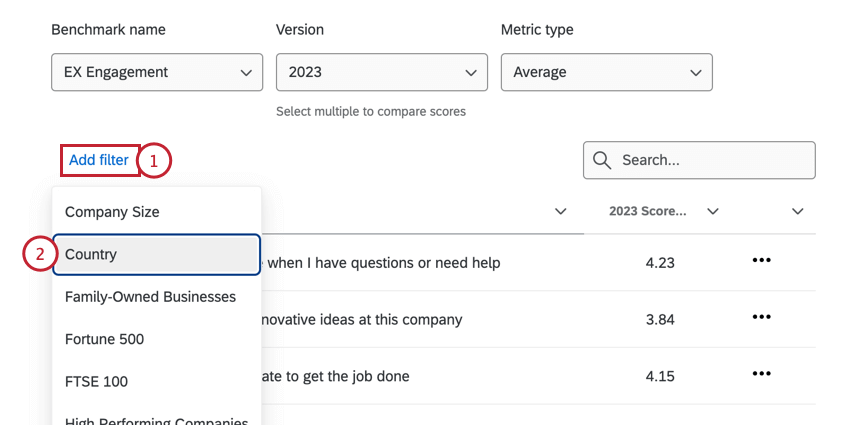
- Choose the field you’d like to filter by.
Qtip: The available filters will vary by benchmark. For example, the EX Healthcare benchmark does not contain an “industry” filter because the data is already specific to the healthcare industry.
- To change the value used in the filter, click the filter and select a new value.
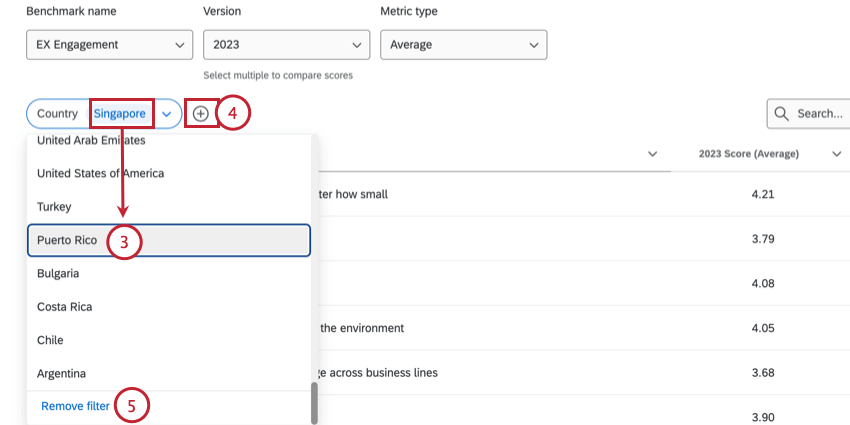 Qtip: The available filters will vary. For many benchmarks, you can only choose 1 value. However, some datasets allow you to select multiple at a time.
 - If desired, you can add another filter by clicking the plus sign ( + ).
- To delete a filter, select Remove filter from the list of filter values.
Using Premade Qualtrics Benchmarks
In the following steps, we’ll show you how to create benchmarks you can reuse across your dashboard. These benchmarks can come equipped with default page-level filters that can be used to limit their data to the most industry and regionally-relevant information.
- Go to the Benchmark editor.
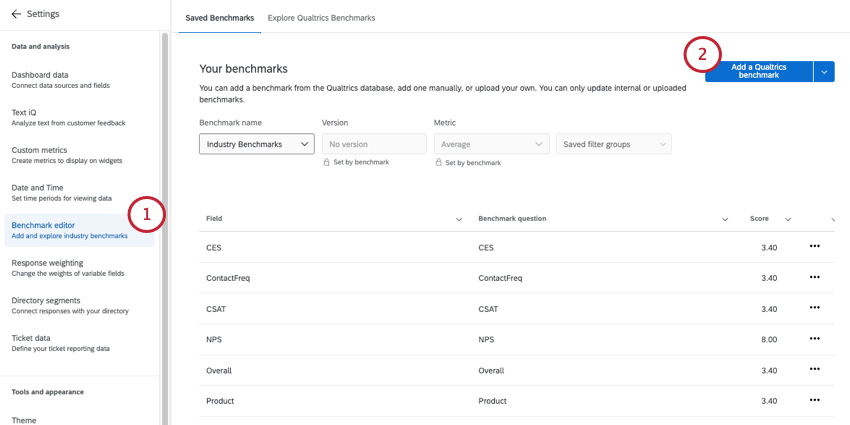
- Click Add a Qualtrics benchmark.
- Under Data source, choose from a list of benchmarks designed by our experts. See the full benchmark list.
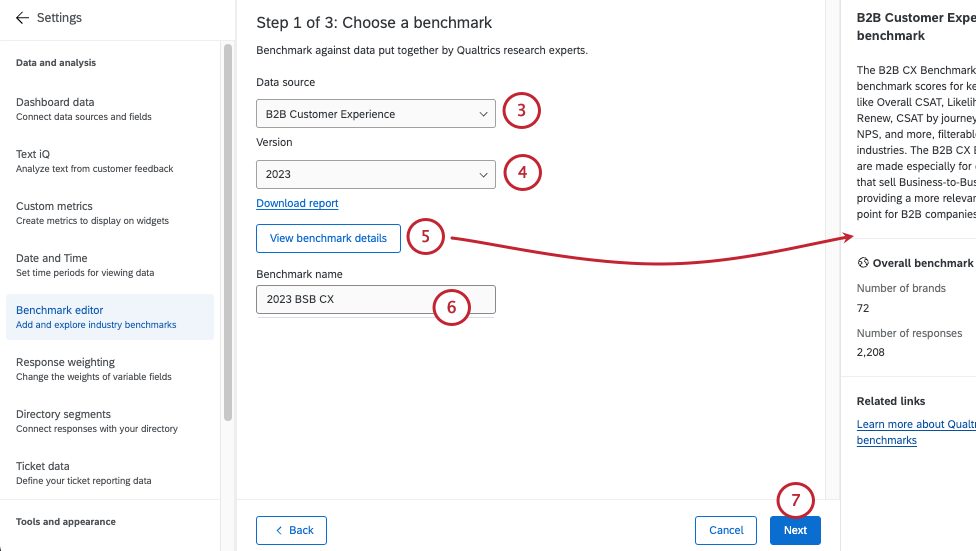
- Select a benchmark version from the Version dropdown.
Qtip: Qualtrics benchmarks are typically refreshed annually.
- Click View benchmark details to see a description of the benchmark, as well as additional details including the data and types of questions the benchmark contains.
- Name your benchmark. This is what you’ll see when you add it to a widget.
- Click Next.
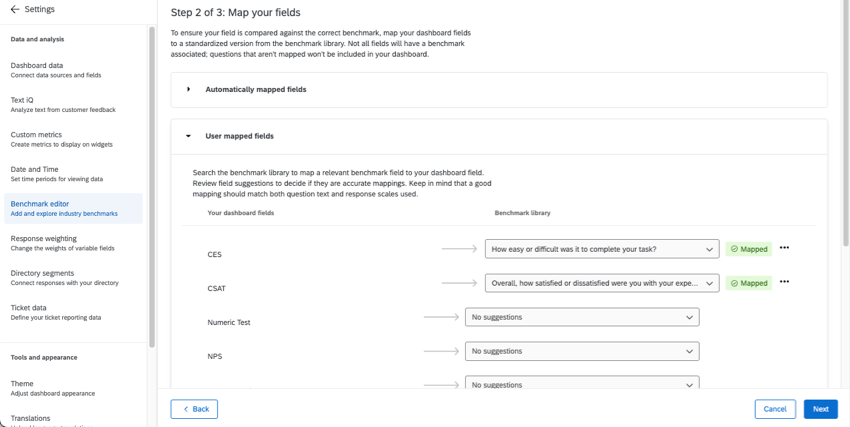
- Check the Automatically mapped fields to make sure you agree with the suggested mappings.
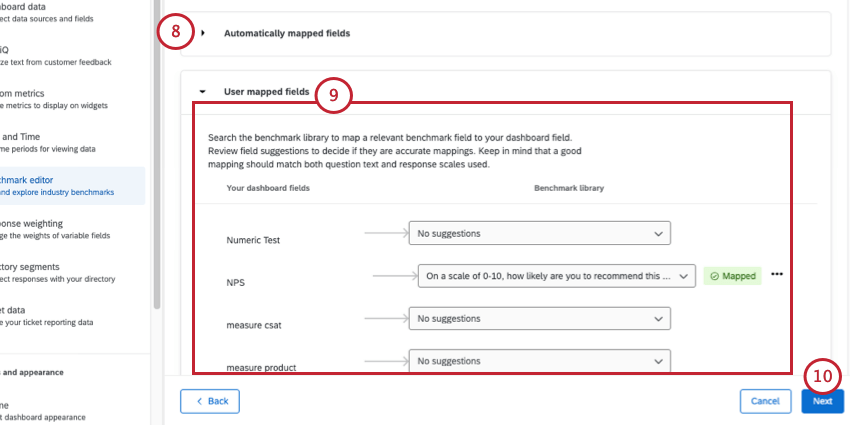 Qtip: If you use standardized fields, like certified questions, or use a recommended benchmark, some of your fields may be mapped automatically.
 - Under User mapped fields, map your dashboard fields to each benchmark field you want to use.
Qtip: There are a few field mapping requirements to consider:
- Your dashboard fields appear on the left, and benchmarks on the right.
- Each 1 benchmark should only be mapped to 1 dashboard field.
- Only number set or numeric value fields can be mapped to benchmarks or appear in the benchmark editor.
- Any unmapped benchmarks will not be added to your dashboard.
- Click Next.
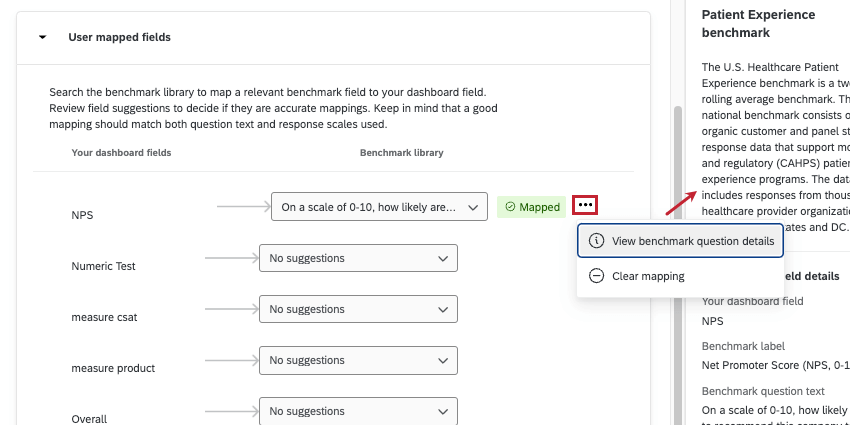 Qtip: Before you map a dashboard field to a benchmark, you can learn more about what the benchmark looks like. Knowing its scale and other information can help you match it to the correct data you’ve collected. Click the 3 dots and select View benchmark question details to see a summary of the data included in the benchmark, the response scale, and more.
 - If you have fields unmapped, you’ll have to confirm your choice.
- Each benchmark offers filter groups you can use to narrow results down to more relevant data.
Qtip: For detailed steps, see Creating Filter Groups for Benchmarks.
- Click Add to benchmarks.
Once you’ve successfully created your industry benchmarks, it’s time to add them to widgets.
AI-Powered Benchmark Recommendations
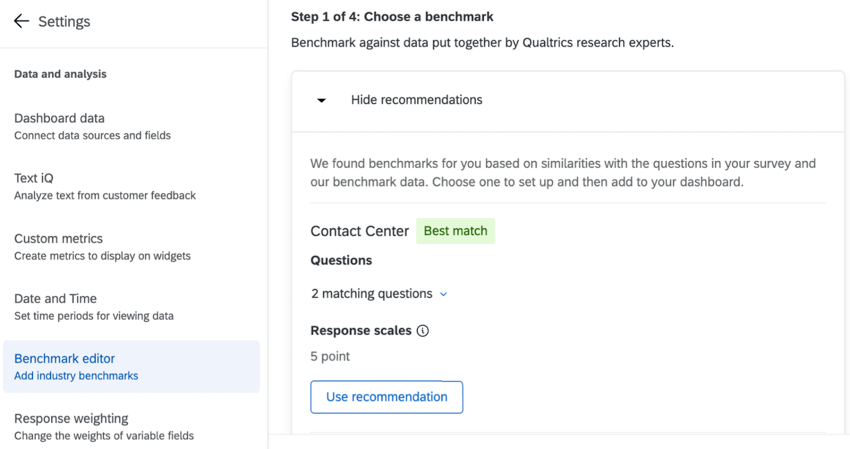
If there are questions in your dashboard that match the Qualtrics benchmark library, recommended benchmark(s) will appear as recommendations.
Select Use recommendation to create one of these benchmarks. Using a recommended benchmark will prefill many configuration options and question mapping.
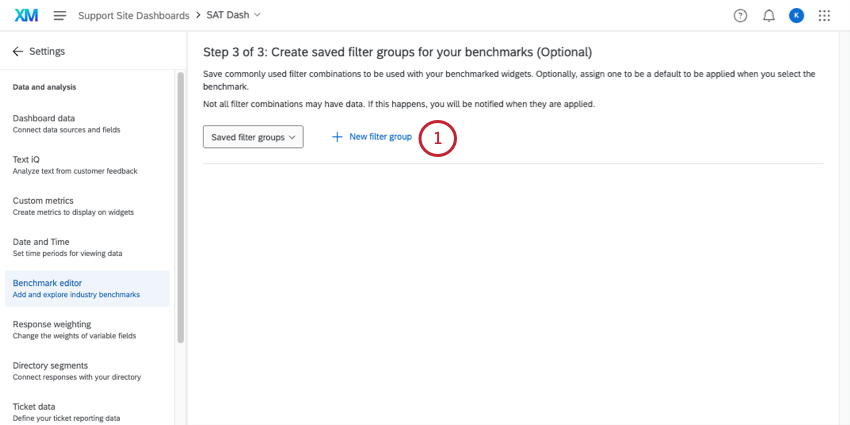
Creating Filter Groups for Benchmarks
When you use premade Qualtrics benchmarks, you can also create filters you want to use with your benchmark in widgets. These filters narrow down the data not by your dashboard fields, but by predetermined categories, like industry, region, or country. You can set a default filter that will appear with the benchmark on a specific page, or you can just save filters so they’re ready when you need them.
- Click New filter group.
- Name your filter group.
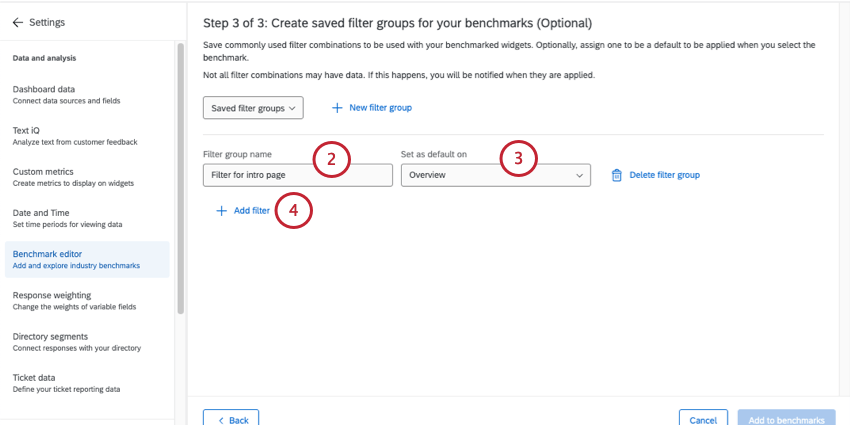
- If you’d like this filter to be applied by default to a certain dashboard page, select those dashboard pages. This step is optional.
- Click Add filter.
- Select the criteria you want to use. What’s available can vary by benchmark.
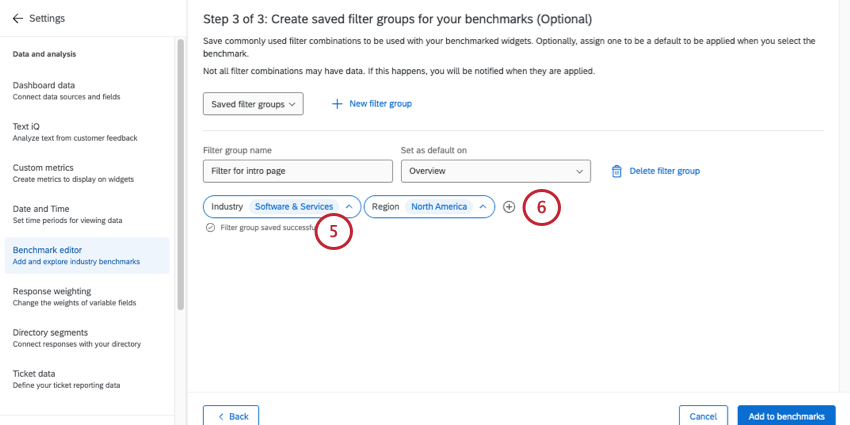
- Click the plus sign ( + ) to add more criteria.
Qtip: You can only choose 1 value for each criteria. All conditions must be met before data will be included in the filter.
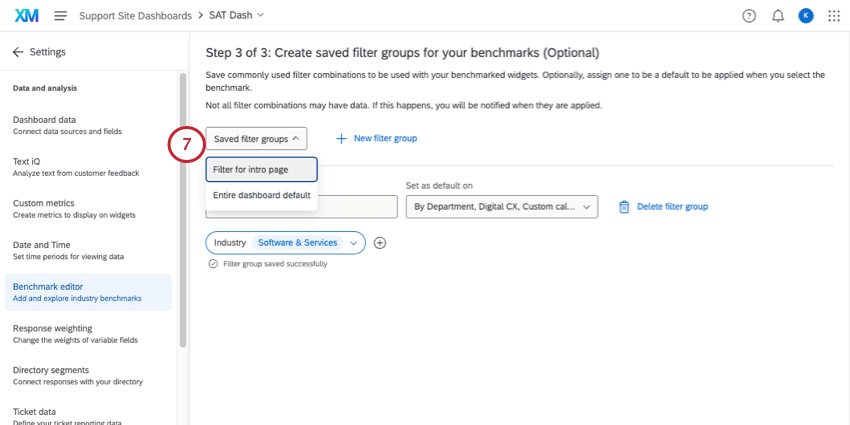
- If you create multiple filter groups, you can use the dropdown to switch between them and make edits.
Updating Qualtrics Benchmarks to New Versions
Some benchmarks have multiple years worth of data. Others will continue to be updated with new years worth of data in the future. If you’re using a benchmark that has a newer year of data available, a banner will appear notifying you, making it quicker and easier to keep your reports up-to-date with new industry standards.
- Go to the Benchmark editor.
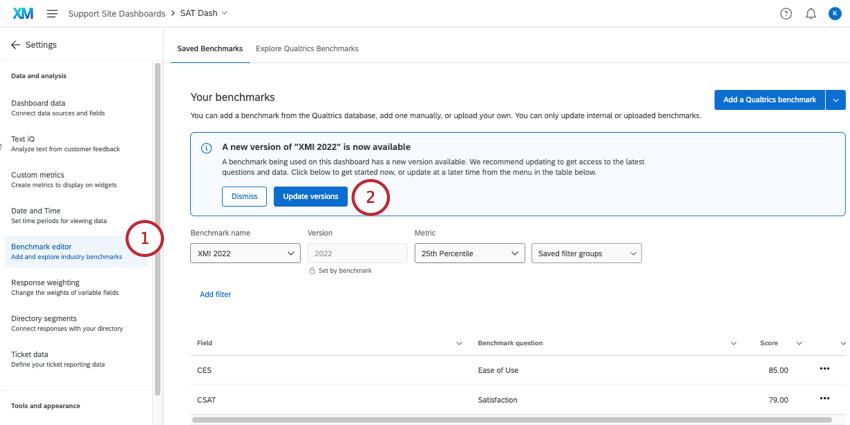
- Click Update versions.
- If you’d like to know highlights of what changed with this data, click Download report.
- Rename your benchmark.
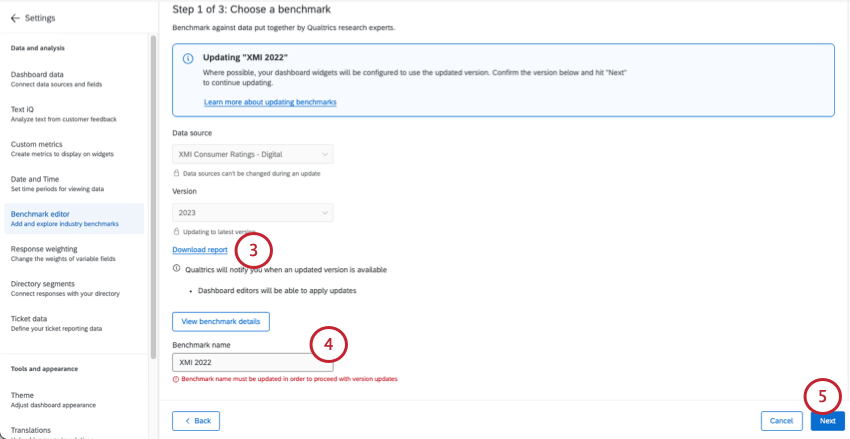
- Click Next.
- Proceed through the steps to double-check your mapped fields and filter groups.
Editing and Removing Qualtrics Benchmarks
You can edit and remove benchmarks from inside the benchmark editor.
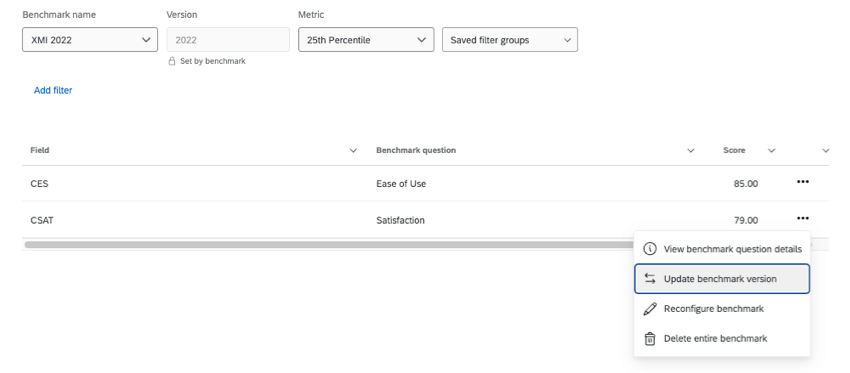
- View benchmark question details: Open a panel that shows a description of the benchmark, as well as additional details including the data and types of questions the benchmark contains.
- Update benchmark version: Only appears if your benchmark’s data is not the latest available for that series.
- Reconfigure benchmark: If you’d like to remap data or change metrics. See Creating Qualtrics Benchmarks.
- Delete entire benchmark: This option deletes the entire industry benchmark. In this example showing “XMI 2022,” the entire “XMI 2022” collection would be deleted, including both the CES and CSAT benchmarks.