-

Qualtrics Platform -

Customer Journey Optimizer -

XM Discover -

Qualtrics Social Connect
Benchmarks Basic Overview (CX)
About Benchmarks (CX)
Benchmarks are a metric standard that help you understand how your results compare against industry peers or a global average. Within CX Dashboards they can be used to establish overall customer experience, NPS, or digital experience goals based on company and industry comparisons.
Benchmarks can be created in the benchmark editor or directly inside a widget. These benchmarks can use your own company-determined goals, or they can be drawn from benchmarks developed by Qualtrics experts. Regardless, displaying benchmarks in your dashboard gives your collaborators transparency into their goals and performance. You can use benchmarks to identify gaps in performance, and make informed decisions on how your company would like to address each gap.
Opting In and Out of the New Benchmark Editor
The new benchmark editor is available for CX Dashboards and offers a number of improvements that make the overall experience easier and faster. We’ve separated out the process of choosing metrics and adding filters, which means you don’t have to make lots of separate benchmarks anymore, and can quickly grab the data you’re looking for when you set up widgets. The specific changes enabling these improvements include:
- Faster Qualtrics benchmark creation.
- Ability to adjust metrics once you add Qualtrics benchmarks to widgets.
- Industry and regional filters you can save for later or set as page defaults.
- Improved version update.
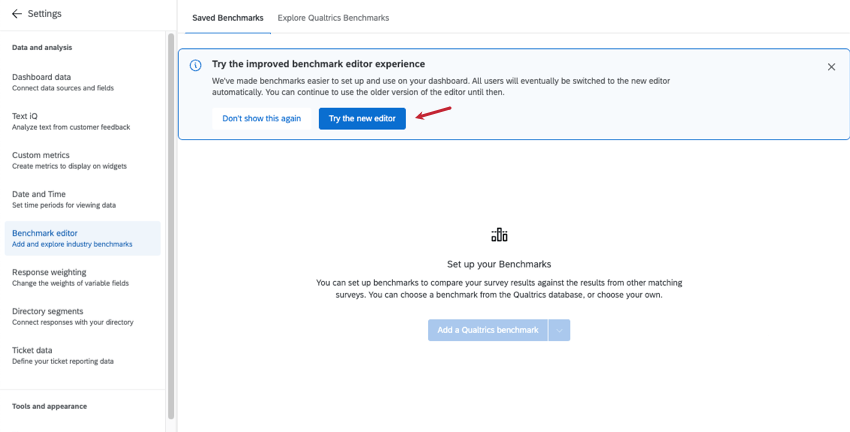
Opting Into the New Editor
Once you open the benchmark editor, you’ll see a banner at the top. Click Try the new editor to opt into the change.
To learn about the new benchmark editor, see the following support pages:
- Benchmarks Basic Overview (CX) (The page you’re currently reading)
- Using Premade Qualtrics Benchmarks (CX)
- Creating Custom Benchmarks (CX)
- Displaying Benchmarks in Widgets (CX)
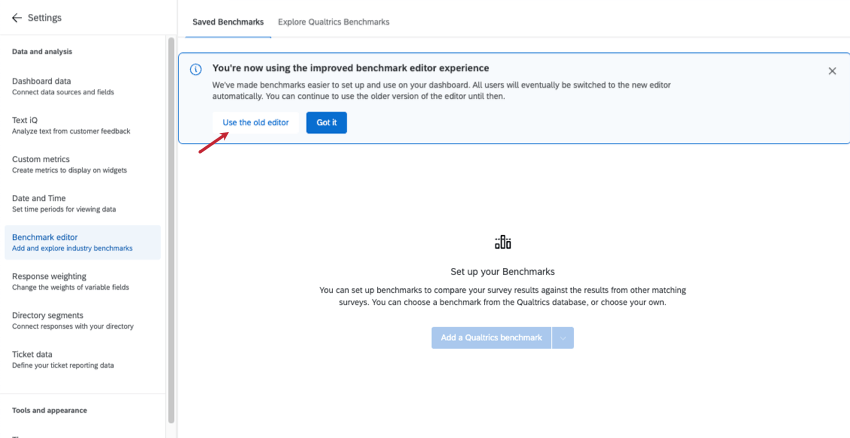
Opting Out of the New Editor
If you want to return to the old editor, click Use the old editor.
For support on the old benchmark editor:
Navigating the Benchmark Editor
The benchmark editor comes with a number of benefits, including the ability to explore industry benchmarks developed by Qualtrics research experts, upload custom benchmarks in bulk, and configure benchmarks so that they’re easy to reuse and maintain across the dashboard.
- Go to the settings of your dashboard.
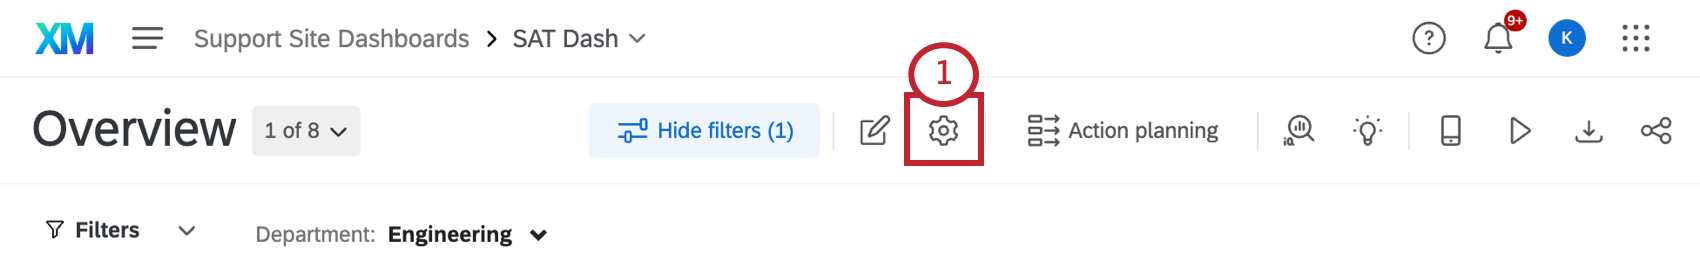
- Select Benchmark editor.
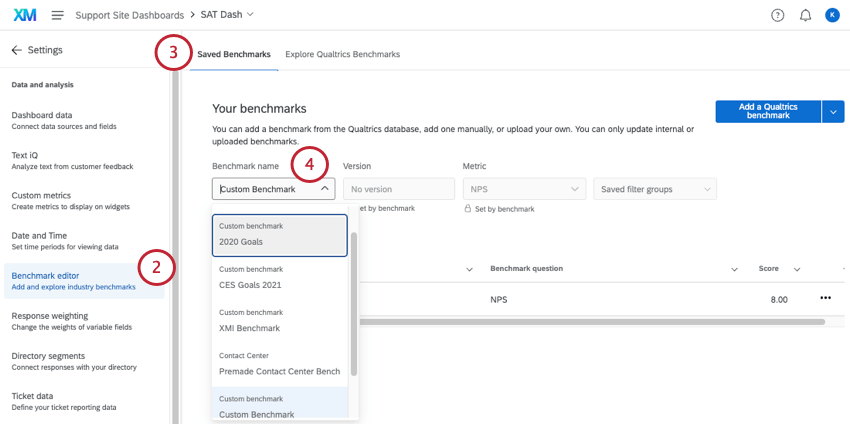
- Stay in the Saved Benchmarks tab. Here you can create:
- Under Benchmark name, you can search benchmarks you’ve created. Not all of your benchmarks will appear in the editor at once, so this filter is the fastest way to see all of the benchmarks you’ve created before. Both pre-made industry benchmarks and custom benchmarks will appear here.
Qtip: When you create a benchmark, you may map goals to multiple dashboard fields. These multiple fields within the same benchmark are the benchmark “rows.” You might have some benchmarks with only 1 row, and you might have benchmarks with multiple rows.
- Additional filters vary by the benchmark chosen.
Qtip: For industry benchmarks, see filter groups.
Custom vs. Premade Benchmarks
You can upload your own benchmark goals and match them to different KPIs in your dashboard. If your organization has already set its own targets, you probably want to add your own, custom benchmarks. For steps, see Creating Custom Benchmarks.
Qualtrics also offers ready-made benchmarks. These benchmarks were created by research experts to capture global performance in different fields, and can be a great way to calibrate your company’s performance against those in similar industries. To explore premade benchmarks Qualtrics offers, see Using Premade Qualtrics Benchmarks.
Adding Benchmarks to Widgets
Regardless of whether you created custom widgets or want to use premade data, once your benchmarks are configured in the editor, you can add them to widgets. You also have the option of creating one-time, quick benchmarks right inside widgets, without having to use the benchmark editor at all.
For steps, see Displaying Benchmarks in Widgets.
Writing Questions that Can Be Mapped to Benchmarks
When mapping your survey questions to Qualtrics benchmarks, it is important to make sure the question text and response scales you use closely match the benchmark fields to ensure valid comparisons. The following best practices should be used when creating and mapping questions to your Qualtrics benchmark fields.
Question Text
- Match the content of your question to the benchmark field you are mapping it to.
- Ensure any organization references in your question are synonymous with references in the benchmark field.
Example: If the benchmark field uses the word “department”, ensure your question uses the same word or a similar word, like “business unit” or “function”.
- Consider the level of difficulty of your questions. Choose questions that are likely to provide objective feedback instead of questions that prompt favorable responses.
- Ensure the specificity used in your question matches the benchmark field.
Example: If the benchmark field is “I receive feedback that helps me improve my performance” but your question text is “I receive ongoing feedback and coaching that helps me improve my performance”, reword your question to match the specificity of the benchmark. Using “ongoing feedback and coaching” is more specific than “feedback”, which is what the benchmark assesses.
- Ensure the qualifiers used in your question match the benchmark field.
Example: If your benchmark field is “I would recommend this company as a place to work” but your question text is “I would recommend this company as a great place to work”, reword your question to remove the qualifier “great”, as the benchmark does not include this.
- Ensure your question has the same tense as the benchmark field you are mapping it to. If a benchmark field assesses the respondent’s feelings in the present, make sure your question also asks about the present.
Example: If the benchmark field is “I am satisfied with career opportunities at this company” but your question text is “I am interested in growing my career with this company”, edit your question to match the tense of the benchmark.
- Don’t map the same benchmark field to multiple survey questions. If the same benchmark applies to multiple survey questions, the questions may be redundant. Consider combining or removing redundant questions from your survey.
Response Scales
- Use an approved response scale to ensure valid comparisons with benchmarks.
- Make sure the response scale in your question matches the response scale of your benchmark. This includes both the scale labels and the number of scale points.
Qtip: The answer choice “Don’t know/Not applicable” can also be included in the scale because it doesn’t contribute to benchmark aggregations. To exclude these answer choices from analysis see Recoding Fields (CX Dashboards) or Scales (EX Dashboards).
- Make sure the wording and sentiment of the response scale in your question matches the wording and sentiment in the benchmark.
Example: The scale Strongly disagree-Disagree-Neither agree nor disagree-Agree-Strongly agree does not match the scale Strongly Disagree-Somewhat Disagree-Neither Disagree nor Agree-Somewhat Agree-Strongly Agree.
Approved Response Scales
- Click here to view the approved response scales for different benchmark types.
- Employee Engagement Benchmarks
- 5-point Likert Scales:
- Strongly disagree-Disagree-Neither agree nor disagree-Agree-Strongly agree
- Strongly disagree-Disagree-Neutral-Agree-Strongly agree
- Very dissatisfied-Dissatisfied-Neither Satisfied nor dissatisfied-Satisfied-Very Satisfied
- Other Scales:
- I intend to keep working at this company for… (6 months or less-Over 6 months, up to 1 year-Over 1 year, up to 3 years-Over 3 years, up to 5 years-Over 5 years)
- Overall, to what extent does your experience working at this company meet your expectations? (Far below my expectations-Below my expectations-Meeting my expectations-Exceeding my expectations-Greatly exceeding my expectations)
Customer Experience Benchmarks
- NPS:
- On a scale of 0-10, how likely are you to recommend this company/product/services to a friend or relative?
- 0-10 Net Promoter® Scale (0=Not At All Likely to 10=Extremely Likely)
- XMI:
- Extremely Difficult, Somewhat Difficult, Neither Easy nor Difficult, Somewhat Easy, Extremely Easy
- Extremely Dissatisfied, Somewhat Dissatisfied, Neither Satisfied nor Dissatisfied, Somewhat Satisfied, Extremely Satisfied
- Very Unlikely, Unlikely, Undecided, Unlikely, Very Unlikely
- Contact Center Agent Performance:
- Extremely Dissatisfied, Somewhat Dissatisfied, Neither Satisfied nor Dissatisfied, Somewhat Satisfied, Extremely Satisfied
- Digital Experience Benchmarks:
- Extremely Dissatisfied, Somewhat Dissatisfied, Neither Satisfied nor Dissatisfied, Somewhat Satisfied, Extremely Satisfied
- Extremely Difficult, Somewhat Difficult, Neither Easy nor Difficult, Somewhat Easy, Extremely Easy
- Yes, No
- Patient Healthcare Benchmarks:
- 5 Point Scales:
- Not At All, A Little, A Fair Amount, Quite A Bit, A Great Deal
- Not At All Clear, Somewhat Clear, Moderately Clear, Very Clear, Extremely Clear
- Very Poor, Poor, Fair, Good, Very Good
- Very Unprepared, Somewhat Unprepared, Neither Prepared Nor Unprepared, Somewhat Prepared, Very Prepared
- Not At All Well, Slightly Well, Moderately Well, Very Well, Extremely Well, Poor, Fair, Good, Very Good, Excellent
- Very Dissatisfied, Somewhat Dissatisfied, Neither Satisfied Nor Dissatisfied, Somewhat Satisfied, Very Satisfied
- Very Unsuccessful, SomewhatUnsuccessful, Neither Successful Nor Unsuccessful, Somewhat Successful, Very Successful
- Very Difficult, Difficult, Not Easy Or Difficult, Easy, Very Easy
- 4 point scales:
- Strongly disagree-Disagree-Neutral-Agree-Strongly agree
- Never, Sometimes, Usually, Always
- Definitely No, Probably No, Probably Yes, Definitely Yes
- 3 point scales with N/A
- Yes, Definitely, Yes Somewhat, No
- 2 point Scales with N/A
- Yes, No
- 5 Point Scales:
- 5-point Likert Scales: