
Drill Down Hierarchies for CX Dashboards
What's on this page
About Drill Down Hierarchies
When sharing a CX Dashboard, different teams and users may want different access depending on their role within a hierarchy. For example, you might run CSAT or NPS surveys every time a customer speaks to one of your agents, and then collect that data in a dashboard. You then may want to share that data with the agents themselves, their team leads, and their managers.
But each of these roles needs different access to the dashboard data. An agent should probably only see their own data, but the manager would want to see all data from their organization. The team lead would want to be able to see their own data as well as their agent’s data, and to compare their team to the organization as a whole; but a team lead should not be able to view other team leads’ data.
A hierarchy can be built for your dashboard with metadata, roles, and drill downs. Note that these hierarchies only apply to survey data as it appears in the dashboard, and cannot be used elsewhere in the platform.
Qtip: This support page is about CX Dashboards. It is unrelated to hierarchies in Employee Engagement. To learn more about Employee Engagement hierarchies, see the Employee Engagement Participant support pages.
Defining a Hierarchy
The first step to setting up drill down hierarchies is to determine your dashboard’s hierarchy. It helps to list who you plan on giving dashboard access, their teams, and their roles in the company. For this support page, we’re going to use the following example:
- Barnaby Smith is a manager over two teams.
- Team 1 is comprised of two agents: Mary Shelley and Stephen King.
- Team 1’s team lead is Bram Stoker.
- Team 2 is comprised of two agents: Charlotte Bronte and Emily Bronte.
- Team 2’s team lead is Jane Austen.
Collecting Survey Data
The next step to setting up a drill down hierarchy is to ensure that when collecting data on how your agents performed, you don’t just want to tag the correct agent on the response, but also the agent’s team lead and manager.
For our example, you would need to include the following embedded data elements at the top of your survey flow:
- Manager
- Team Lead
- Agent
Example: Stephen King is an agent on Team 1. His Manager is Barnaby Smith, his Team Lead is Bram Stoker, and his Agent is Stephen King. If a respondent were to rate their interaction with Stephen, their response report would look like this:
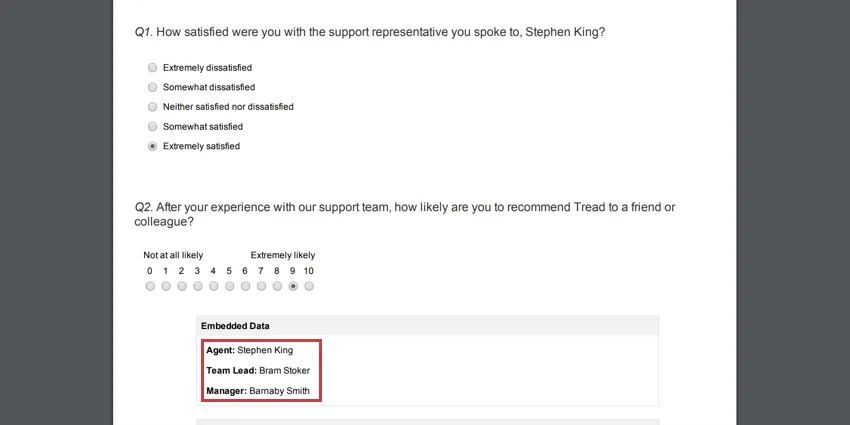
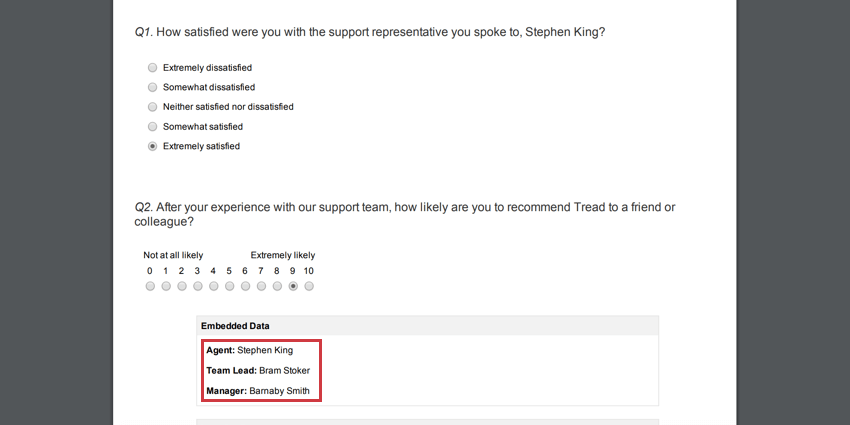
Qtip: The easiest way to set the values for a survey respondent’s embedded data is to use a contact list. The survey’s embedded data elements will read the values saved in the list when you email surveys, send personal links, or have respondents authenticate using the contact list. You can also use query strings to pass this information through a URL.
Qtip: You don’t have to use Manager, Team Lead, and Agent. If you prefer to organize by team, assign an ID to each agent, or even construct a longer hierarchy, that is fine. This example is just the most common setup.
Using a CSV as a Dashboard Source
Sometimes you may want to use Imported Data as a CX Dashboard Source. When uploading your respondents’ data into the dashboard, make sure you include Manager, Team Lead, and Agent columns on each response.
To continue using the agents from the hierarchy we created earlier:
| Subject of the Response | Manager | Team Lead | Agent |
|---|---|---|---|
| The CSAT or NPS score the customer gave Mary Shelley | Barnaby Smith | Bram Stoker | Mary Shelley |
| The CSAT or NPS score the customer gave Stephen King | Barnaby Smith | Bram Stoker | Stephen King |
| The CSAT or NPS score the customer gave Charlotte Bronte | Barnaby Smith | Jane Austen | Charlotte Bronte |
| The CSAT or NPS score the customer gave Emily Bronte | Barnaby Smith | Jane Austen | Emily Bronte |
Setting Up Roles
Navigate to the Roles section of the User Admin tab.
We are going to create a role for each level of access we want users to have, but not each team. In this example, we have a manager (Barnaby), team leads (Bram and Jane), and agents (everyone else). So in the screenshot below, we made roles called Manager, Team Lead, and Agent.
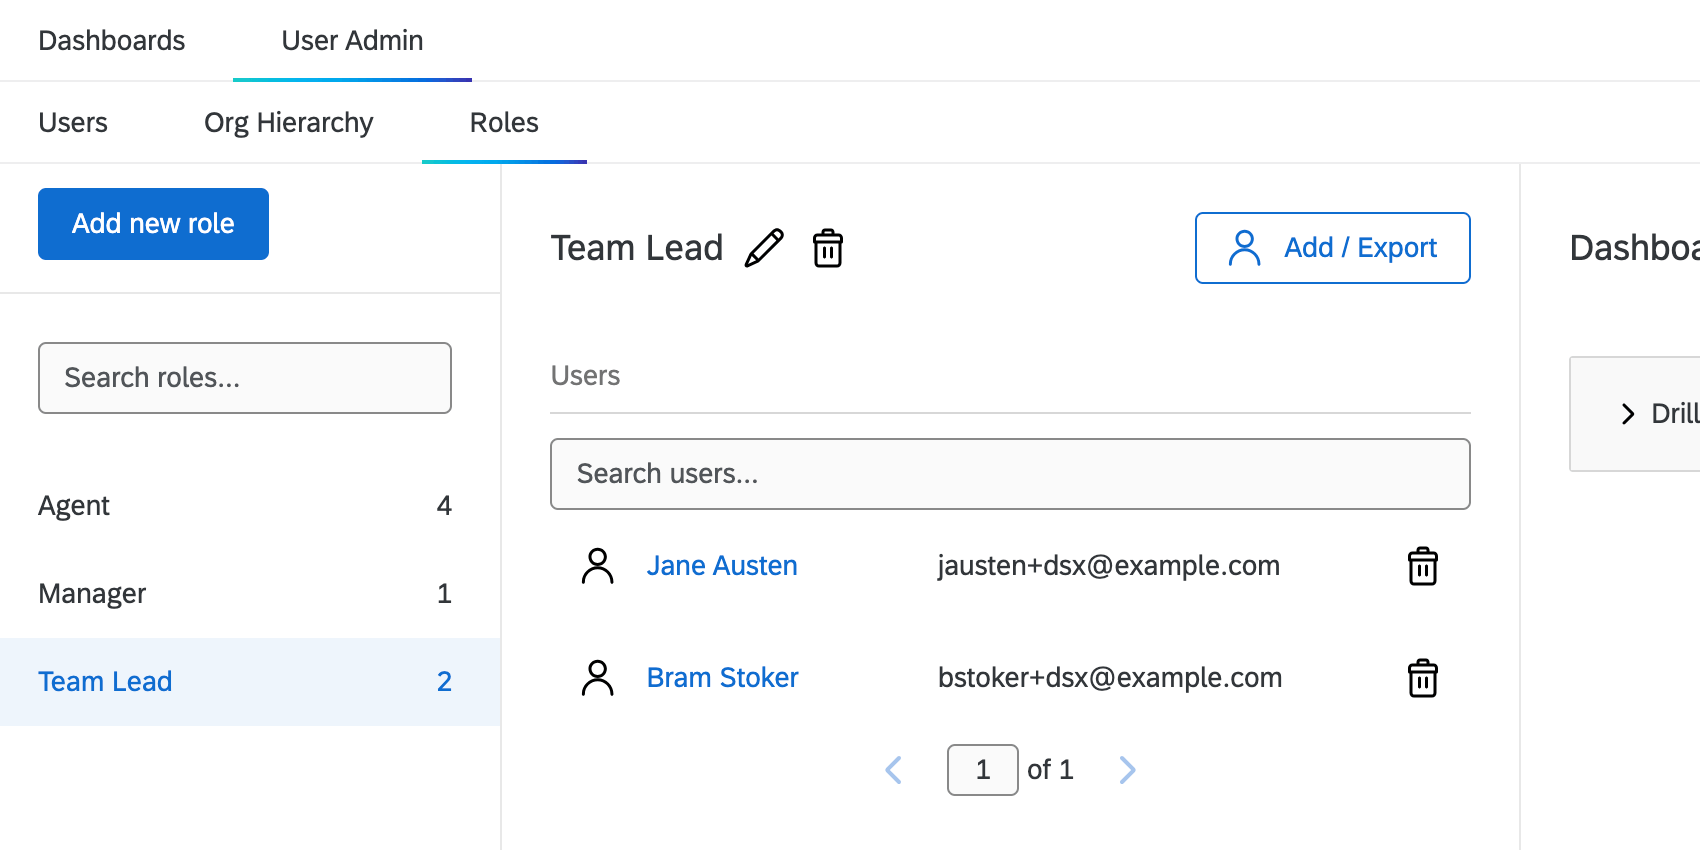

Even though Bram and Jane belong to two different teams, we are going to add them both to the Team Lead role because they are both leads of their respective teams. Their rank / level in the team, not the team itself, is the basis of the role.
Qtip: You do not need to add the desired dashboard(s) to the role. The setup described on this page overrides the need to add a dashboard.
Defining Metadata
The next step is to define metadata. This allows us to determine what data each dashboard user will have access to.
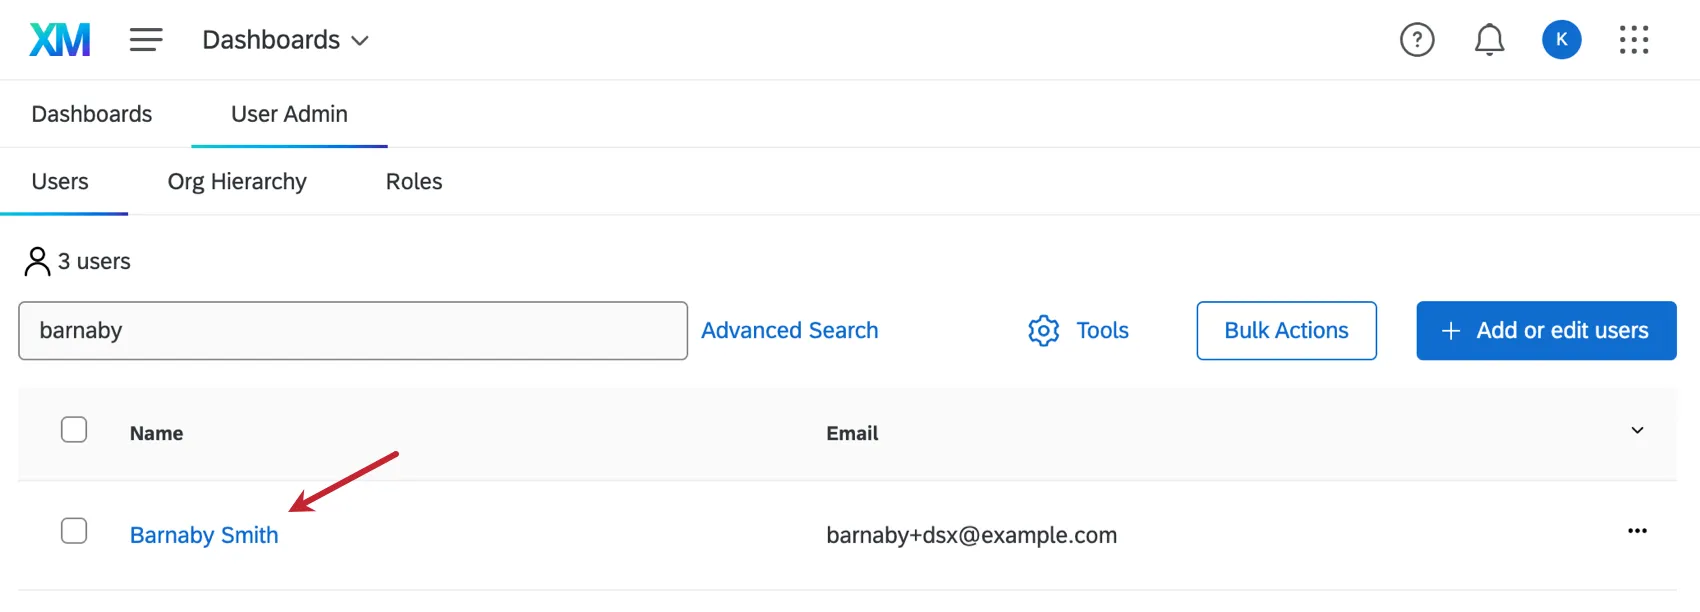
To start, navigate to the Users section of the User Admin tab.
Attention: When there are changes to your hierarchy, be sure to add a value to the metadata using two colons ( :: ). This way the user has access both to historical and new data. For example, If Mary’s team lead changes from Bram Stoker to H.P. Lovecraft, her Team Lead metadata would be equal to Bram Stoker :: H.P. Lovecraft.
Managers
Search for the manager first, and click on his or her name.
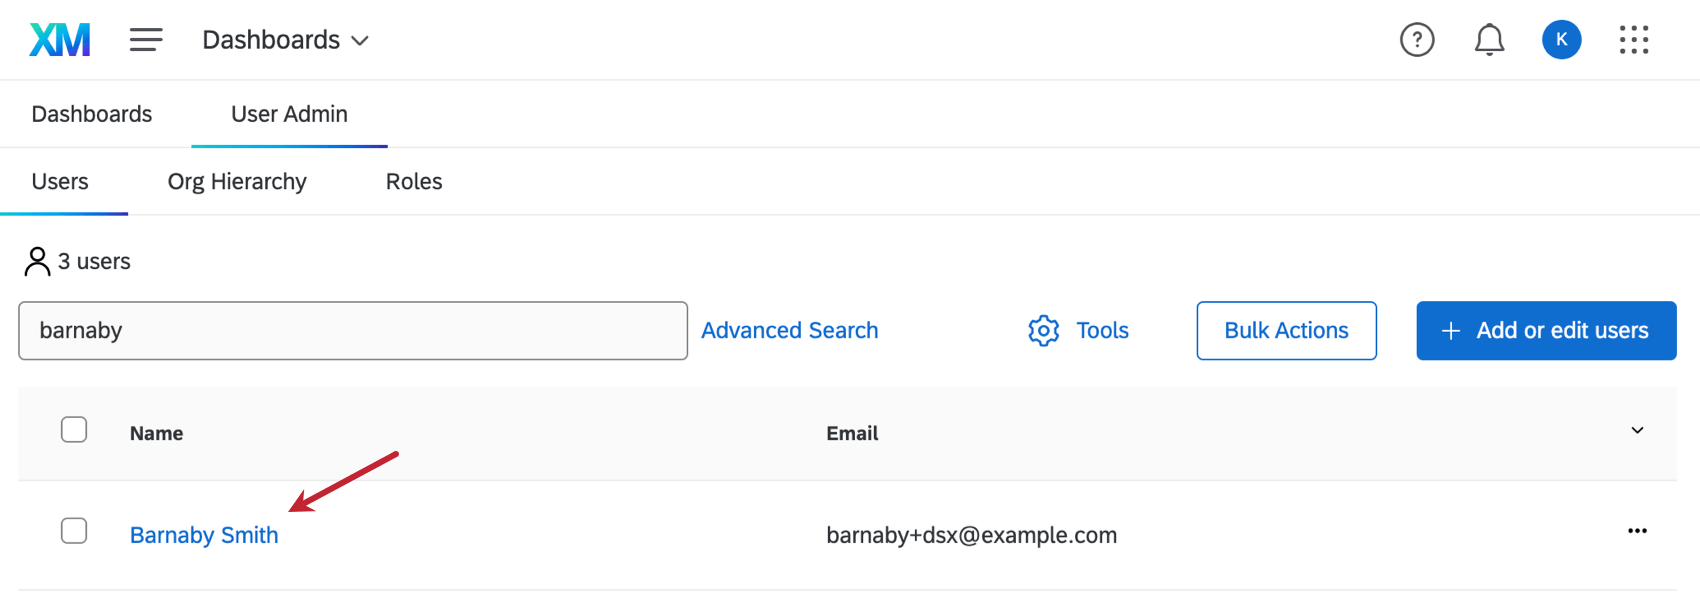
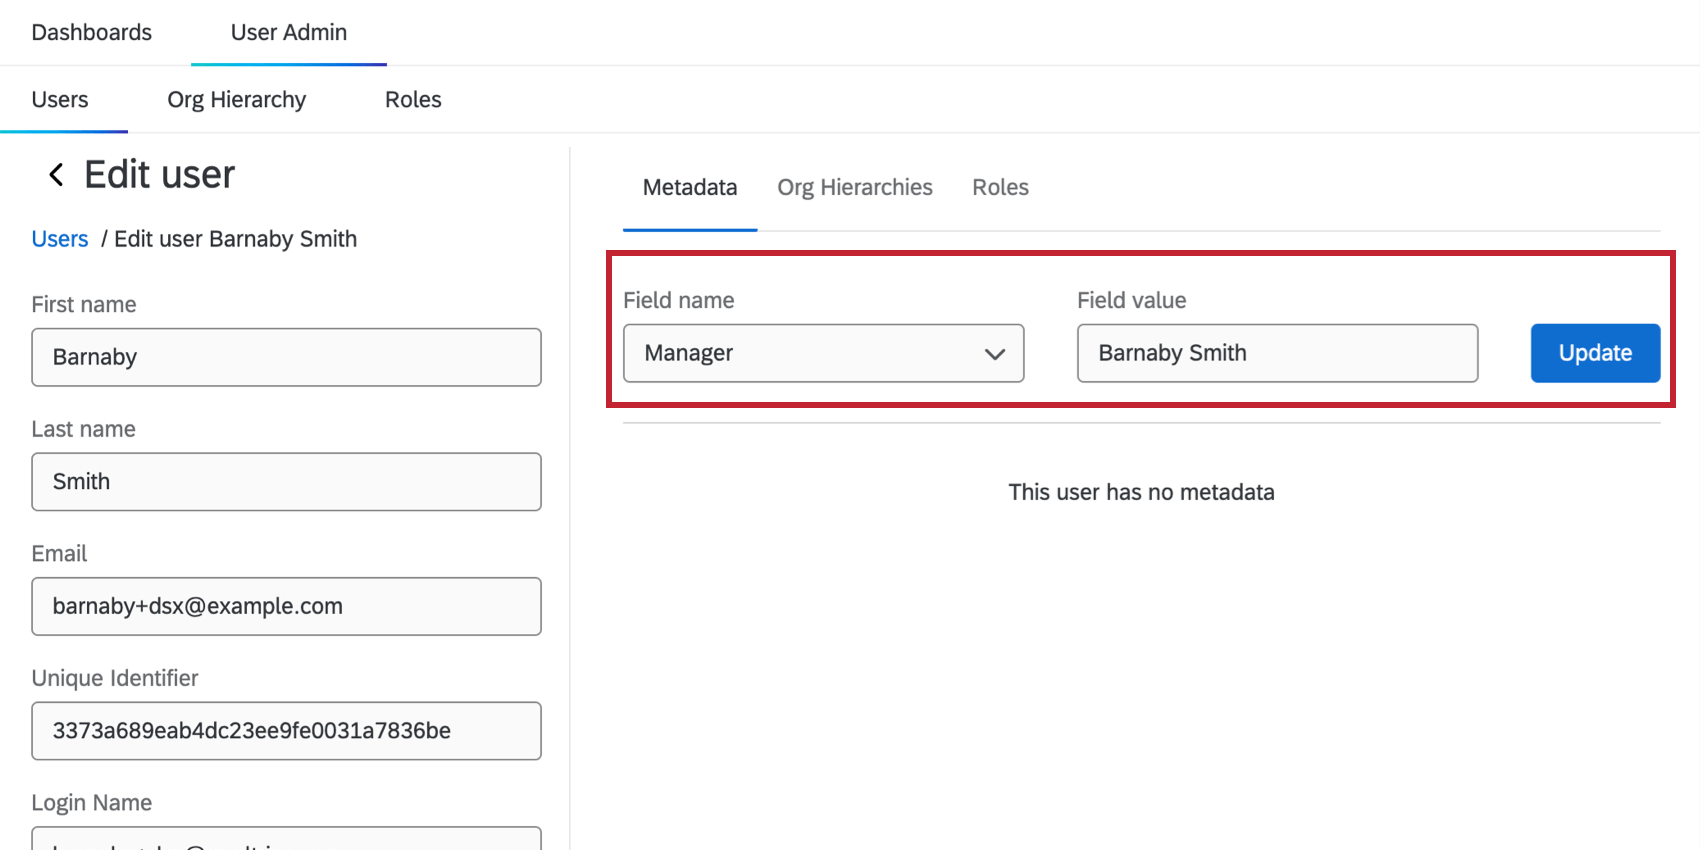
In the Metadata tab, add a new metadata called Manager. Set the value equal to the manager’s name. Click Update to save changes.
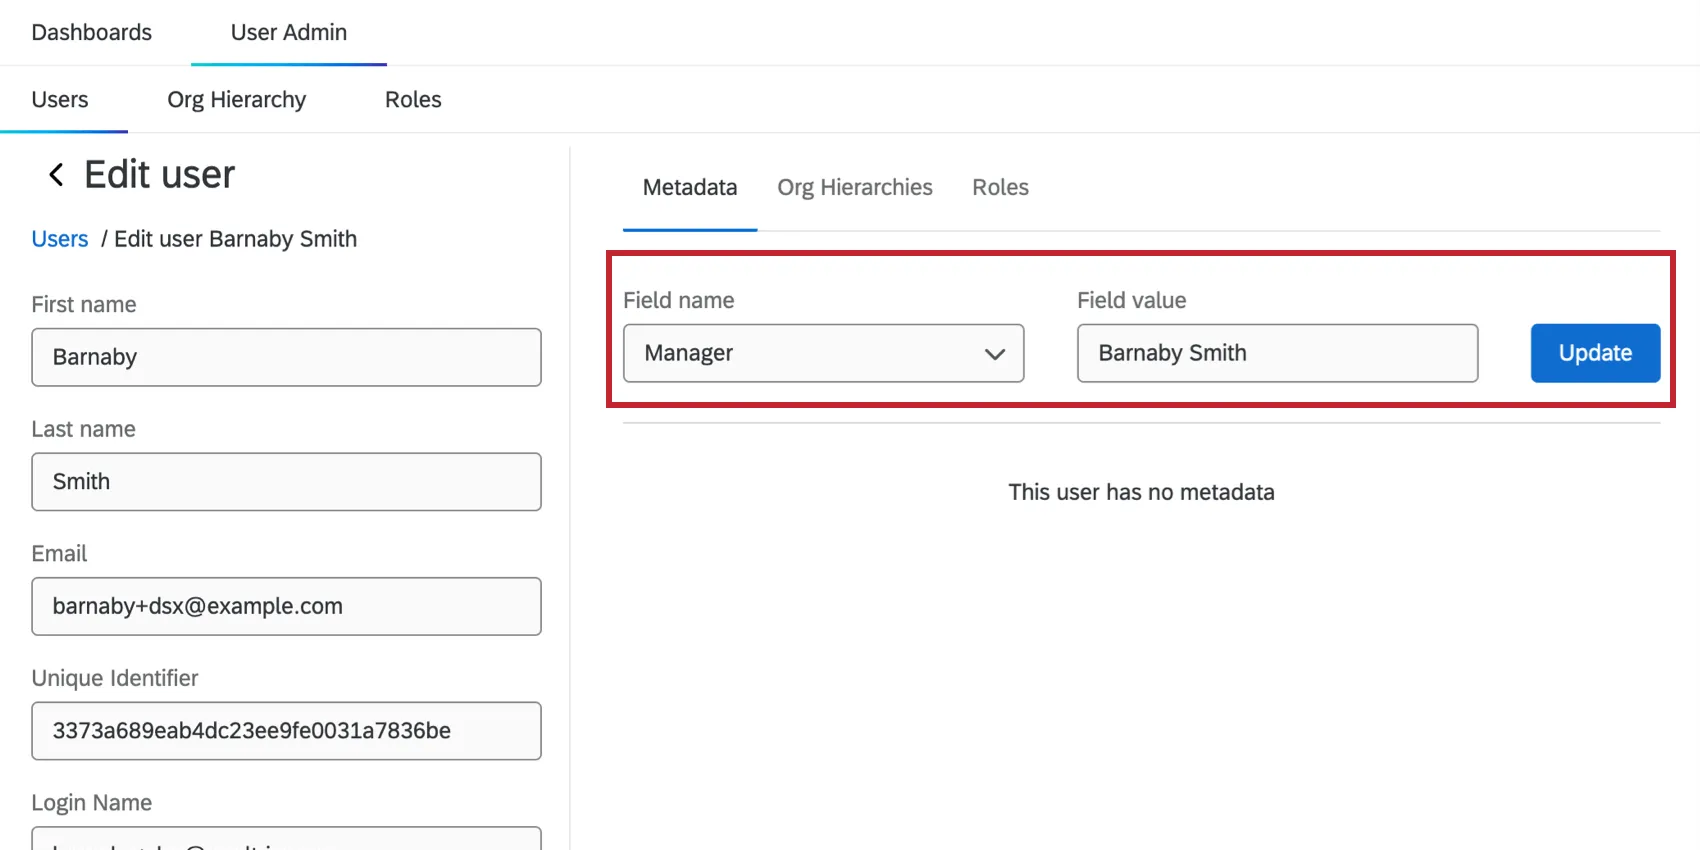
Qtip: Remember, metadata must match embedded data in the survey! Make sure you use the same spelling and capitalization throughout this project setup.
Team Leads
Search for a Team Lead. Add the metadata Manager and Team Lead.
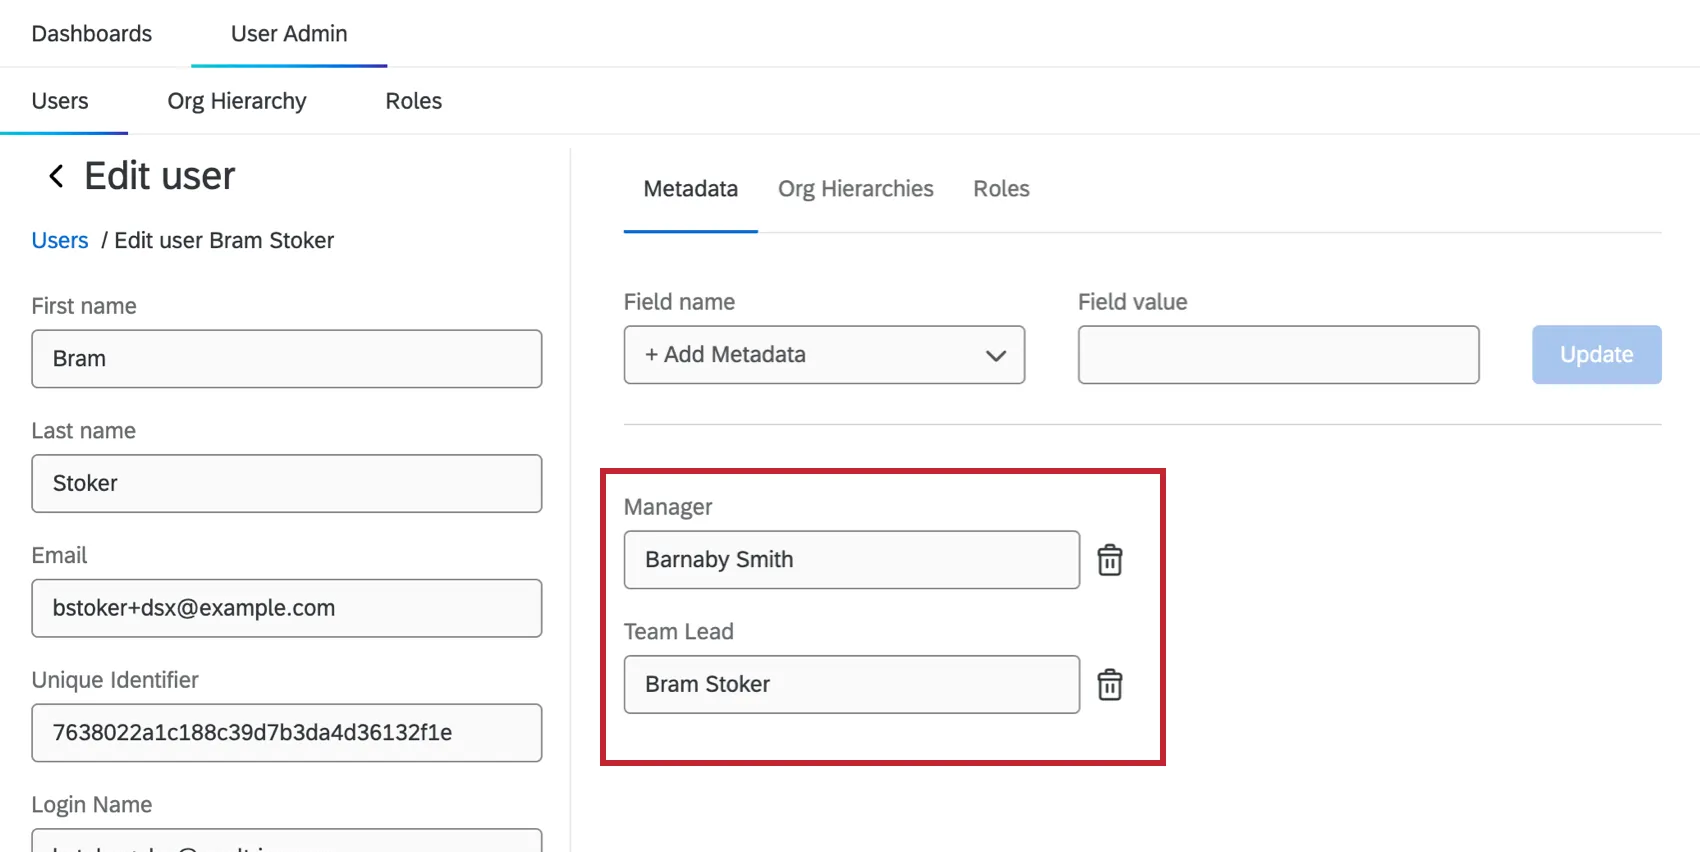
Set Manager equal to their manager’s name. Then set Team Lead equal to the team lead’s own name.
Agents
Search for an agent. Add the metadata Manager, Team Lead, and Agent.
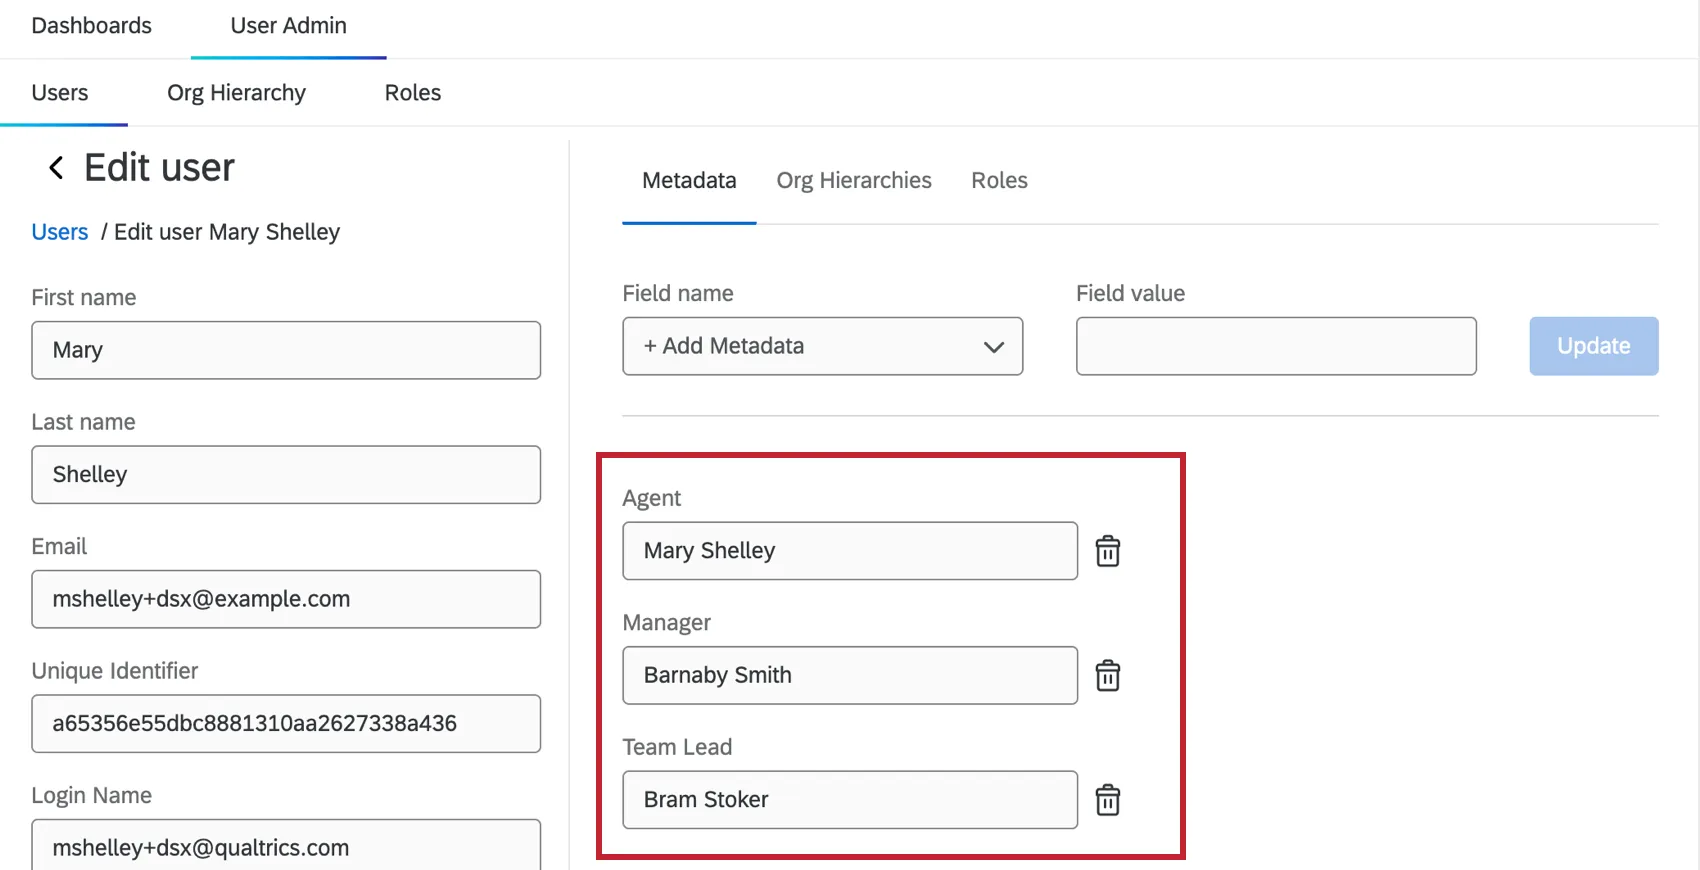
Set Manager equal to their manager’s name and Team Lead equal to their team lead’s name. Then set Agent equal to the agent’s own name.
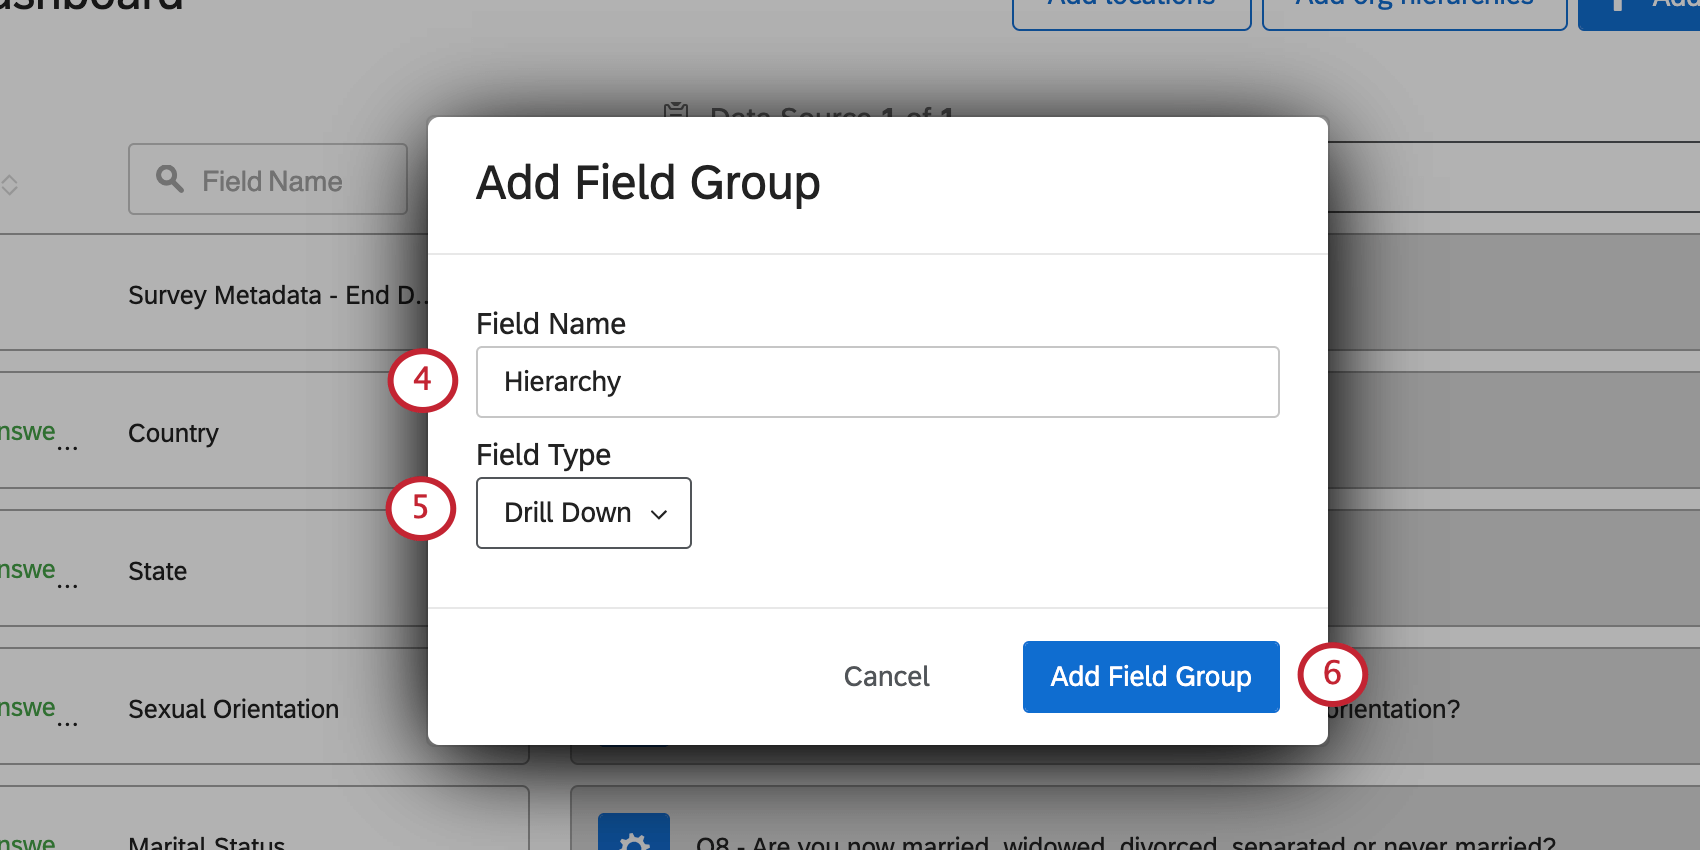
Now we’re ready to map the data into a drill down on the dashboard’s Dashboard Data.
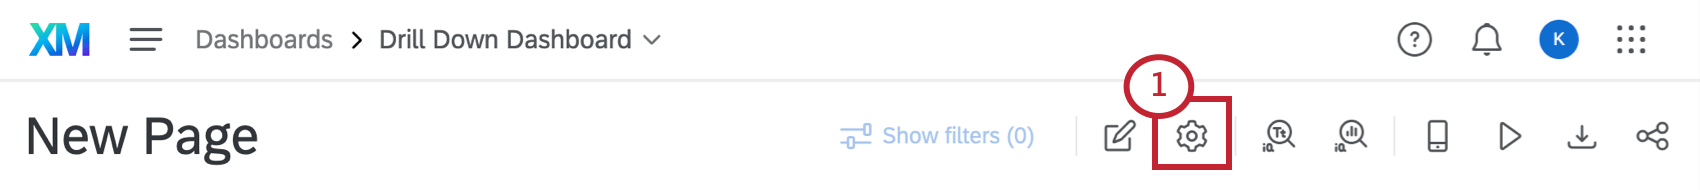
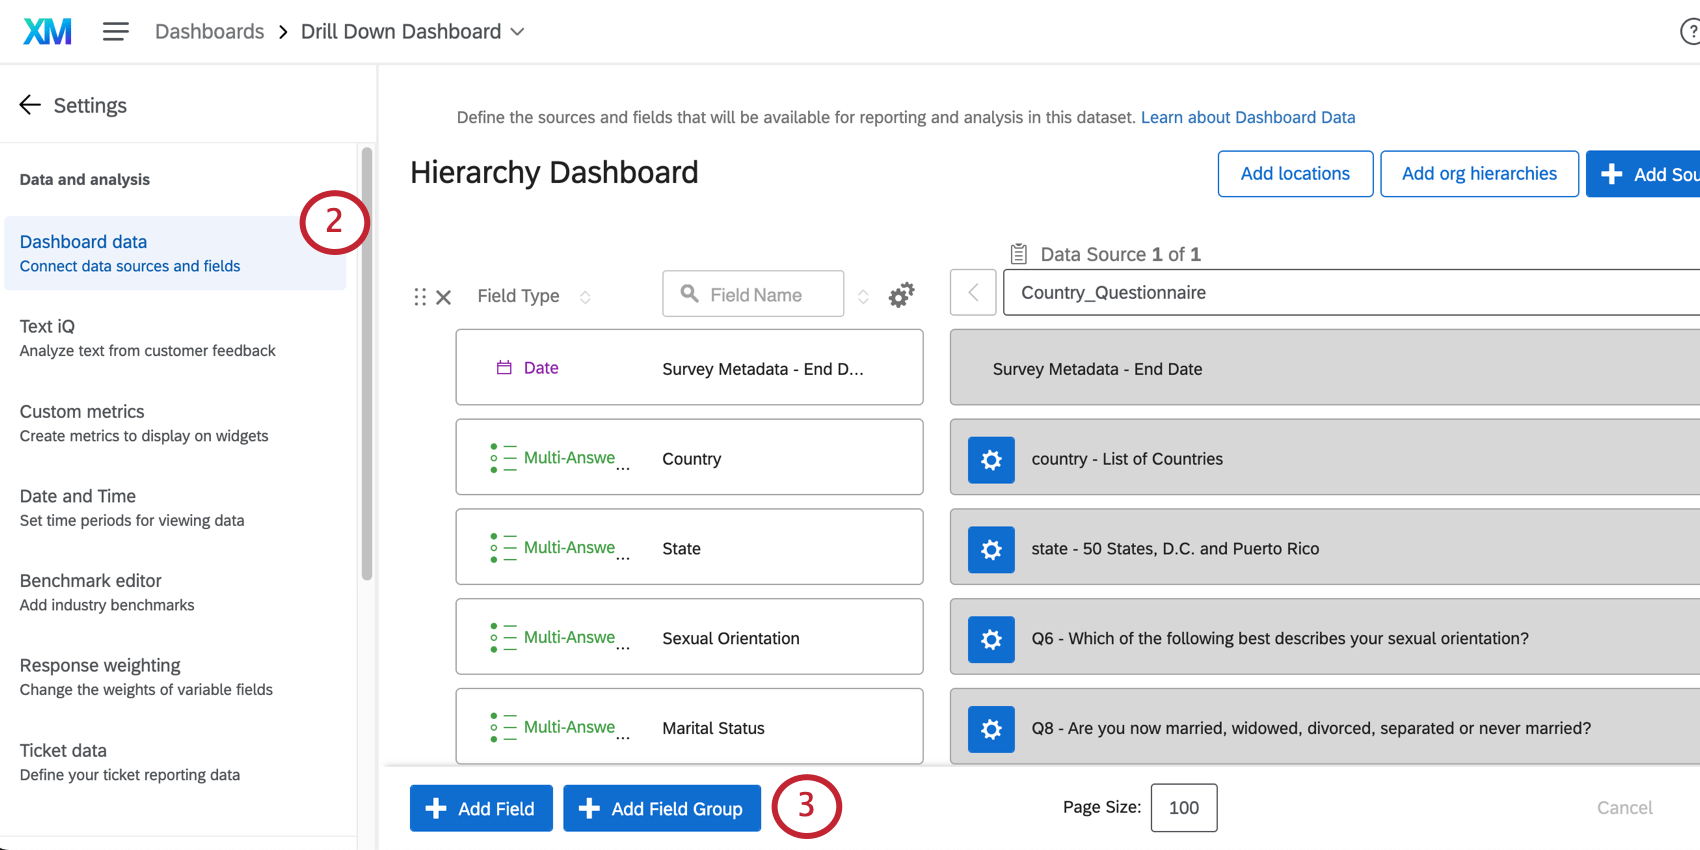
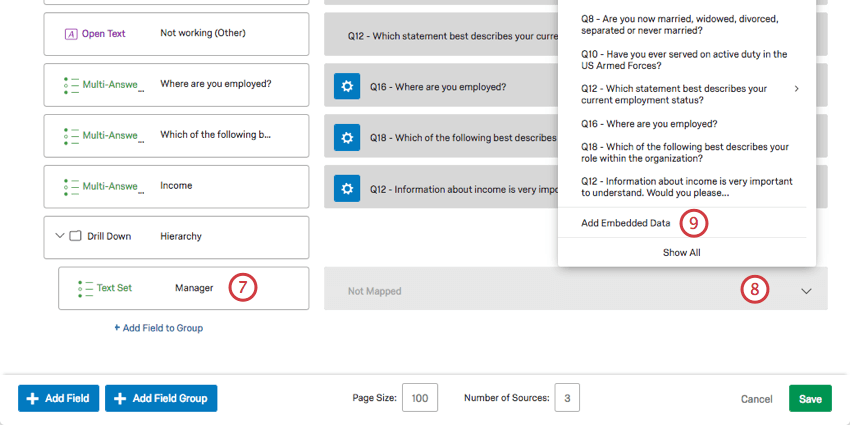
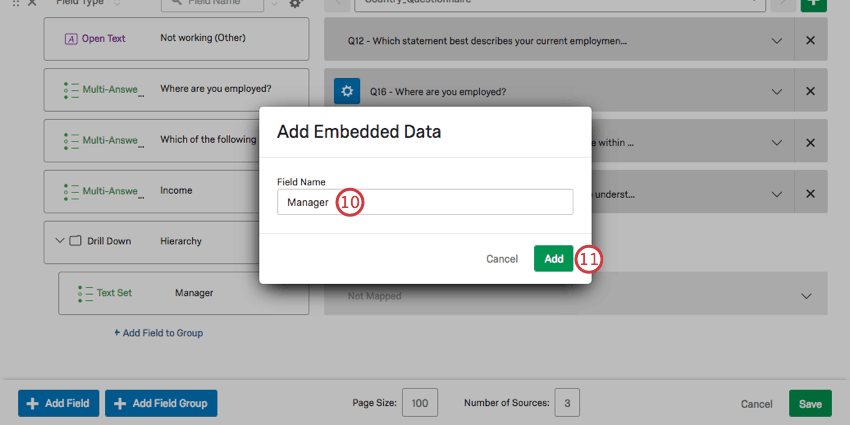
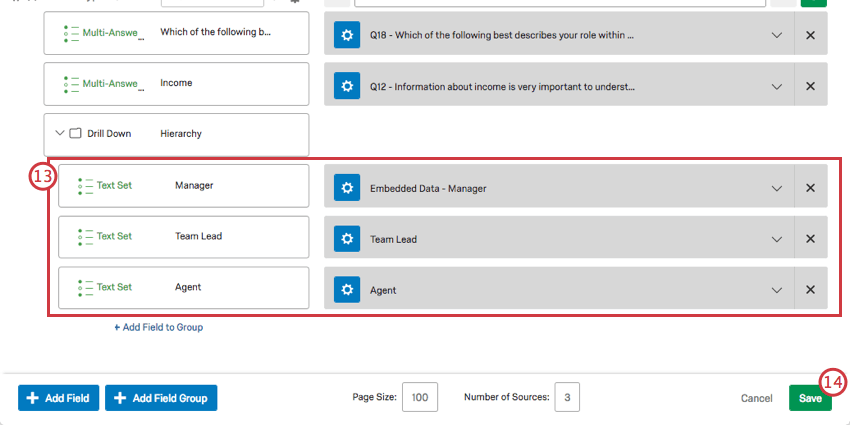
Dashboard Data
This step will bring the hierarchy we’ve created into the dashboard, so it can be later used in filters.
Configuring Dashboard Filters
Now that the hierarchy is mapped in the dashboard, we can configure the filters. Note that while this helps to ensure that only certain data comes through when each user visits the dashboard, it is not the final step.
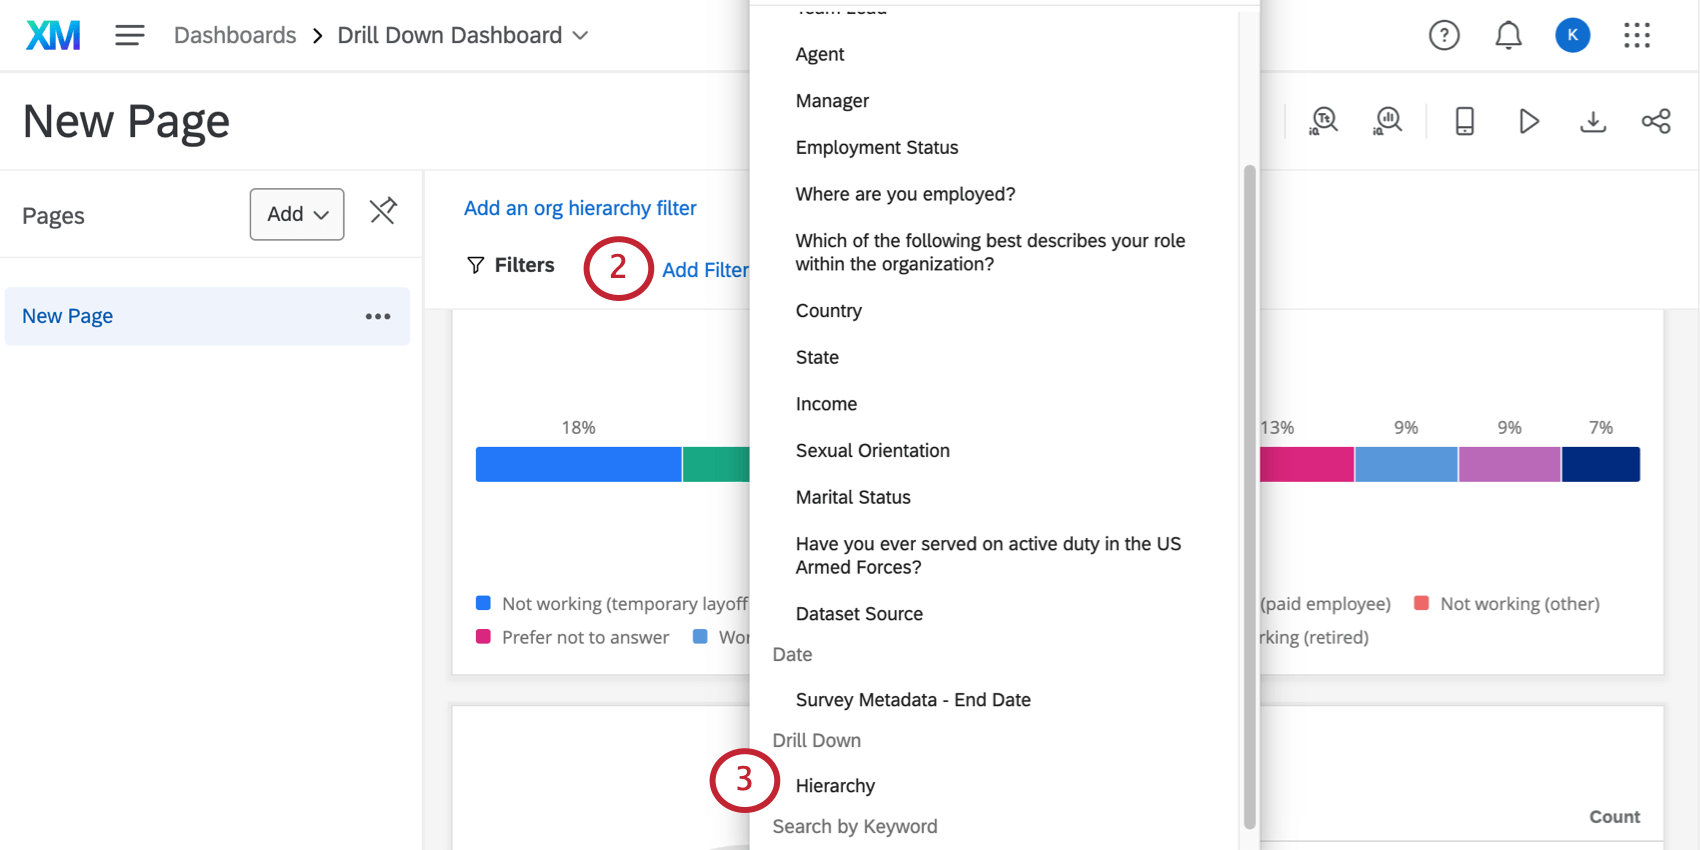
Adding the Filter
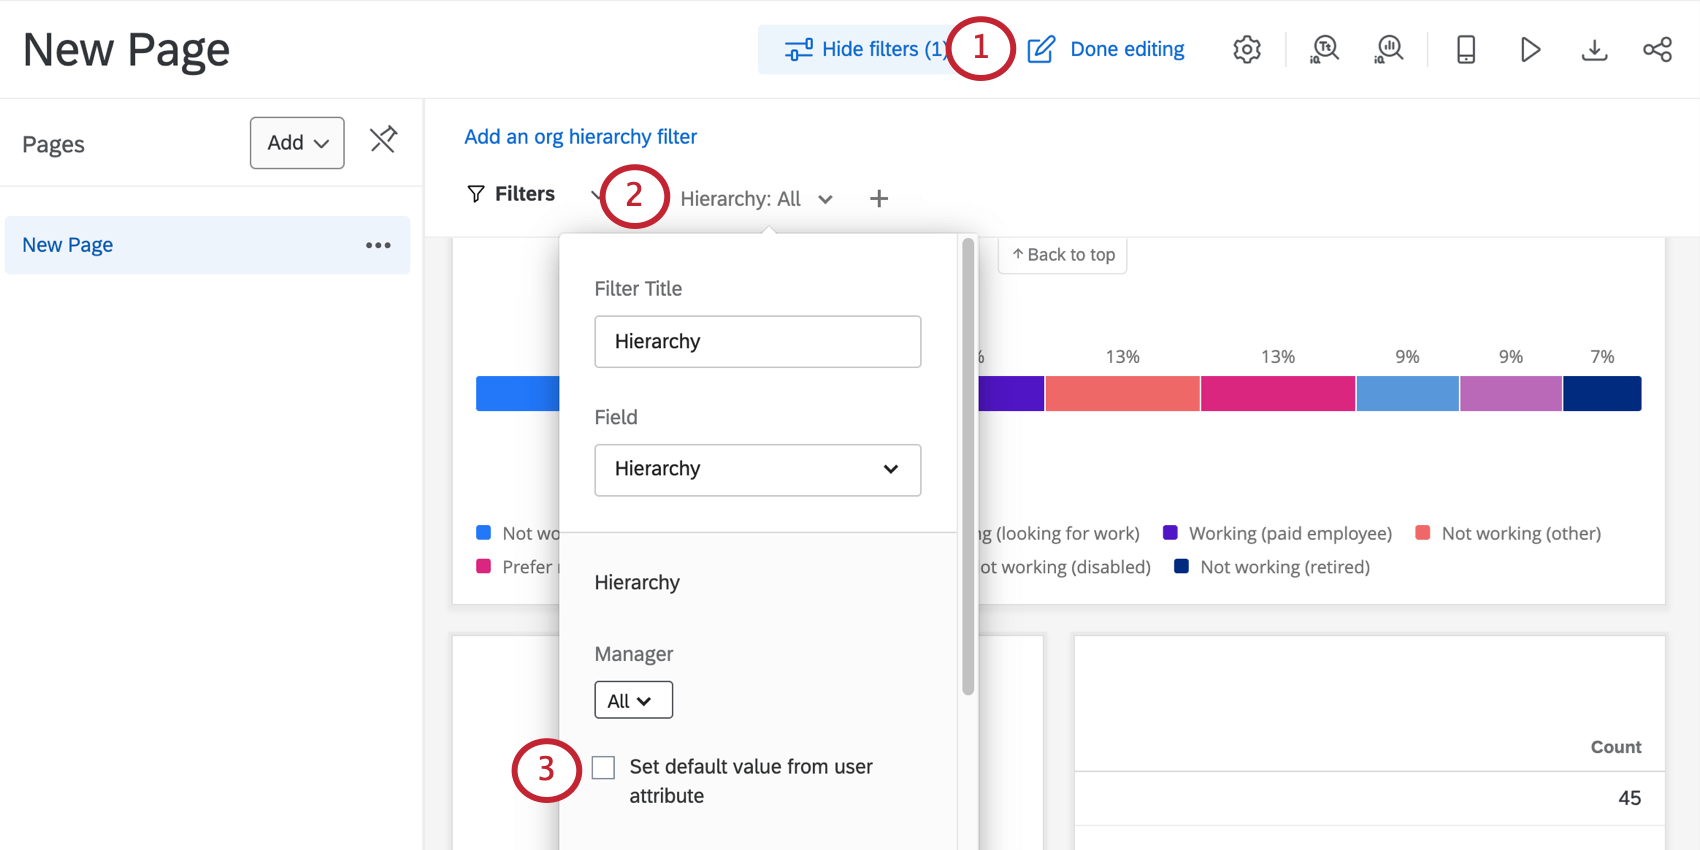
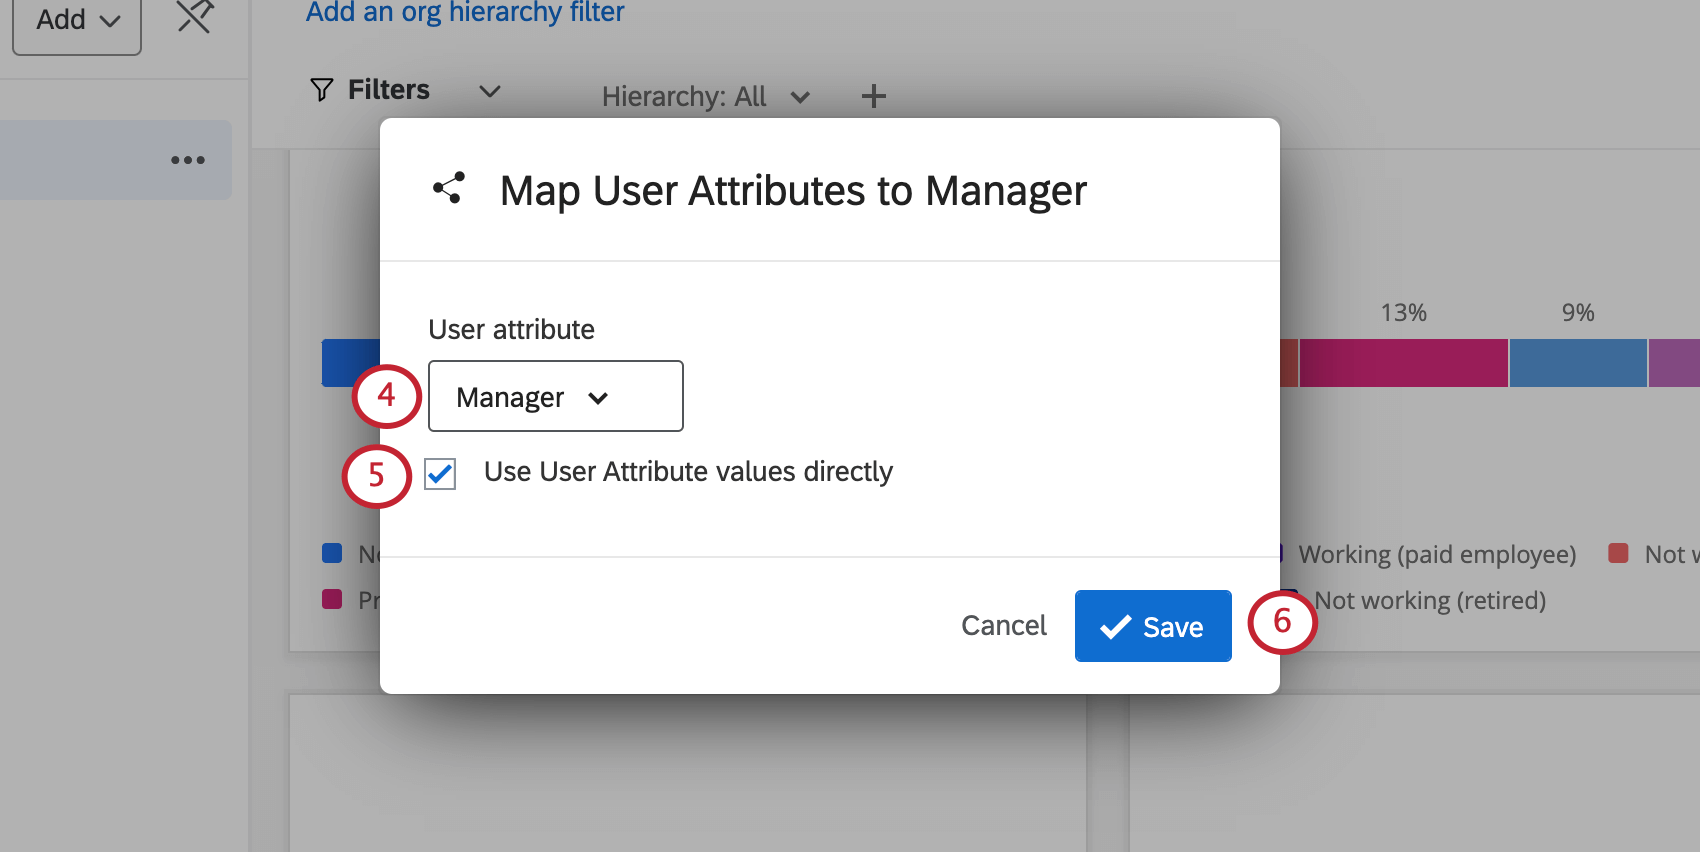
Setting Default Attributes
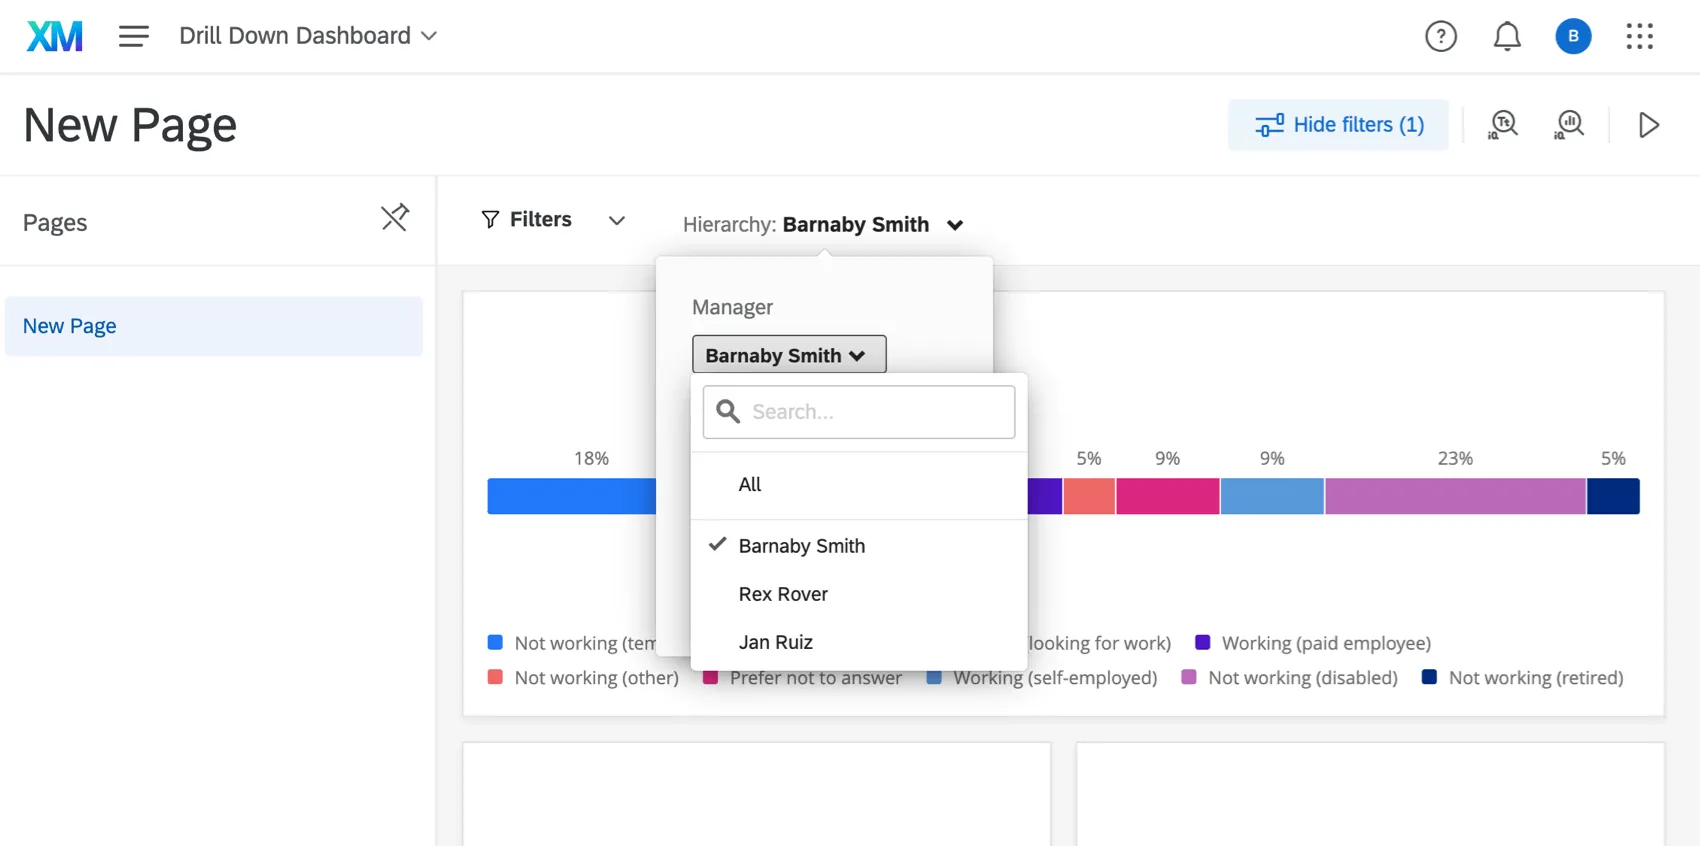
While in our example scenario we want the manager to be able to filter for all the data, when they first log in, they probably just want to see their own team’s data. The following steps will ensure manager’s see team data by default.
When Barnaby visits the dashboard, it will default to his teams’ data. However, he can view another manager’s data if he likes, or select All to see global NPS data.
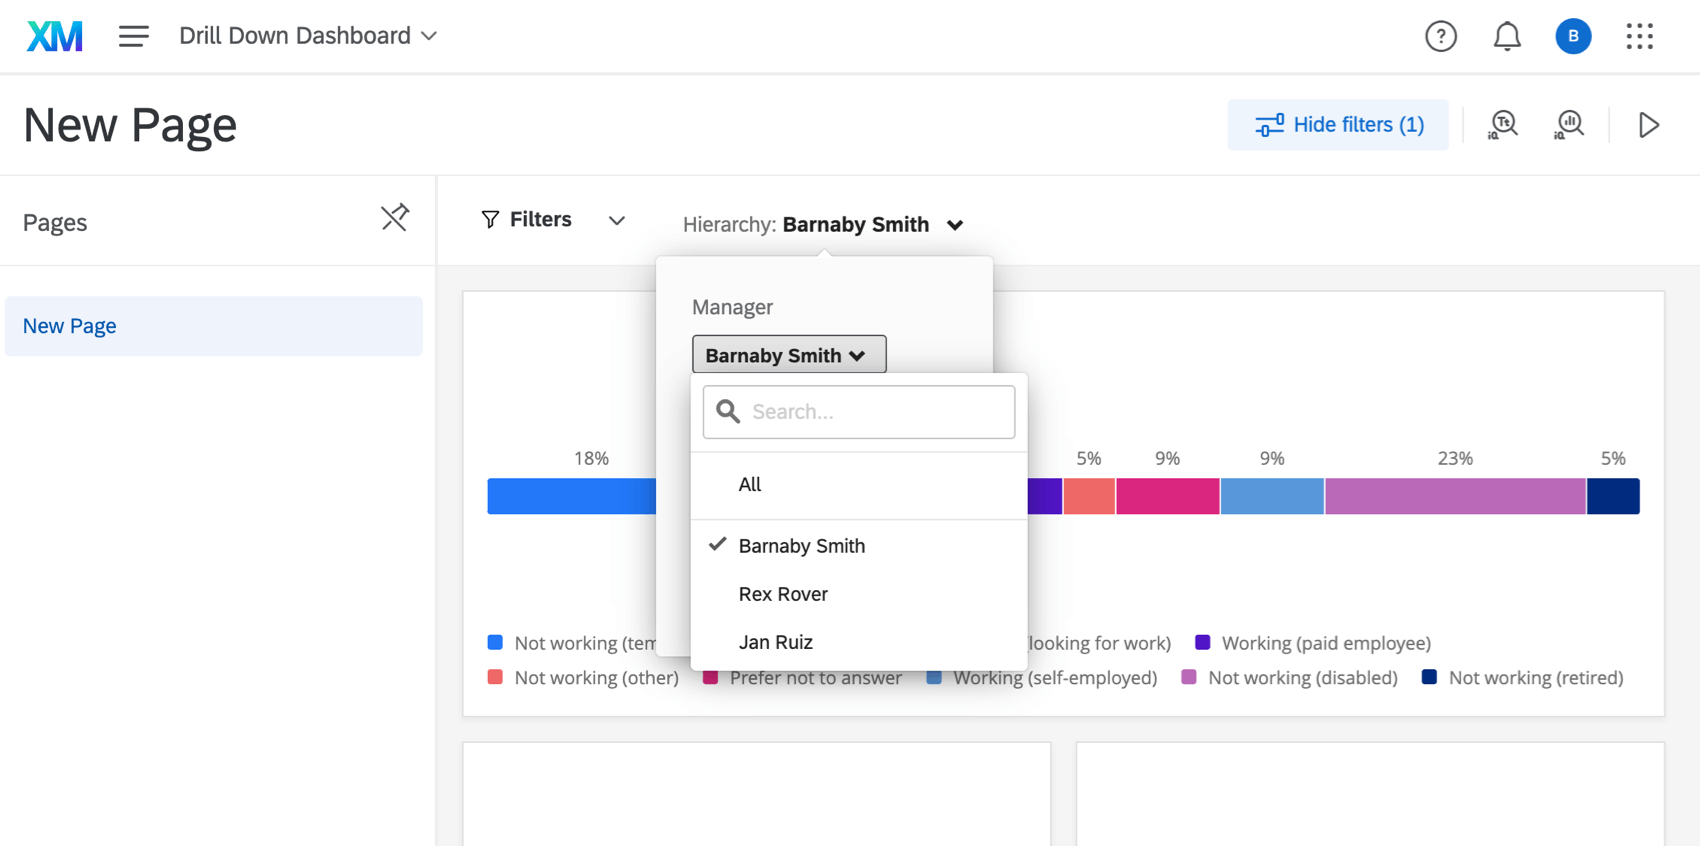
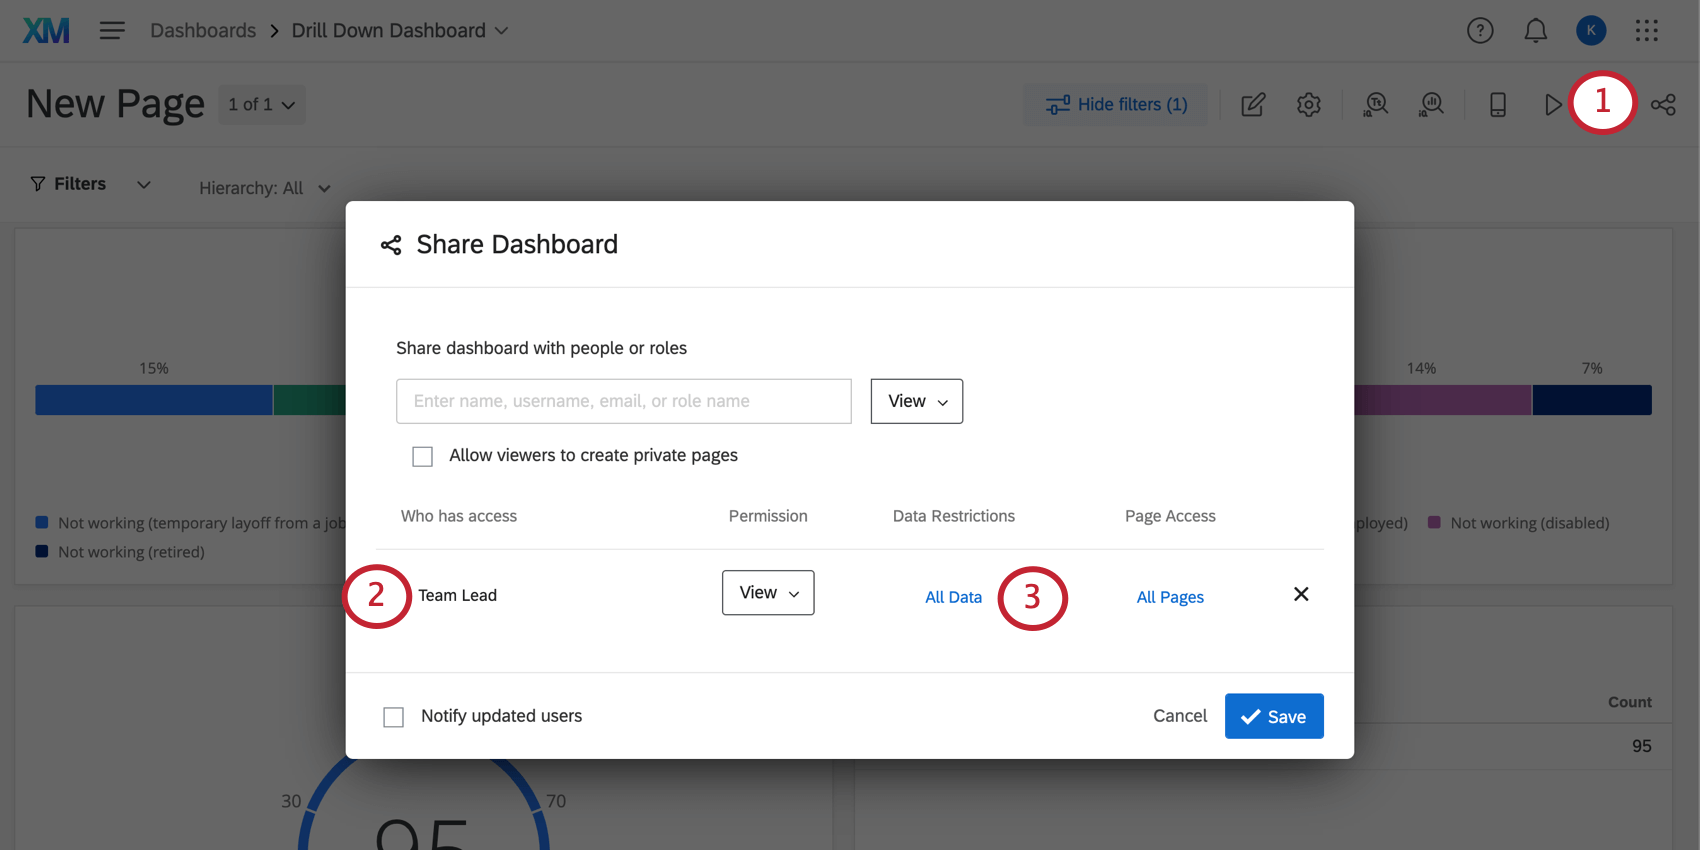
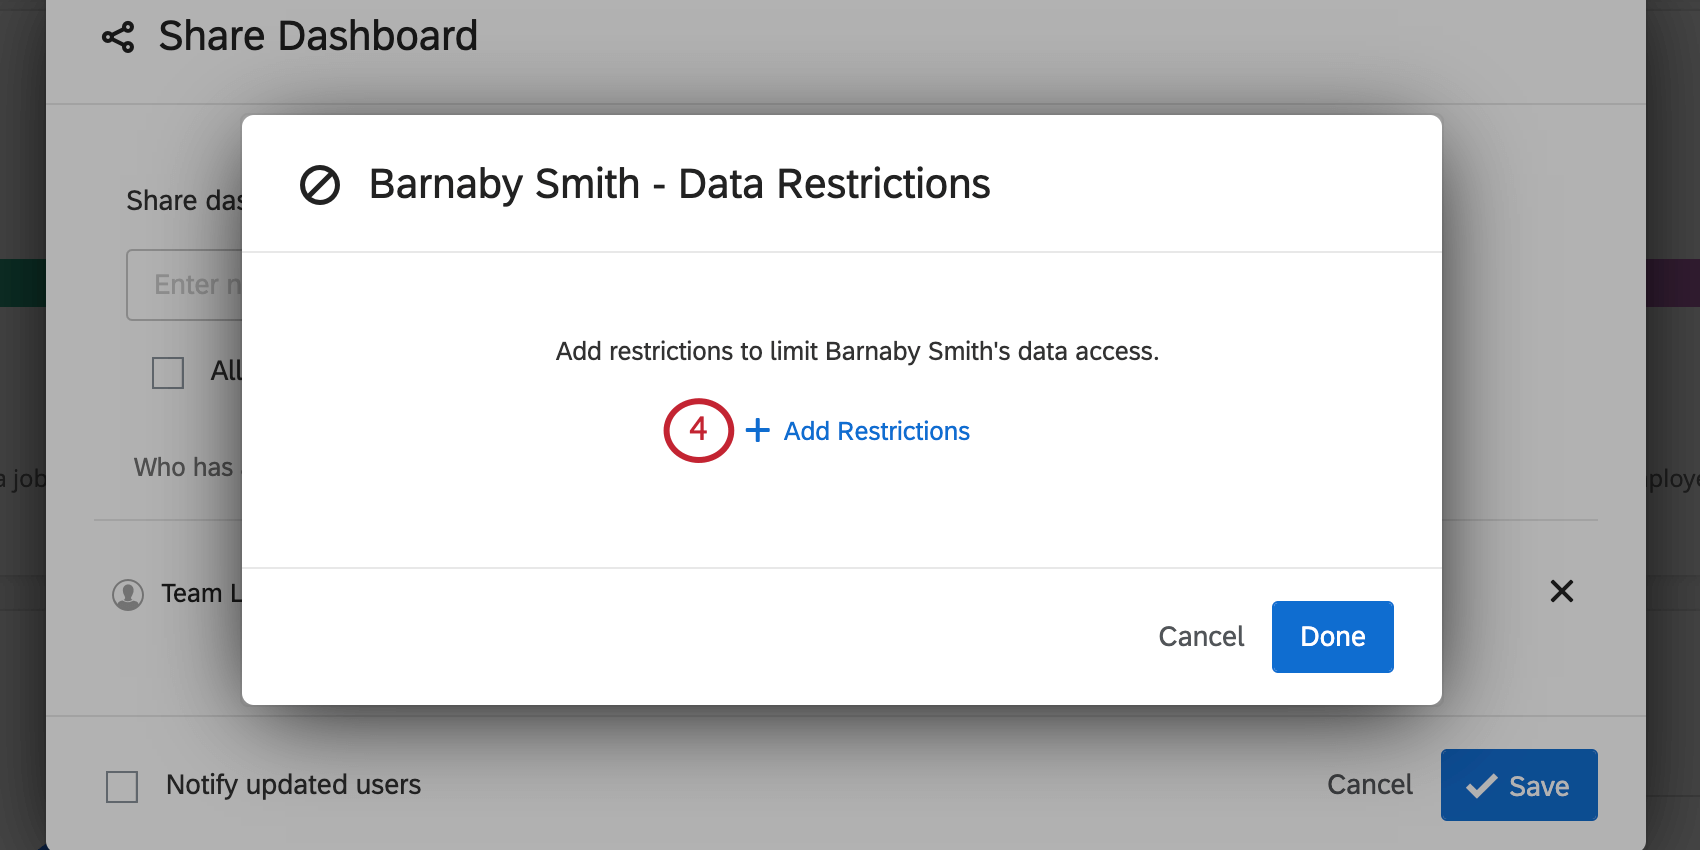
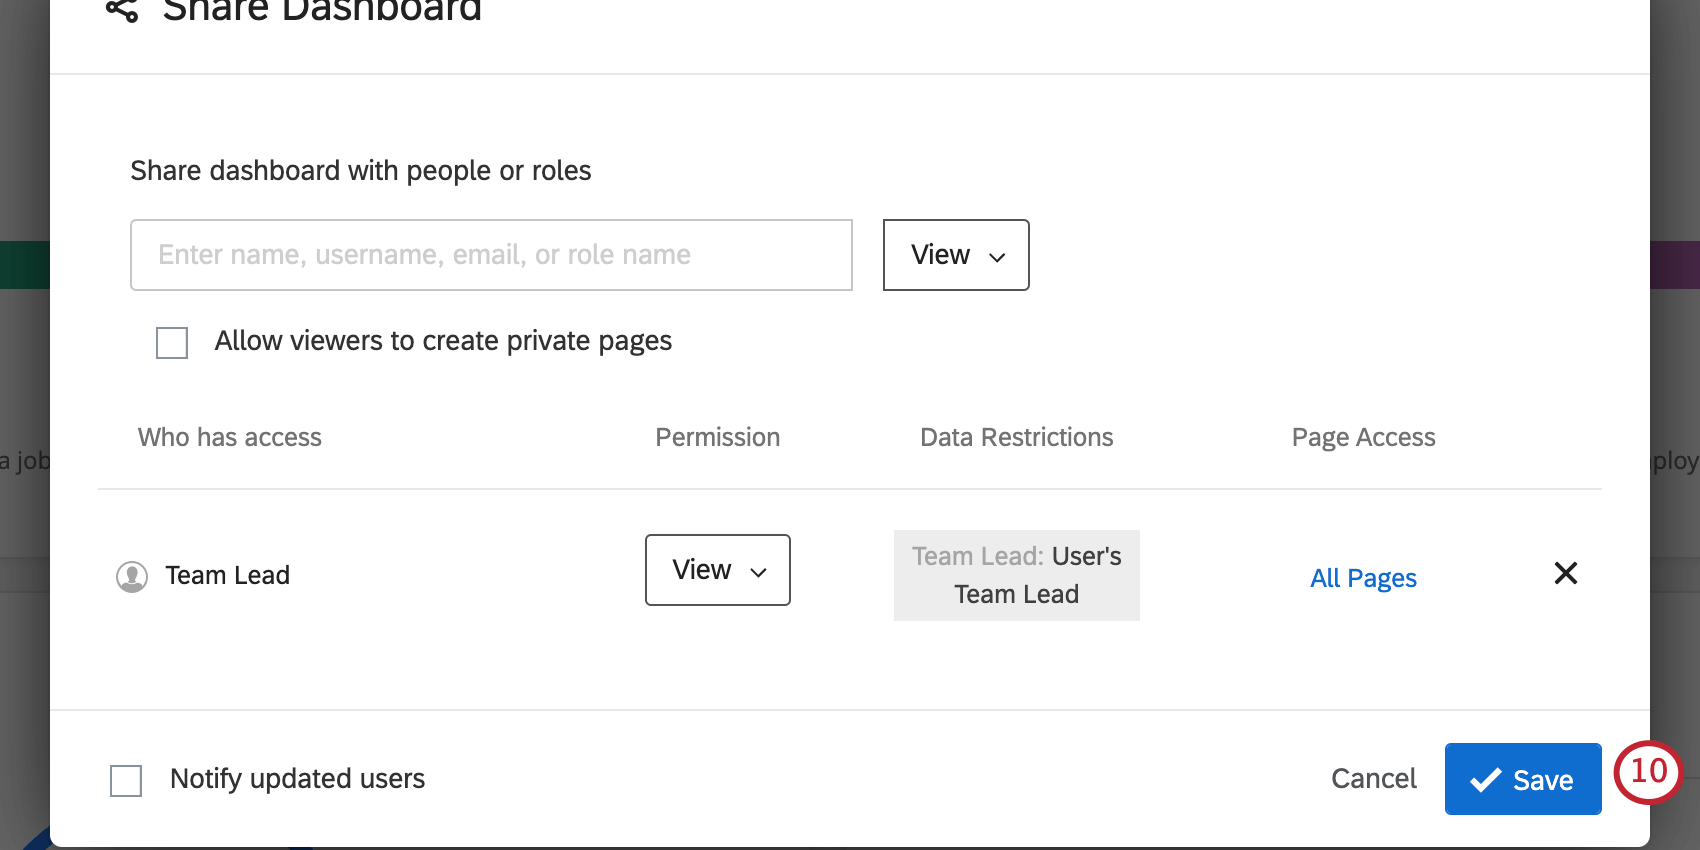
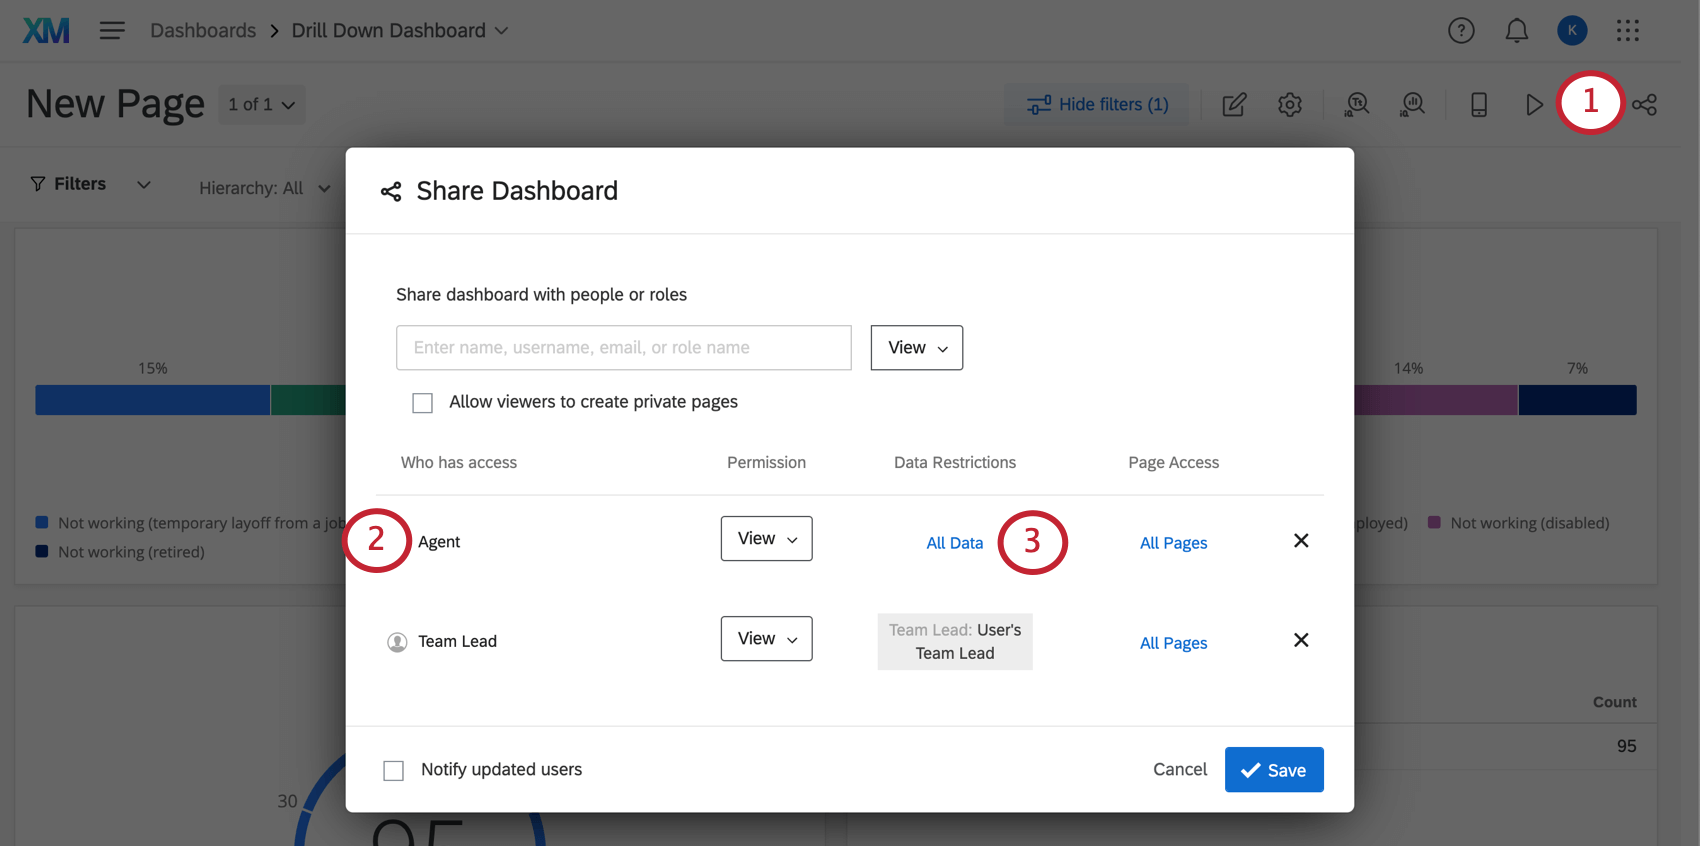
Setting Data Restrictions
This is the final step of our project. Setting data restrictions ensures that only the appropriate users will have access to certain data when they visit the dashboard.
In this dashboard, we assume managers are allowed to see all data, even other managers’.
Team Leads
Let’s say team leads can see their teams’ data, their agents’ data, and their company’s aggregate data. However, they cannot see another team lead’s data, or data under a manager that is not theirs.
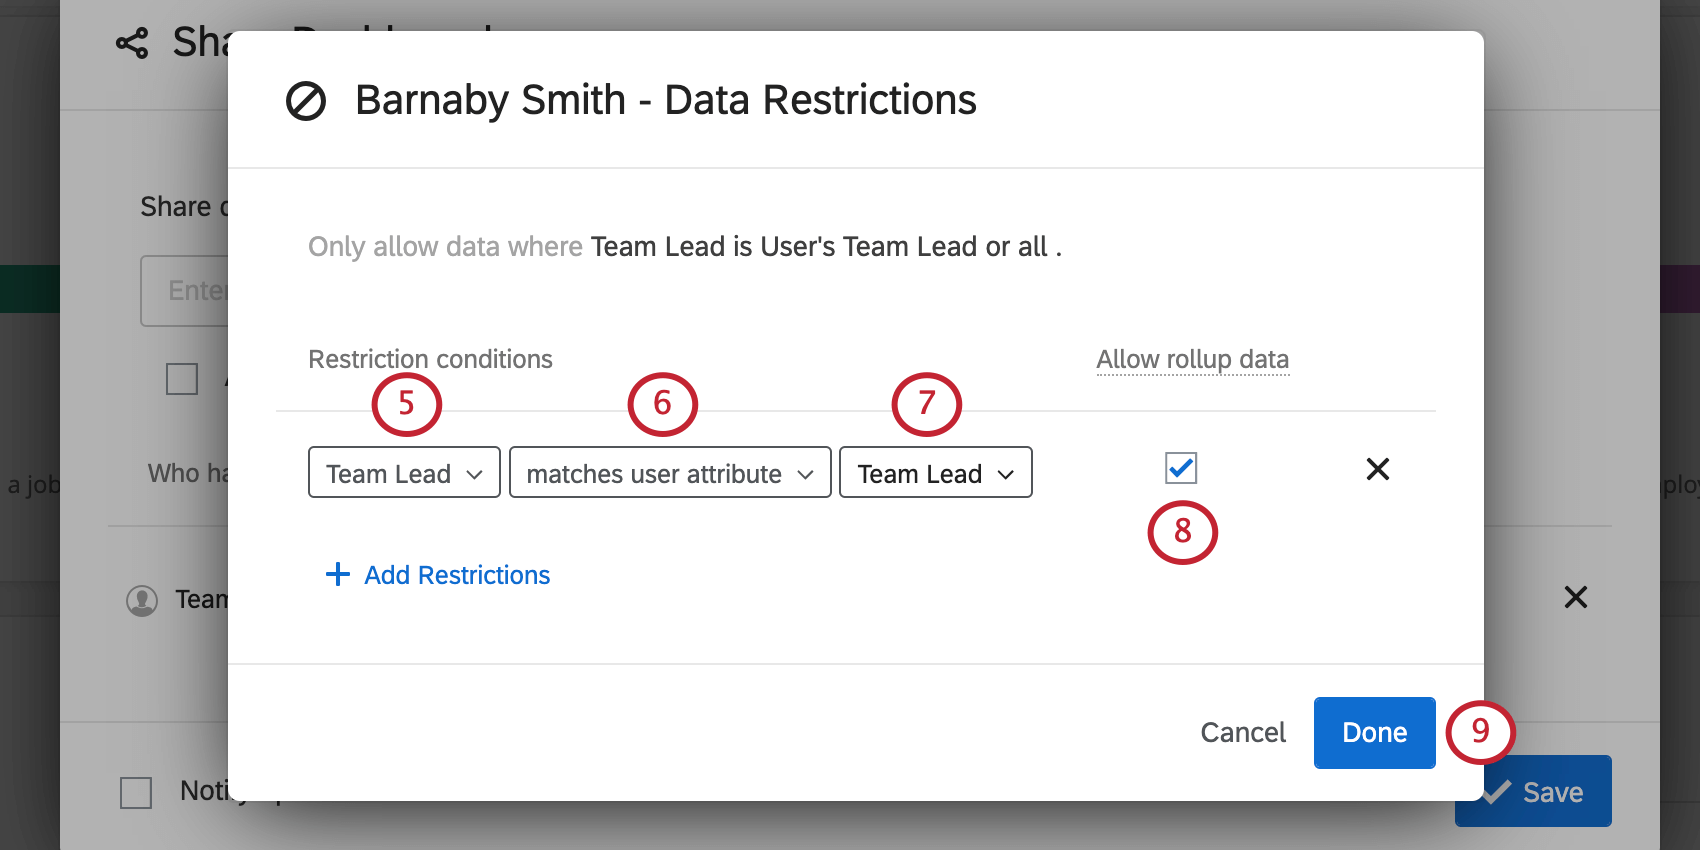
When team leads log in, they will be able to use the filters to view individual agents’ data, but they will not be able to switch to a different manager or team lead’s data.
However, they will be able to change the Manager field to All, showing the whole organization’s data.

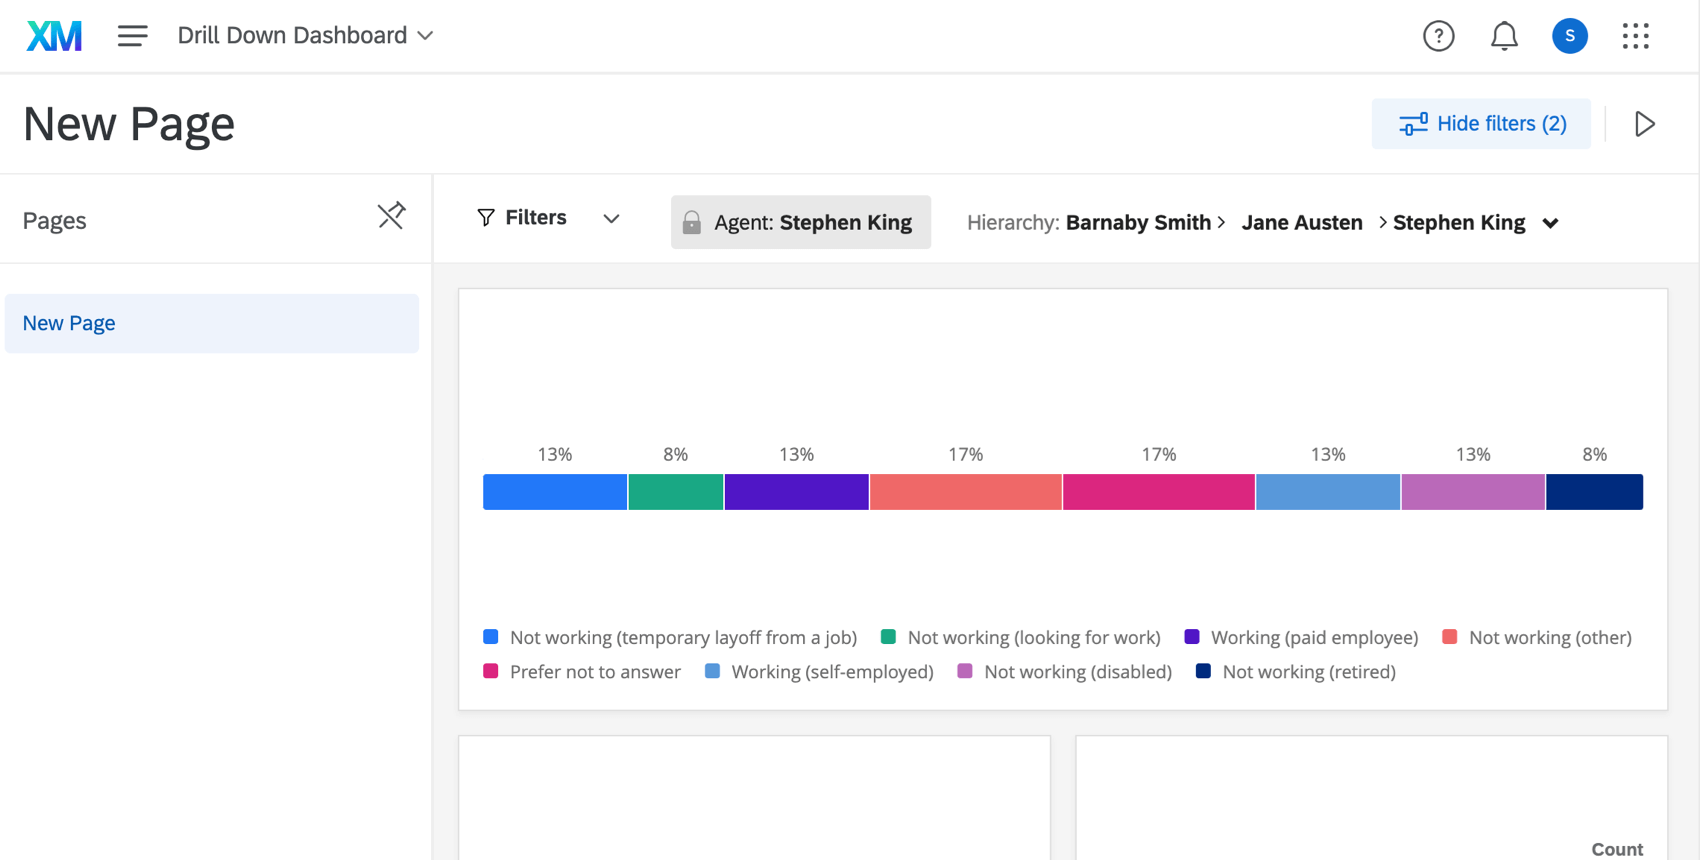
Agents
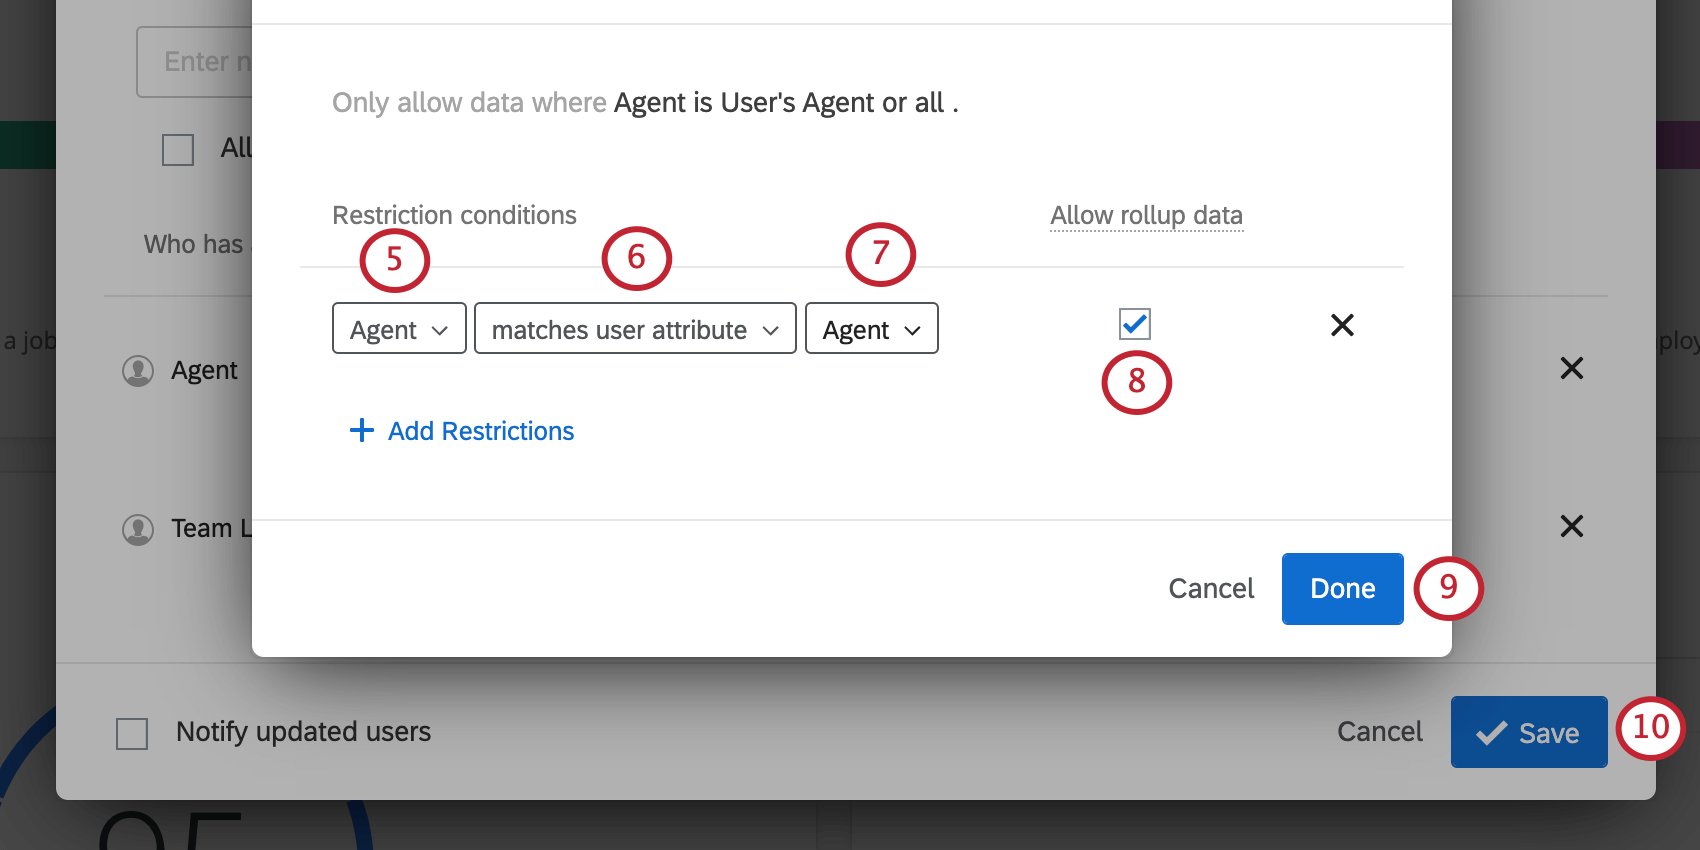
When an agent logs in, there will be a locked filter at the top of the dashboard, where Agent is set to their name. They will not be able to change that filter. Additionally, even if they select the hierarchy filter, they will not be able to see any other data, even if they select All for every field. The data is limited to their own.

That's great! Thank you for your feedback!
Thank you for your feedback!