Word Cloud Visualization
About Word Clouds
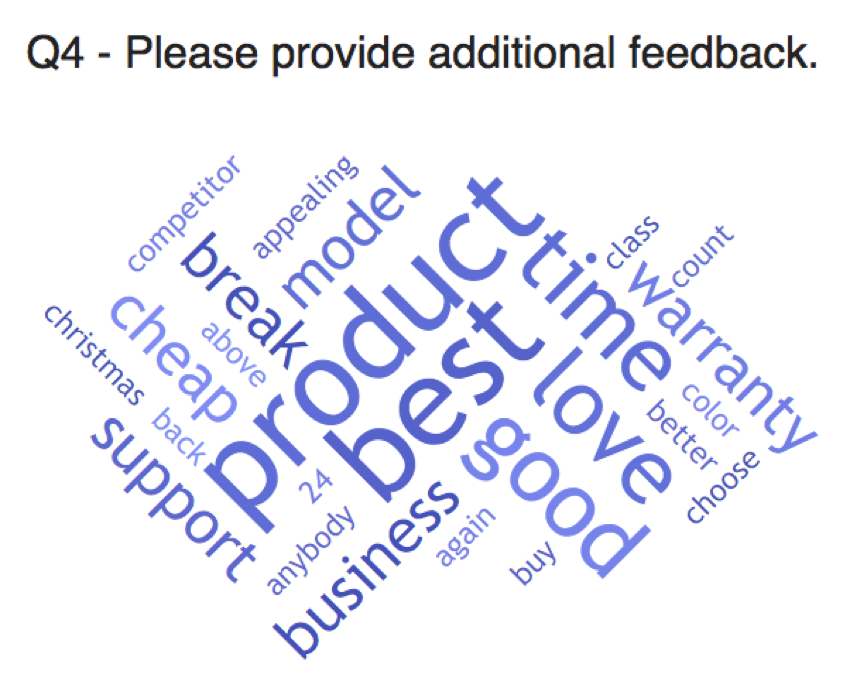
Word Cloud visualizations allow you to view the words repeated most often in your open-ended text results. The most frequent words appear in a cluster, with the font size increasing the more often that word was included in a response.
Customization Options
For basic visualization instructions and customization, visit the Visualizations Overview support page. Continue reading for visualization-specific customization.
Word Clouds have settings that allow you to adjust the words included and the format of the entire cloud.
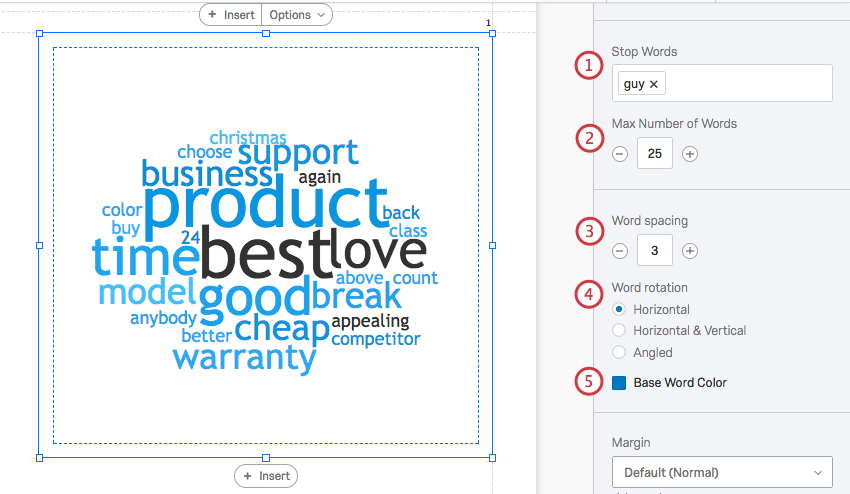
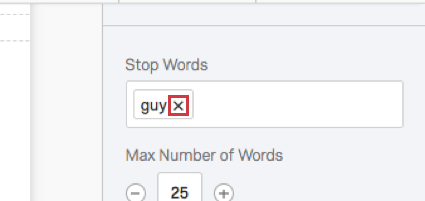
- Stop Words: By default, the Word Cloud visualization will filter out articles (a, an, the) and other common but not meaningful words. You can choose to filter out additional words by using the Stop Words feature. To add a word to the stop list, just type a word into the field and press Enter on your keyboard.
- Max Number of Words: You can use the Max Words setting to determine how many words should appear in your Word Cloud. By default, this count is set to 50, so your visualization will display the 50 most used words from your results. You can adjust the setting by clicking the plus ( + ) or minus signs ( – ), or you can click directly into the text box and enter a specific value.
- Word spacing: You can adjust the amount of space between words in your cloud by typing a number in the field. The size is measured in pixels.
- Word rotation: This determines how the words in your cloud are rotated. In the screenshot, you’ll notice that all the words are laid out horizontally.
- Base Word Color: You can change the color theme of your Word Cloud by clicking Base Word Color and selecting a color. The words in the visualization will take on various shades of this color. There is no pattern to the darkness or lightness of a word.
Compatibility
Word Clouds are compatible with all open-text fields that do not have numeric validation on them. This includes:
- Text Entry questions
- Form field questions
- Open text fields on other questions, such as Text Entry Matrix Tables, text entry columns on Side by Sides, and “Other” text boxes
- Text type Embedded Data
- Text type manual variables
Types of Reports
This visualization can be used in a few different types of report:


