-

Qualtrics Platform -

Customer Journey Optimizer -

XM Discover -

Qualtrics Social Connect
Distribution Summary
About the Distribution Summary
The Distribution Summary provides an overview of the responses collected for a survey. Responses are broken down by distribution channel (i.e., method), with an interactive graph displaying recent response trends and a table showing all responses collected so far.
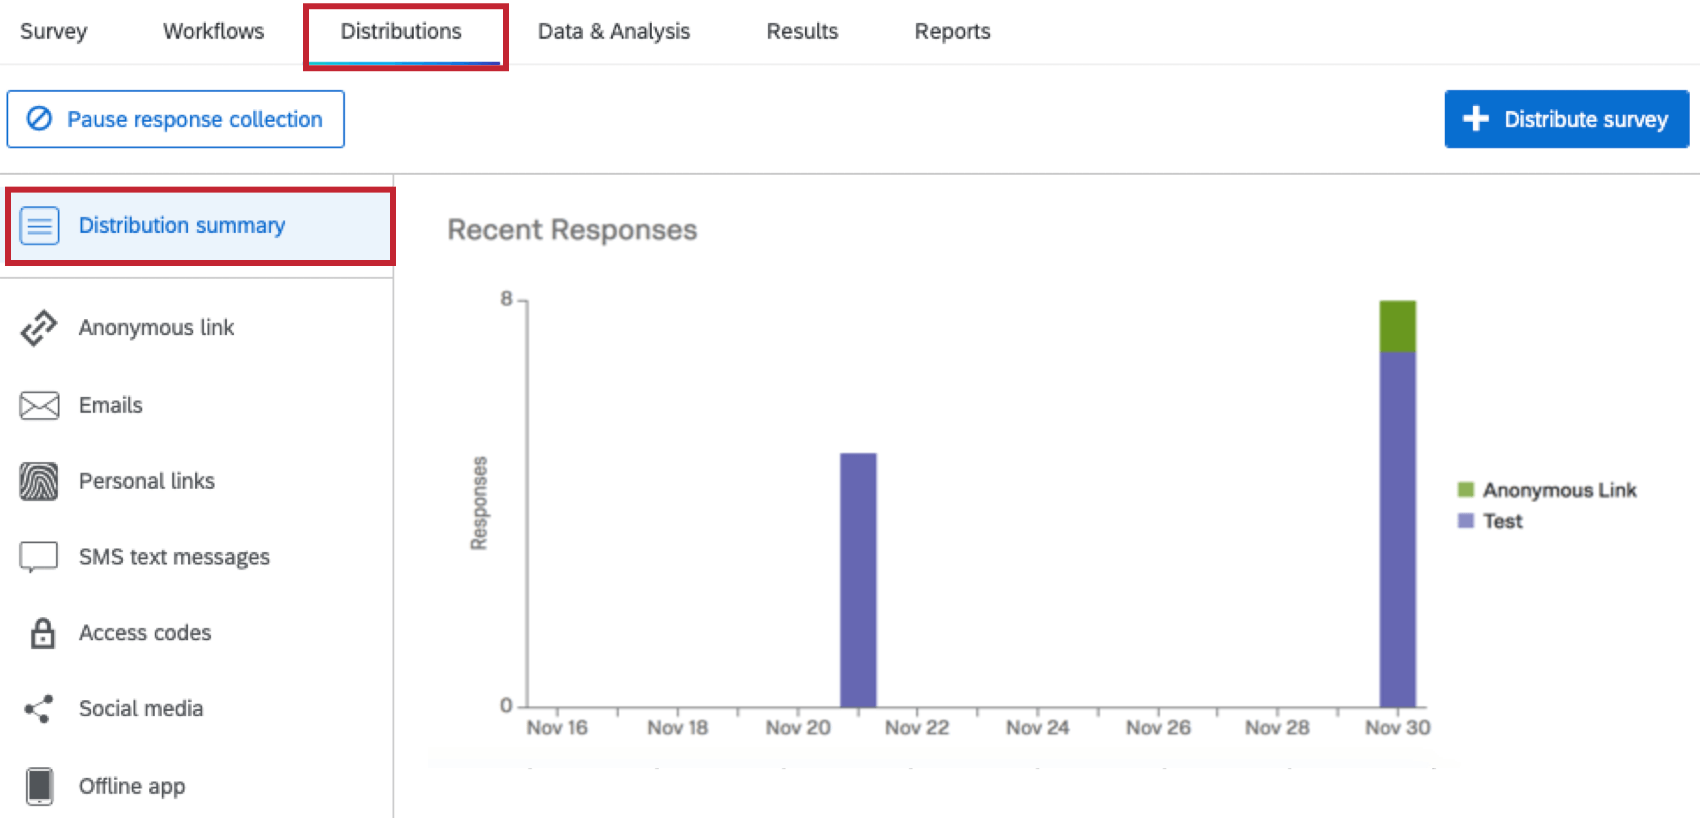
Recent Responses
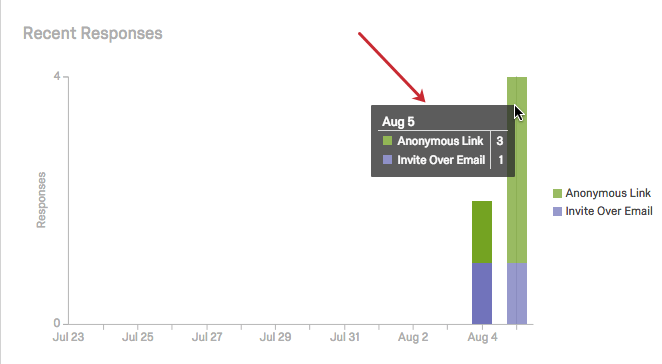
The Recent Responses graph displays the number of responses collected for each distribution channel over the last 14 days.
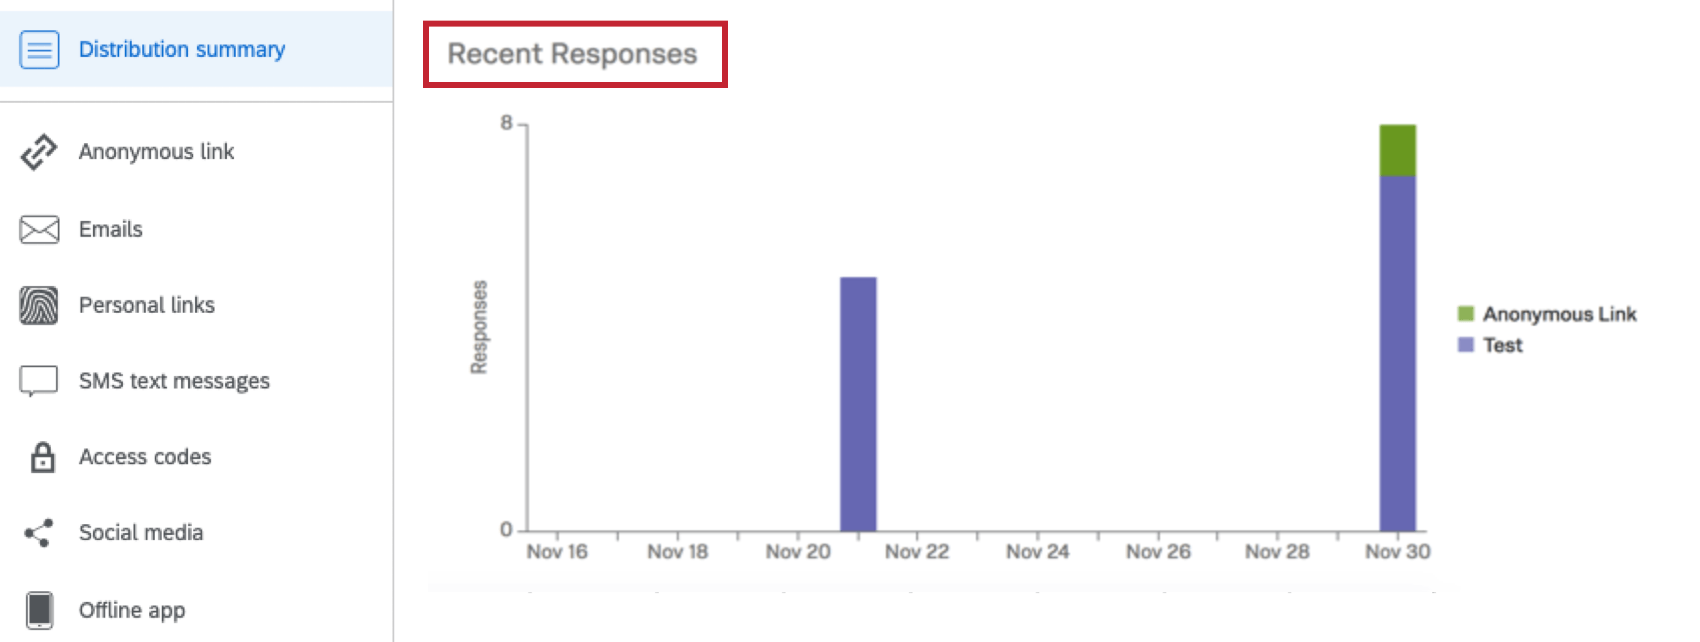
The X-axis displays the date, and the Y-axis displays the number of responses collected. The legend to the right updates as additional channels are used, or as older channels cycle out of the 14-day window. Hovering over a legend value will cause all other channels to fade out.
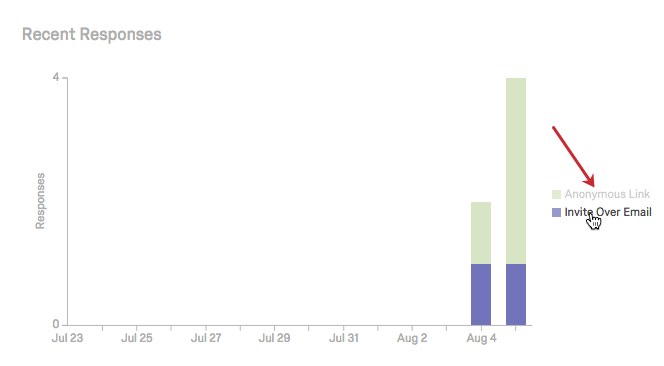
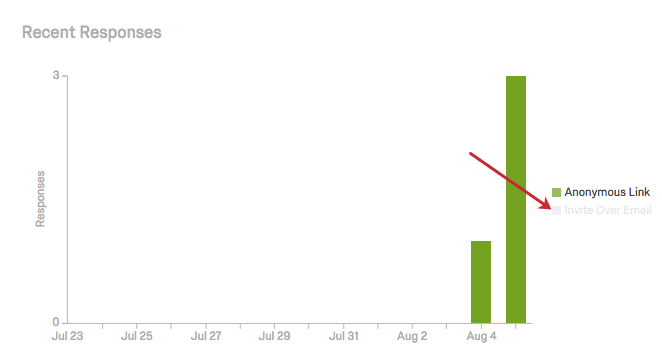
Clicking a legend value will hide its responses from the graph.
You can also hover over any specific day on the graph to see a breakdown of the response counts by distribution channel.
All Responses
The All Responses table shows all responses collected so far for each distribution channel used.
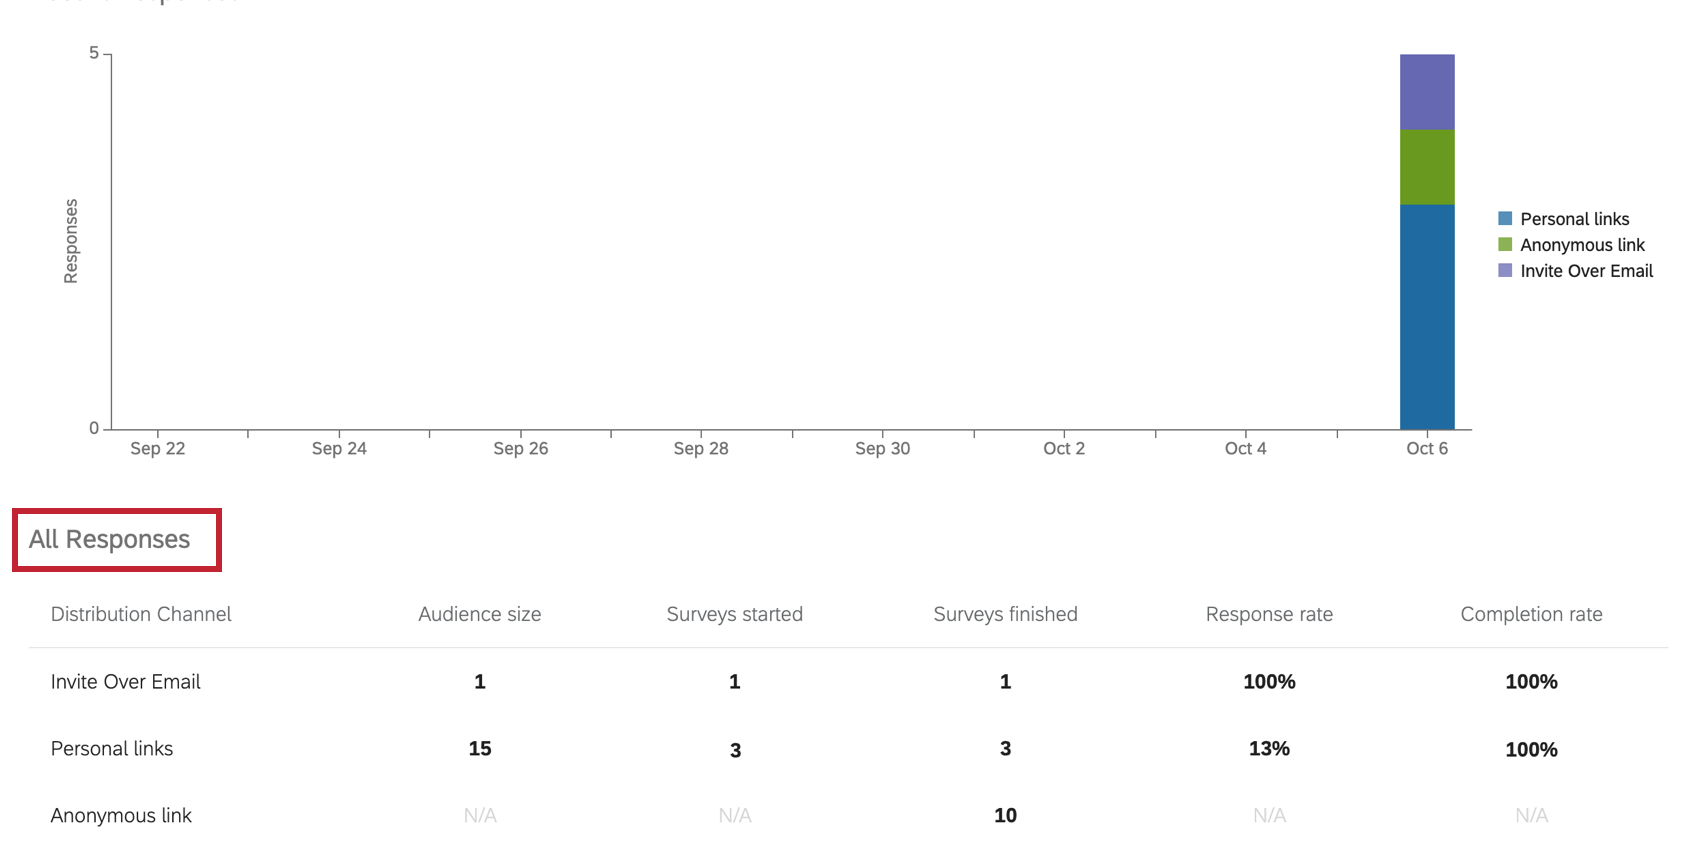
The following details are given:
- Distribution Channel: The channel that was used (e.g., Preview, Anonymous Link, Invite Over Email).
- Audience Size: The number of links that were distributed. This is N/A for any method that doesn’t involve links or that only produces 1 link, such as when you generate test responses.
Qtip: Deleting a distribution won’t reduce the Audience Size.
- Surveys Started: The number of surveys that participants started. A survey can be started by clicking a survey link, responding to an SMS invitation, or answering an inline email question. The number of surveys started includes both unfinished surveys and completed surveys.
- Surveys Finished: The number of surveys that have been completed. This doesn’t include responses in progress until they are closed.
- Response Rate: The number of surveys started divided by the audience size.
- Completion Rate: The number of surveys completed divided by the number of surveys started.
Qtip: “Completed surveys” doesn’t include incomplete survey responses, so this isn’t necessarily the same number you see in the Responses column.
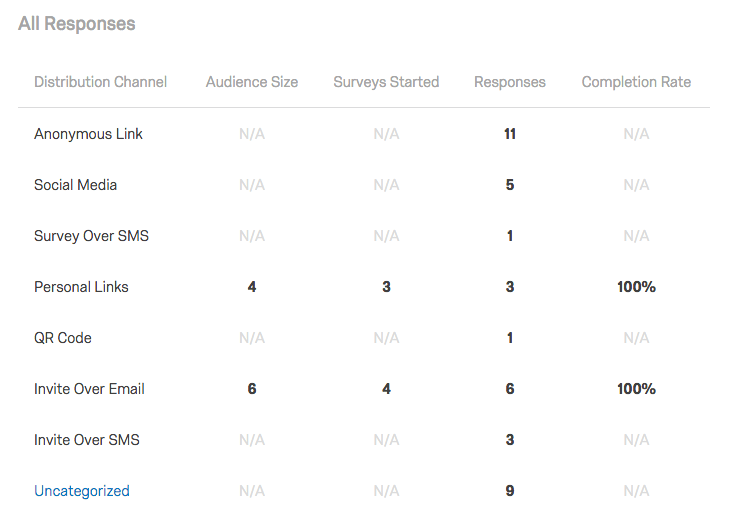
Channel Categorization
Your Distribution Summary organizes responses based on the channel that was used to distribute the survey. Qualtrics keeps track of the distribution channel by appending the embedded data field Q_CHL to the end of your survey links via a query string. Depending on the type of distribution, the value assigned to the field will vary.
- Anonymous Link
- Does not have Q_CHL appended
- Social Media
- Q_CHL=social
- Personal Links
- Q_CHL=gl (gl stands for generated link)
- QR Code
- Q_CHL=qr
- Invite Over Email
- Q_CHL=email
- Invite Over SMS
- Q_CHL=smsinvite
- Uncategorized
- Q_CHL is missing or invalid

Types of Projects With Distribution Summaries
Distribution summaries work as described on this support page in several types of projects, including:
- Survey projects
- XM Solutions
- Conjoint and MaxDiff projects
You cannot see an individual project’s distribution summary from XM Directory. However, XM Directory comes equipped with other similar tools, such as a directory-wide summary of distribution performance. See Summary Tab for more details.
Any projects or tools not listed above are not supported.