Metrics for Facebook Insights
About Metrics for Facebook Insights
When you view Insights for Facebook, you will notice that additional metrics are available for reporting. This page covers the unique metrics that are only available for connected Facebook profiles.
Available Metrics
Qtip: These metrics are segmented, meaning if you’ve connected multiple Facebook profiles, you can view data for each individual profile.
The following metrics and key performance indicators are available for Facebook profiles:
- Fans: A graph showing the number of people who liked the Facebook page over time.
- Post engagement rate: A graph showing how often your audience engages with your posts.
- Fan engagement rate: A graph showing how often fans engage with your posts.
- Engagement: A graph showing the number of times your audience engaged with your posts. Engagement includes likes, comments, replies, wall posts, and private messages.
- Reactions: A table showing the different reactions on your posts and the number of each.
- Page and tab visits: A graph showing the amount of times one of your Facebook pages were visited by someone who was logged in to Facebook.
- Post reach: A graph showing the unique number of people who saw your post. This metric is segmented into the different types of reach:
- Paid: The number of people who saw the post as a result of a sponsored story or ad pointing to your page.
- Organic: The number of people who visited your post directly or saw your post in their news feed.
- Viral: The number of people who accessed the post via a story from a Facebook friend.
- Total reach: A graph showing the unique number of people who saw any activity from your page. This metric is also segmented into the different types of reach: paid, organic, and viral.
- Daily page stories: A graph showing the total number of stories (post likes, post comments, post shares, likes on shares, page likes, etc) that your page has received.
- Shares: A graph showing the total number of shares your page has received per day.
- Video views: A graph showing the total number of times a video has been viewed for more than 3 seconds.
- View views (details): A graph showing the number of times a video has been viewed broken out by the average daily view count.
- Where do your page likes come from: A graph showing the number of times your Facebook page was liked, broken out by the source of where the like came from (for example, via the mobile app, or via a site search). The different sources include:
- API: People who like your page through an app developed by a third party.
- Timeline: People who liked your page from the “Likes” section of their own Timeline.
- External connect: People who liked your page form an external site using a Facebook social plugin.
- Hovercard: People who liked your page through the popup window they get when they hover over a link that leads to your page.
- Mobile ads: People who liked your page through a mobile ad.
- Page browser: People who liked your page using Facebook’s Page Browser.
- Page profile: People who liked your page on the page itself.
- Page suggestion: People who liked your Page through an invite from an Admin.
- Recommended pages: People who liked your page via the recommended pages section.
- Search: People who liked your page from their search results.
- Sponsored story: People who liked your page via a sponsored story.
- Ticker: People who liked your page from a story they saw in their ticker.
- Wizard suggestion: People who liked your page in the new user wizard when registering for Facebook.
- Favorites: People who liked the page via other pages that have liked your page.
- Like story: People who liked your page from a story they saw about a friend liking it.
- Fan context story: People who like your page through the hover over context part that pops up when their friend mentions the page.
- Photo snowlift: People who liked your page while viewing a photo ‘snowlift’ lightbox.
- Net likes: A graph showing the number of unique people who liked your page, and the number of people who disliked your page.
- Positive feedback from users: A graph showing the number of people who left positive feedback on your page, broken out by type. The types of positive feedback include:
- Like: Liking a story.
- Link: Sharing a story.
- Comment: Commenting on a story.
- Answer: Answering a question that was posted.
- RSVP: Responding to an event.
- Claim: Claiming an offer.
- Negative feedback from users: A graph showing the number of people who left negative feedback on your page, broken out by type. The types of negative feedback include:
- Post hides: Hiding a post that was published by your page.
- Hide all: Hiding all posts that are published by your page.
- Removed posts: Choosing to prevent a post from appearing again.
- Spam reports: Reporting the page as spam.
- Unlike page: Unliking the page.
- External referrers: A chart showing the top external domains that direct traffic to your page. This chart is segmented by the different external domains.
- Check-ins: The number of check-ins at a place, represented by a Facebook page.
Qtip: Hover your mouse over the info icon on a metric to view a formula of how that metric is calculated, if available.
Viewing Raw Data
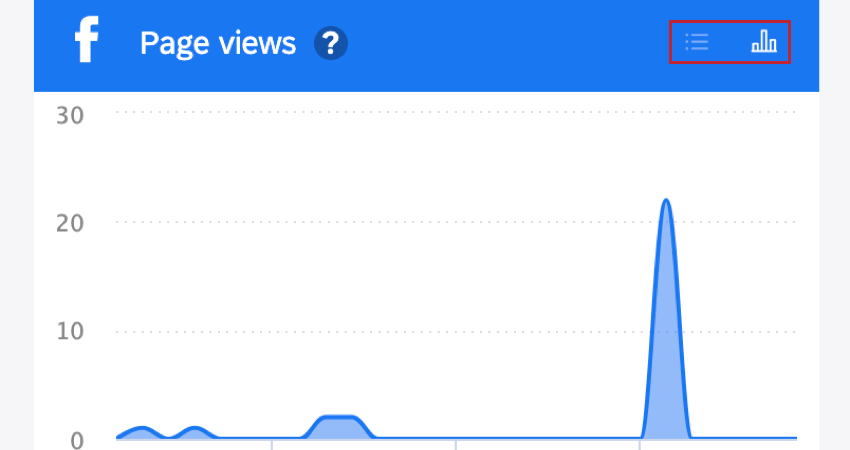
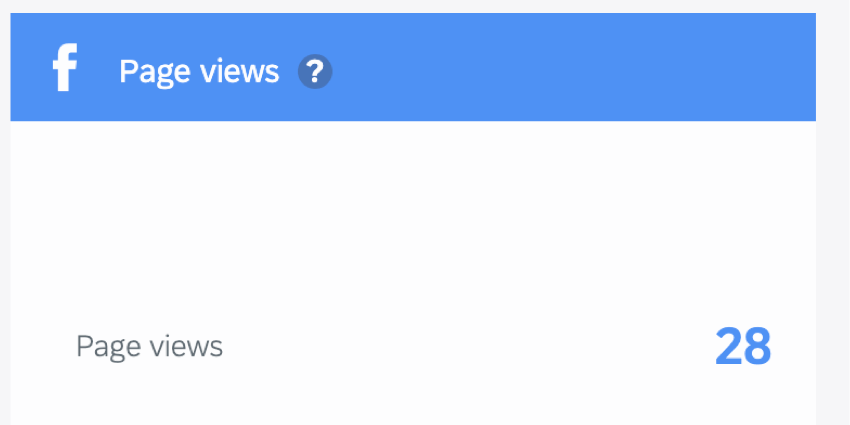
By default, each metric will display your data in a visualization, either a chart or a graph. However, you can view the raw data for a specific visualization.
Use the icons in the top right corner of the visualization’s header to switch between the 2 views.

