
Crosstabs
What's on this page
About Crosstabs
Qualtrics has provided a cross tabulation tool for you to perform multivariate analysis on 2 or more variables at a time. This tool includes numerous options to customize your crosstabs, including the ability to calculate Chi-squared statistics and ANOVAs.
This page covers the basics of setting up a crosstab, in addition to all the various ways you can configure your variables or make calculations. See Crosstab Options for additional functions.
Qtip: Crosstabs are statistical tests. See more about cross tab theory.
If you are looking for a table that displays the number of times each choice was selected, you should look at Simple Tables (in Results-Reports) or Data Tables (in Advanced-Reports), not crosstabs. If you want basic mean, minimum, maximum, and other stats information for only 1 question, look into Statistics Tables (Results) or Statistics Tables (Advanced), not crosstabs.
Qtip: Variables created in Stats iQ can be used in Crosstabs rows, stubs, and filters.
Types of Projects with Crosstabs
Qtip: Not all of the features discussed here are available on all licenses. Please reach out to your Account Executive if you’re interested in getting access to new features.
Crosstabs are available in a few different project types. Depending on what you have access to in your organization, crosstabs are compatible with the following:
- Survey projects Qtip: This includes survey projects within programs, such as surveys within Brand programs.
 Attention: Heat Map questions are not compatible with Crosstabs.
- Many guided XM Solutions
- Imported data projects
- Engagement
- Lifecycle
- Ad Hoc Employee Research
- Conjoint and MaxDiff projects Attention: Although Conjoint and MaxDiff data appears in Crosstabs, it may not work with Crosstabs as well as any basic survey data you record in the same project.
Crosstabs are not compatible with 360, Pulse, or any projects not listed above.
You cannot bring crosstabs information (such as tables, weighting, or custom fields) into other reports, including any type of dashboard.
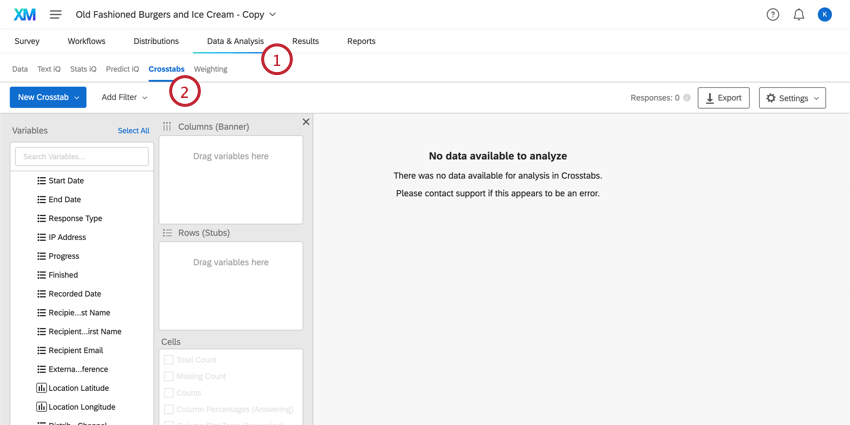
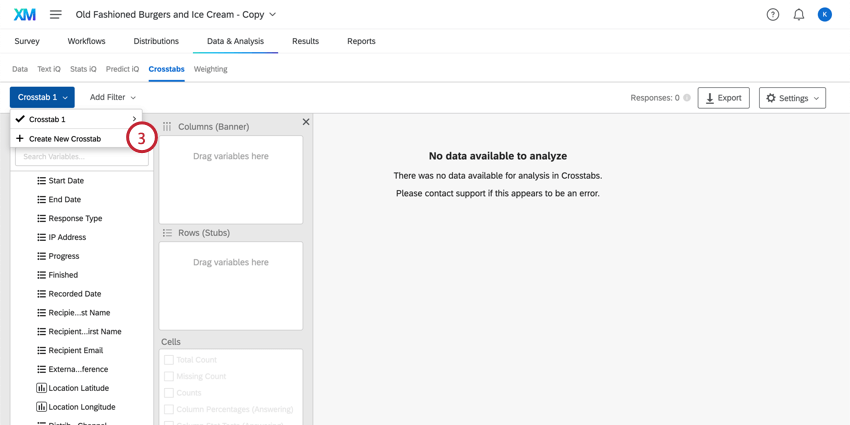
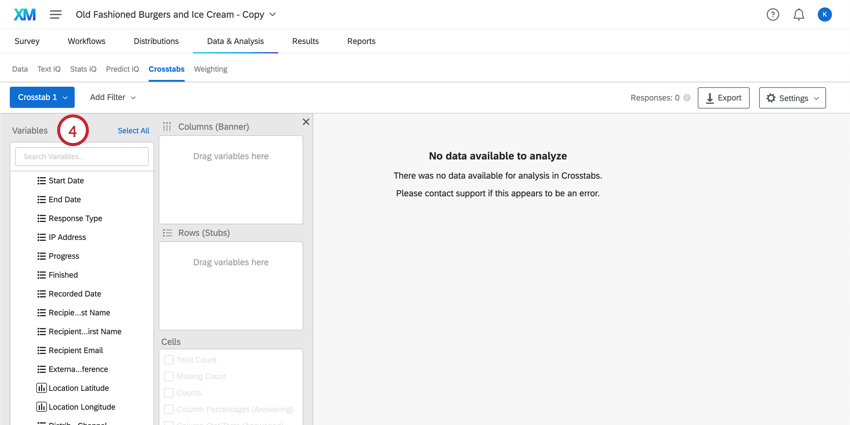
Creating New Crosstabs
Qtip: Imported data and embedded data are compatible with crosstabs, but must be added to survey data before you create your first crosstab. Crosstabs are compatible with the Text, Text Set, Number Set, Number, and Filter Only formats of embedded data.
Qtip: Numeric text entry questions cannot act as a column or row.
Qtip: You can select multiple variables by holding down the command key on Mac or the control key on PC and clicking the variables you want to select. You can also select many variables in a row by holding down the shift key on your keyboard and then clicking the first and last variable in your desired selection.
Attention: In Crosstabs, you cannot choose multi-select variables (any question or embedded data field where a respondent could have multiple values) as both the Column and the Row variables.
Qtip: Are some of your cells grayed out? Chances are you need to either recode some of your data or select other options first. See the Available Calculations section for what you need to do.
Adding New Responses to Crosstabs
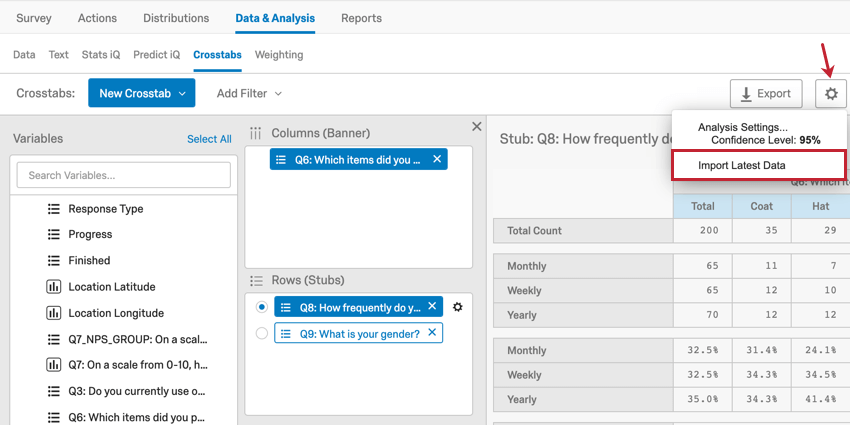
As you collect more responses, your crosstabs will need to be recalculated. Click the Settings tab in the top right hand corner and select Import Latest Data to add the new responses to your dataset. Your crosstab will be unavailable while it is recalculating.

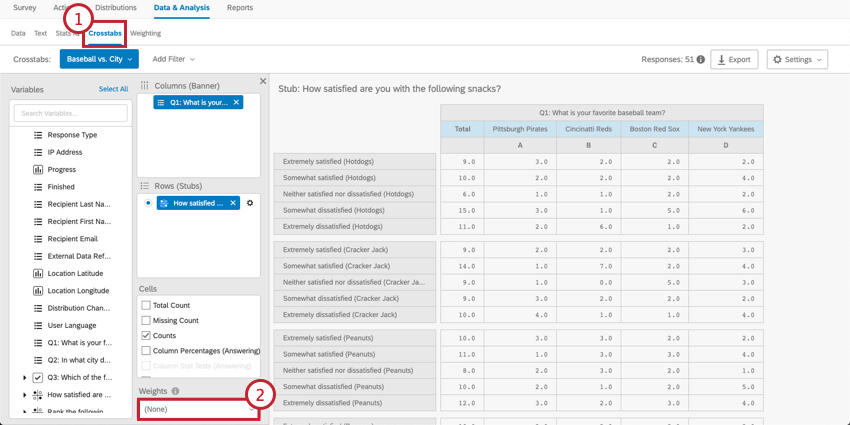
Weighting in Crosstabs
You may also want to apply Weighting to your crosstabs data. This can be done based on response weighting or based on 1 of the existing numeric variables in your data.
Qtip: “Qualtrics Weighting” is the weighting created in the Weighting tab. If you haven’t applied weighting to your data, this variable won’t appear in the crosstabs menu.

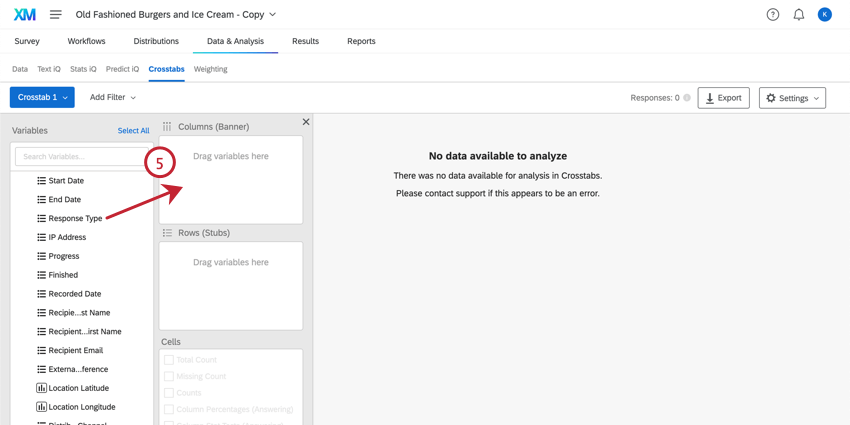
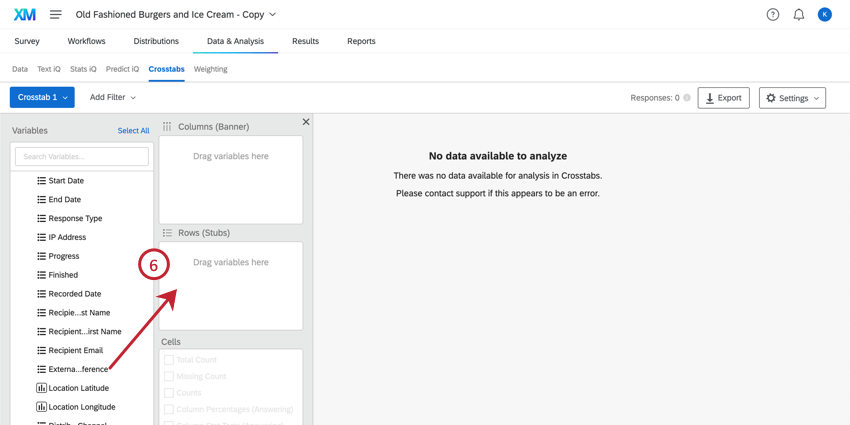
Navigating Columns and Rows
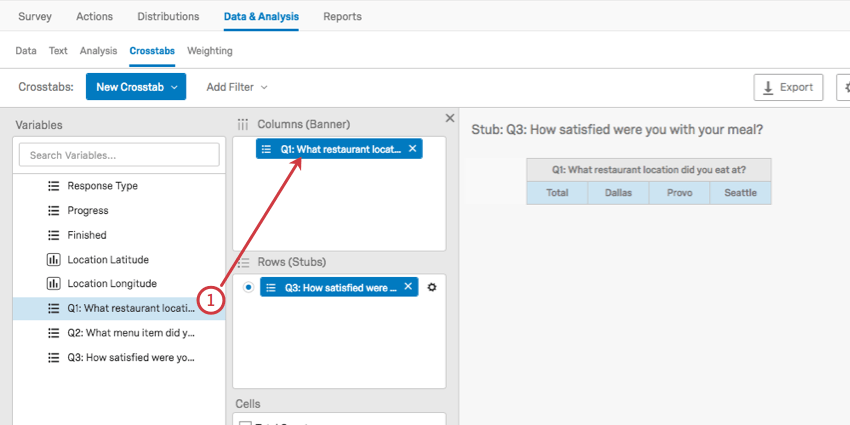
Columns (banners) are “input” variables. This includes demographics, such as gender, income, or age. Columns should be variables you are treating as unchanging or independent.
Rows (stubs) are “output” variables. This includes variables that are ratings, like satisfaction, CSAT, CES, NPS, etc. Rows should be variables that you think may change based on conditions in your research.
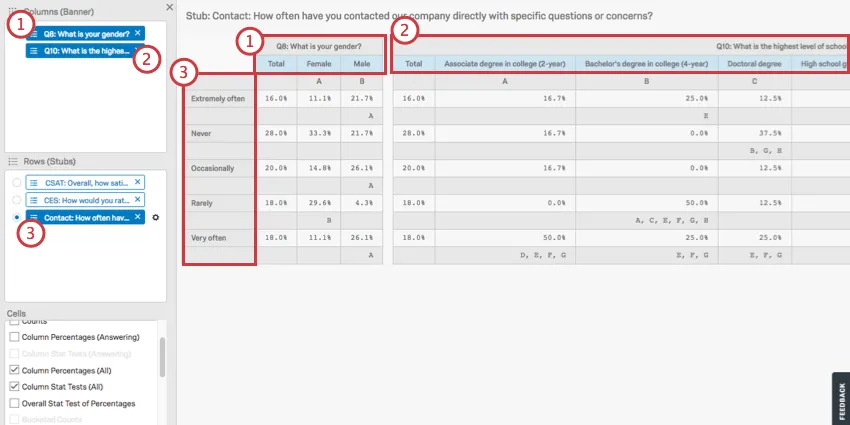
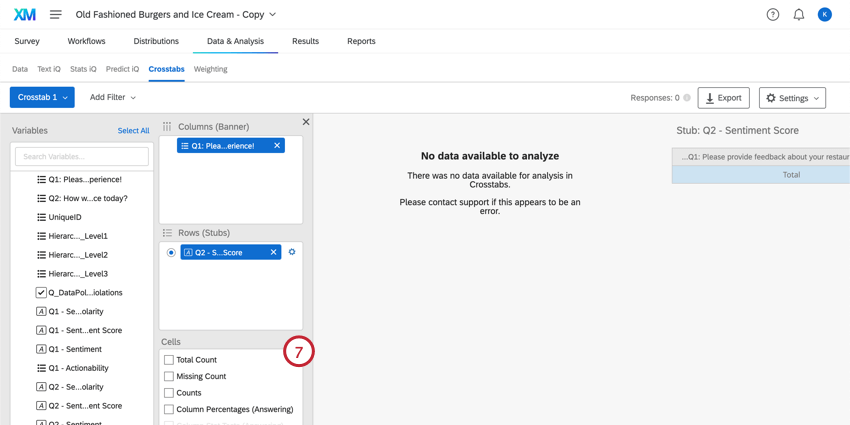
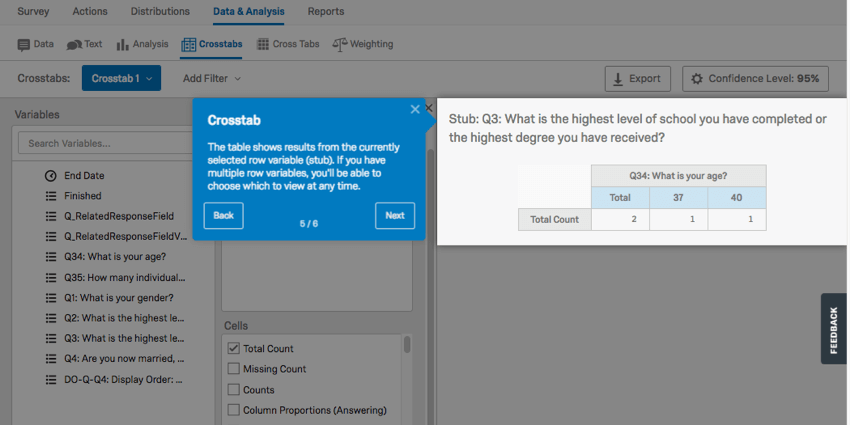
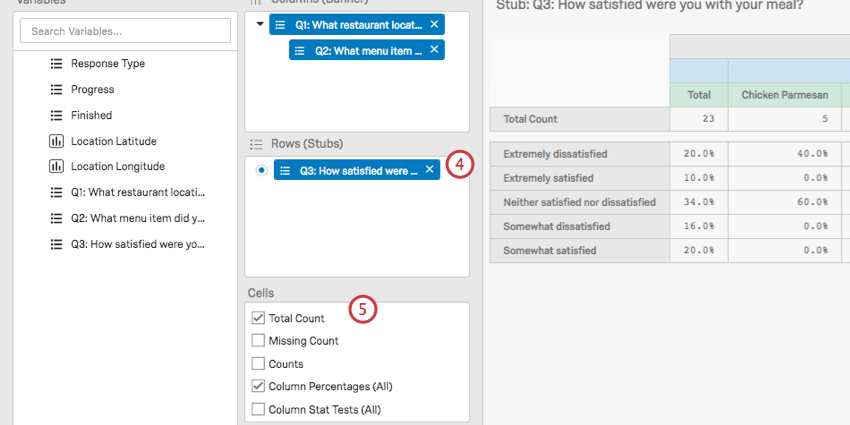
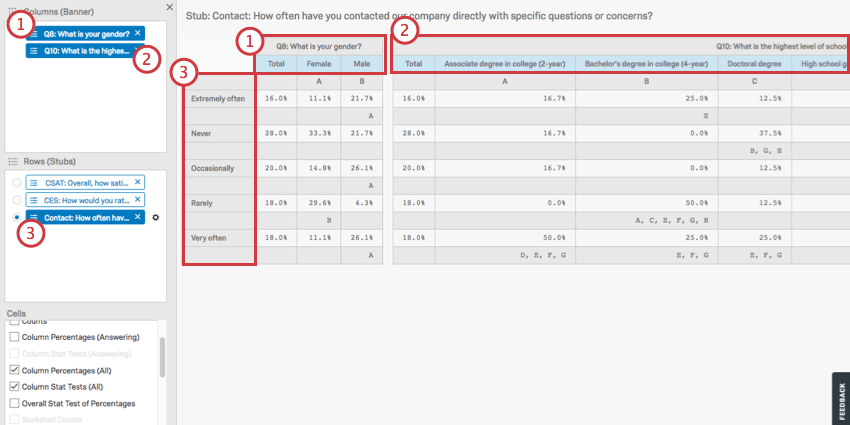
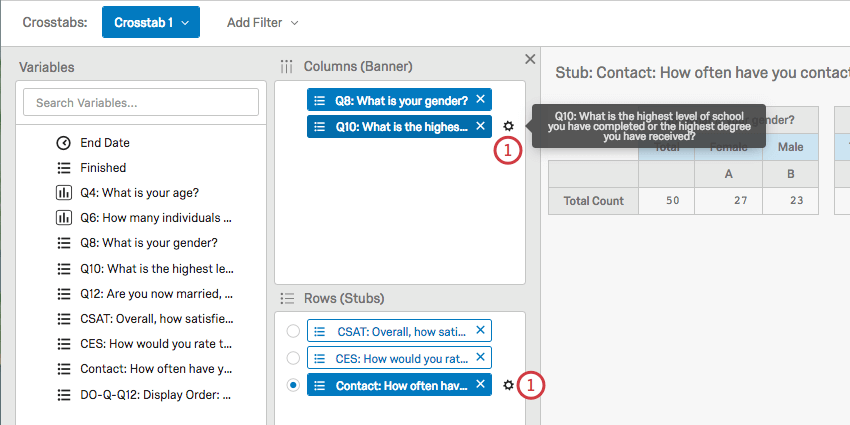
Above, you see a crosstab composed of the following elements:
You can add multiple fields to your row, but you cannot view them all at once; these calculations are separated from each other because each field in a row is run in a separate calculation against the chosen columns. Click on a row to view the calculations for that row.
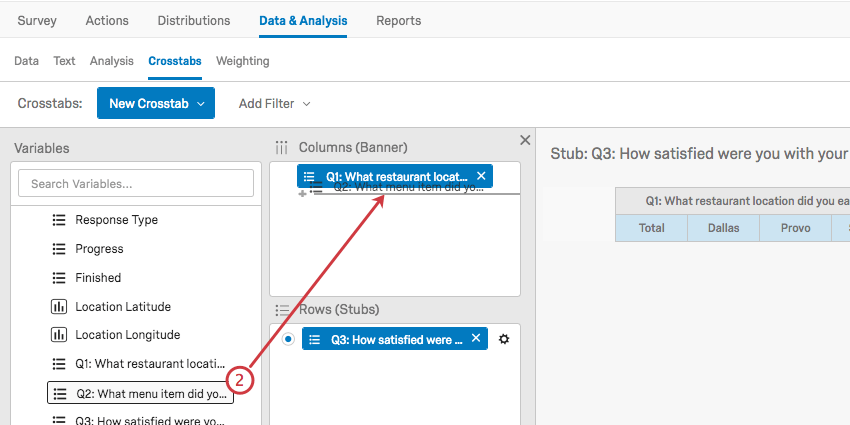
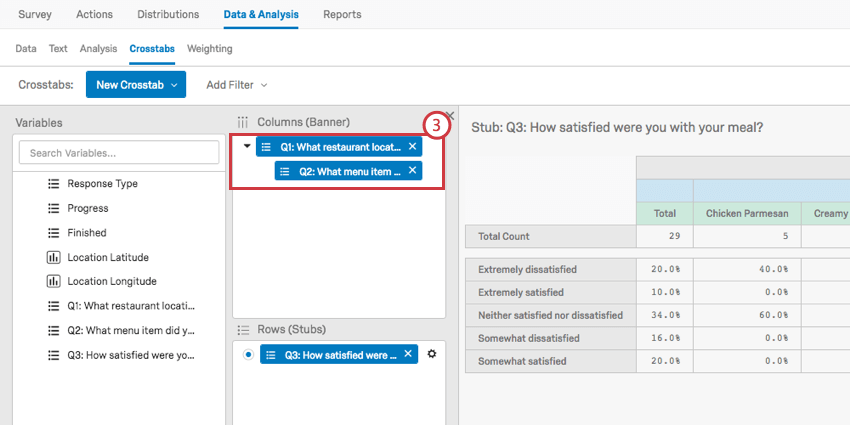
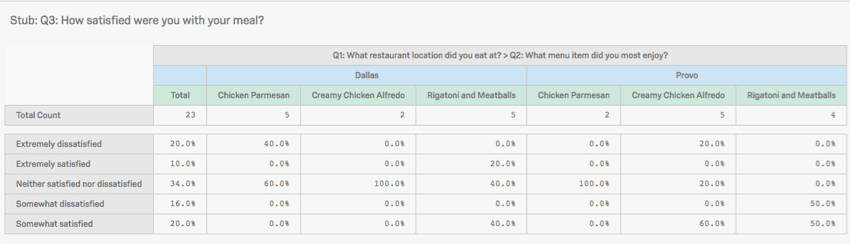
Nesting Columns
Nesting columns allows you to have 1 set of variables splitting another. So instead of having High-Income and Low-Income, and separately USA and Canada, you get High-Income-USA, High-Income-Canada, Low-Income-USA, Low-Income-Canada.
Qtip: Only columns can be nested. rows cannot be nested.
Creating Custom Columns
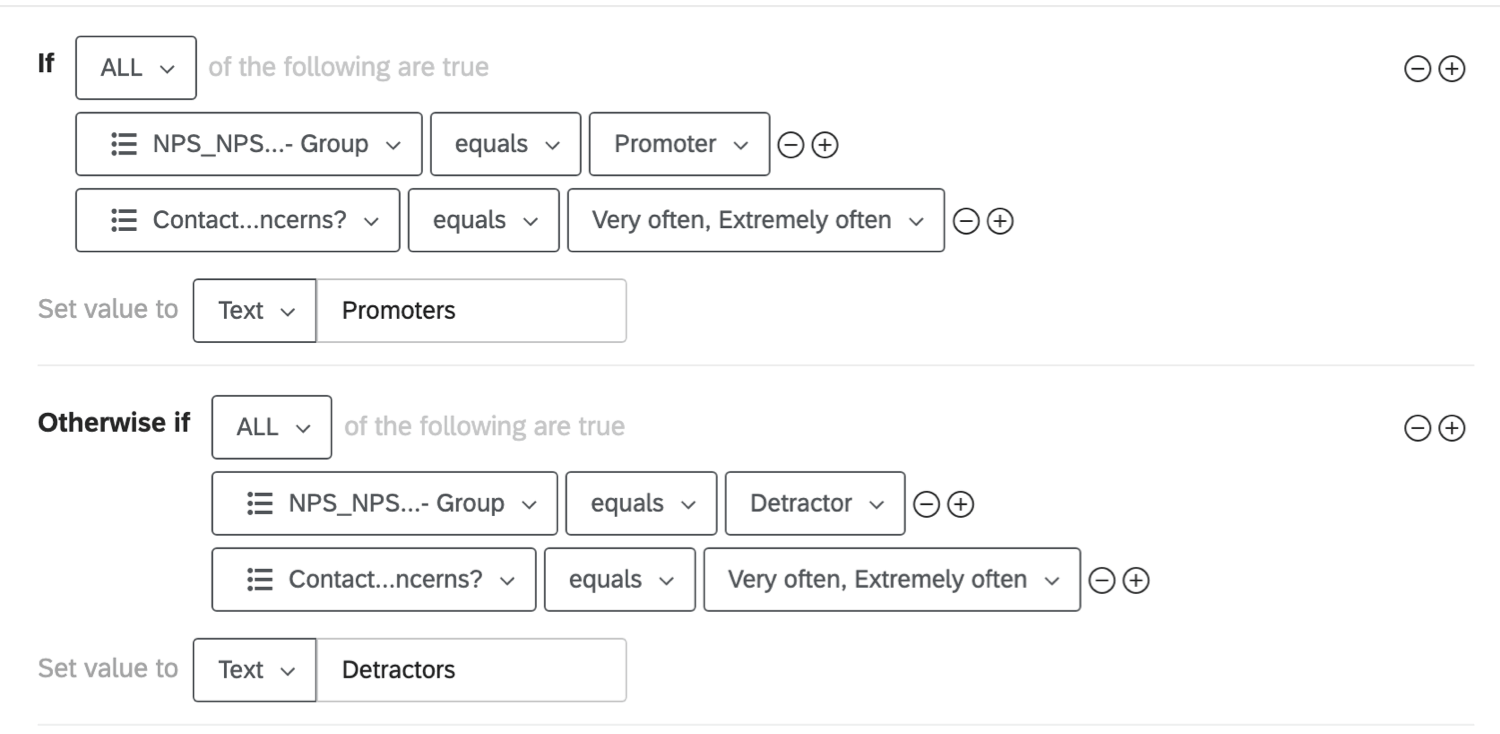
Crosstabs allows you to create new column variables that combine data points in order to analyze patterns in groups of responses.
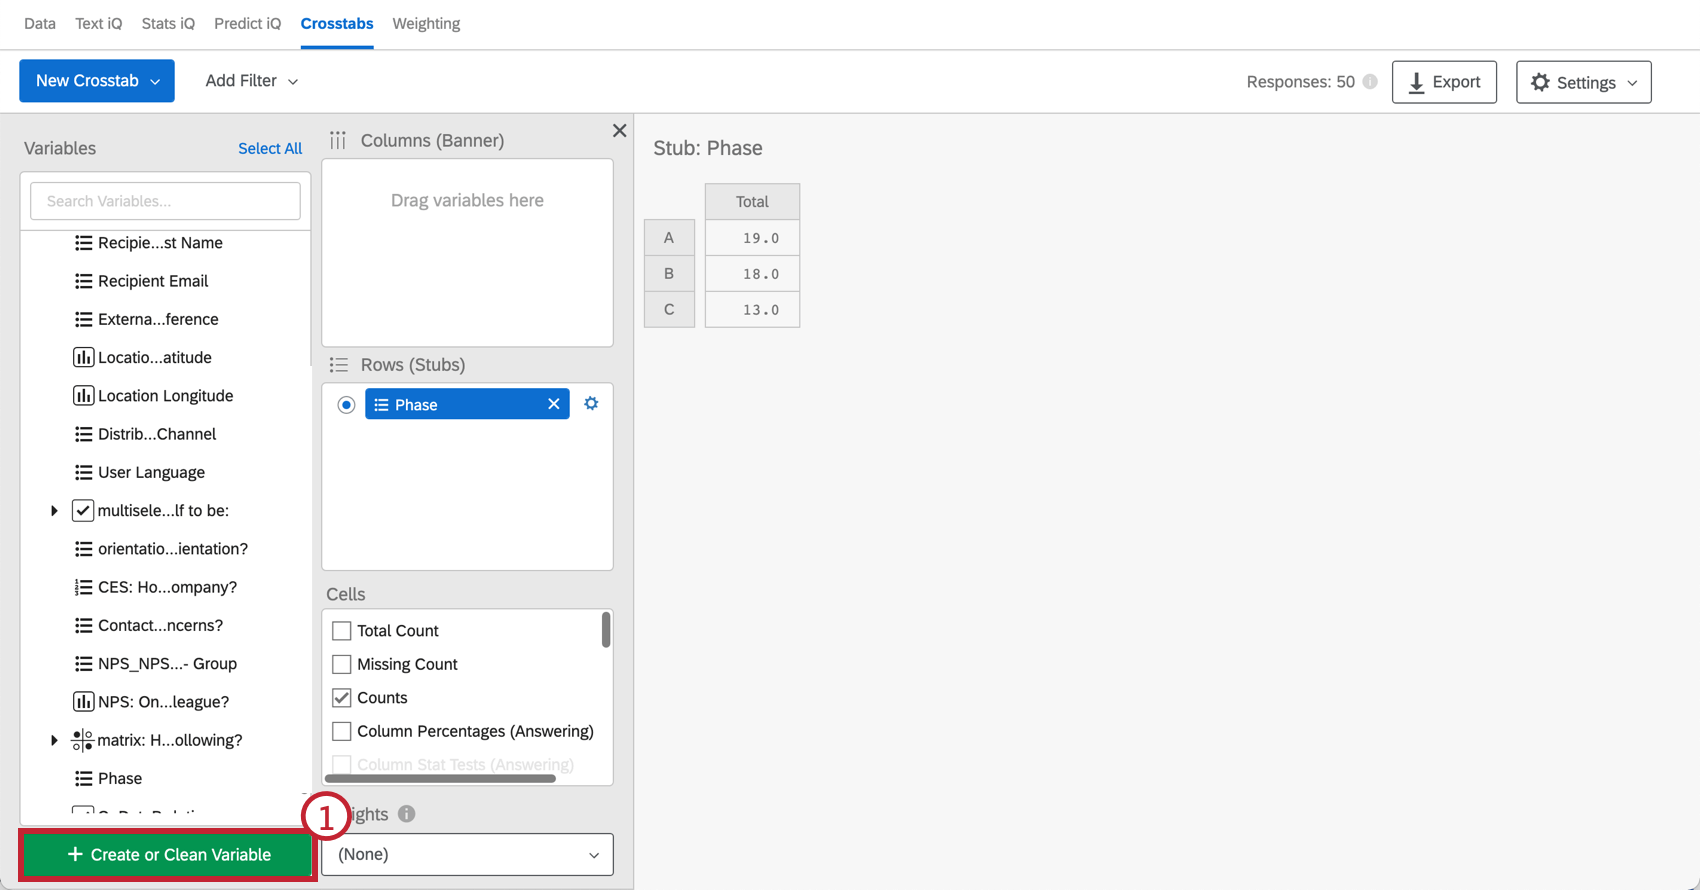
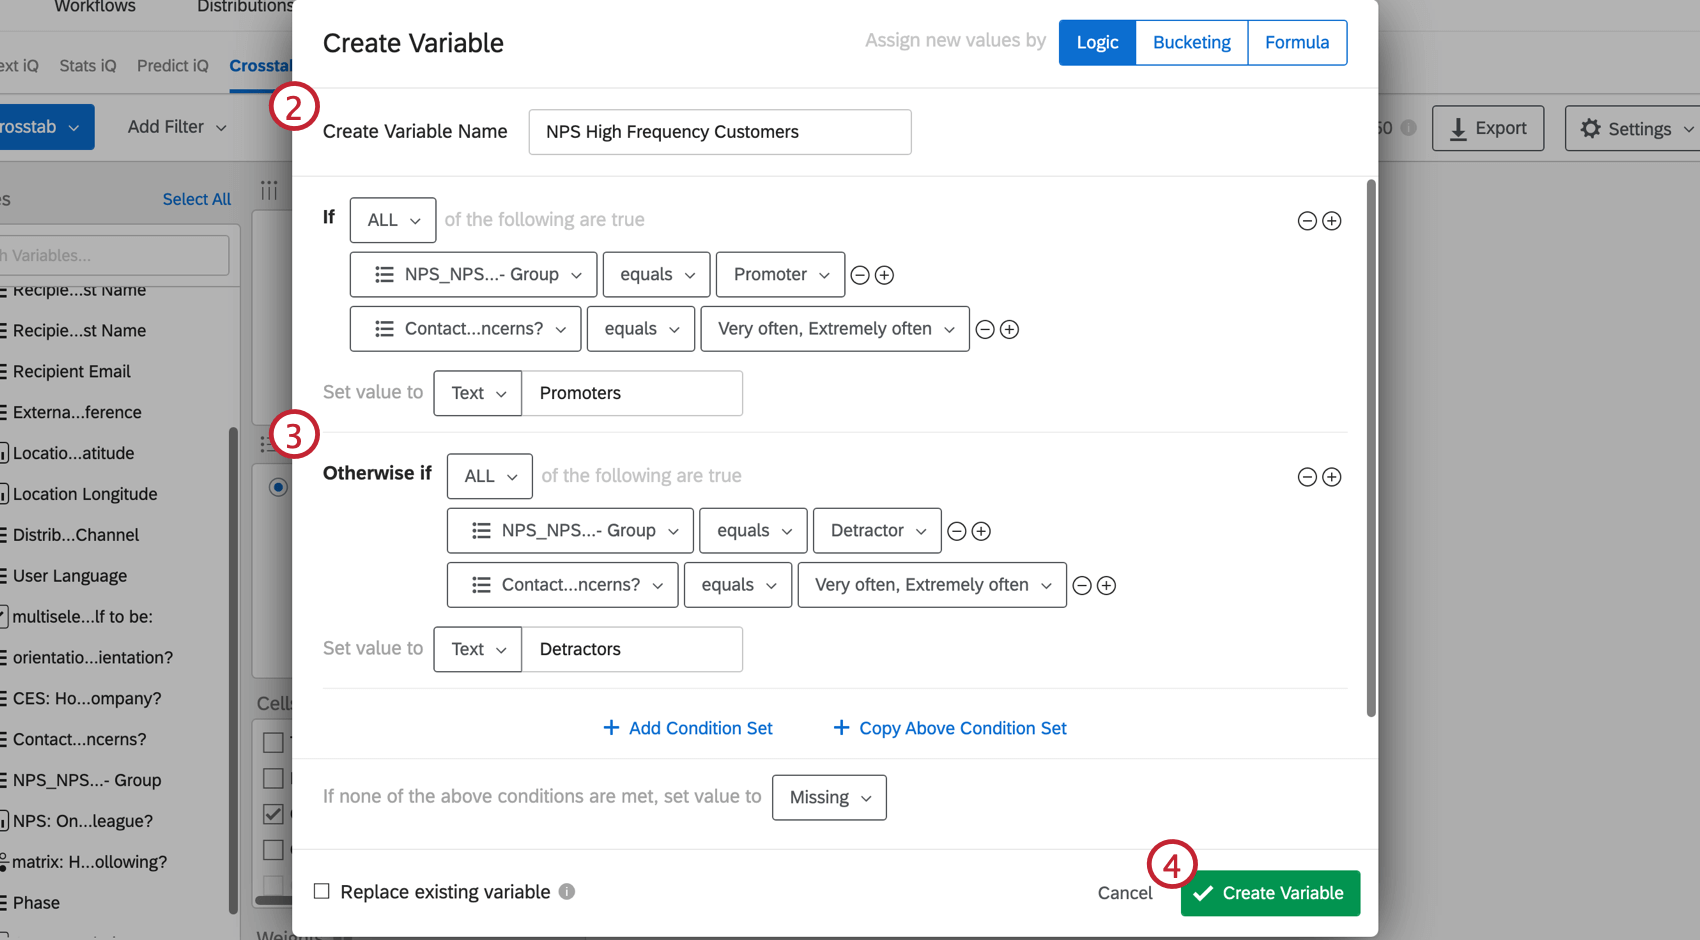
Example: Let’s say you want to look at the NPS data for customers that visit your website frequently. You could create 2 groups, each group requiring that the respondent visits your website very often or extremely often. However, the first group requires the respondent answered with a high NPS, while the second group requires the respondent answered with a low NPS. With this logic, you now have a variable that only includes high frequency visitors split into 2 NPS groups: Promoters and Detractors.

Recoding Values
Before you can generate certain statistics, such as finding averages, or conducting an ANOVA, you must recode your variables so crosstabs knows they are numeric.
Qtip: Recode values applied in the survey will be pulled in the first time you perform a cross tabulation. After that, any edits made in the survey are disconnected from recode changes in crosstabs, and vice versa. Recode values can also differ based on the report you have selected from the Crosstabs dropdown.
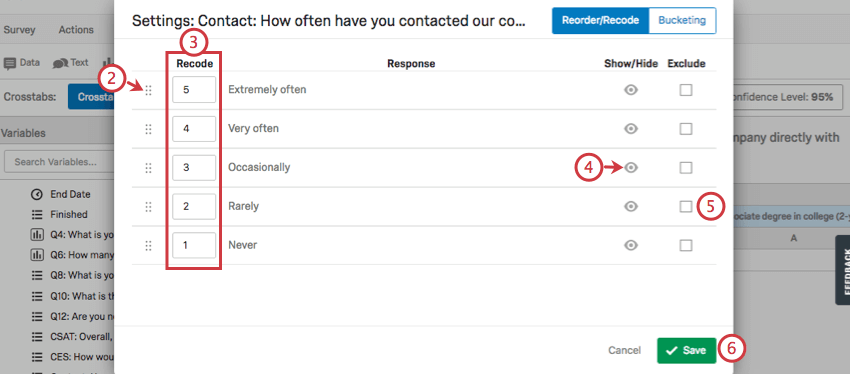
Qtip: Generally, you want these values to escalate from least to most. Thus in this screenshot, “Extremely often” is 5, and “Never” is 1.
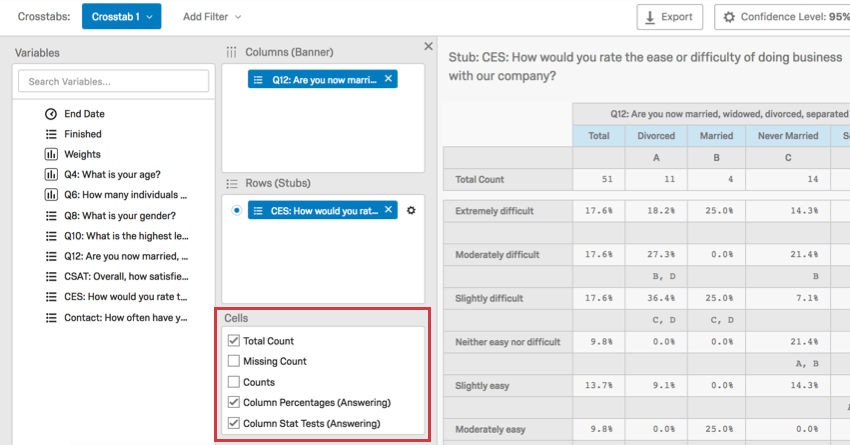
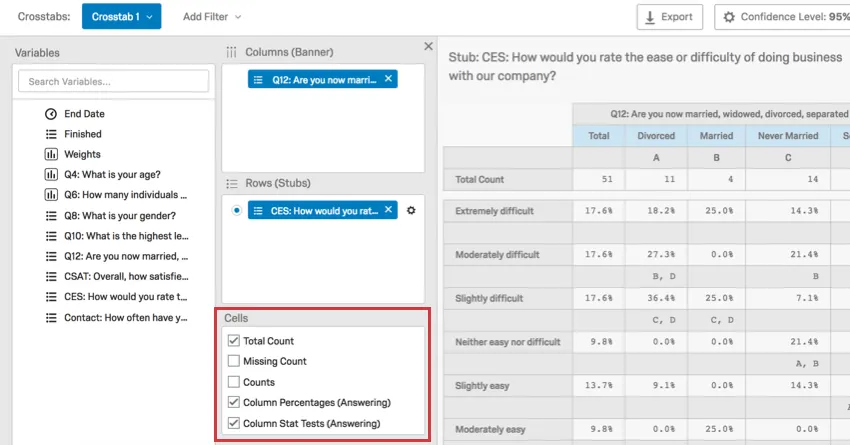
Available Calculations
There are many different kinds of data you can display in crosstabs. Each calculation can be selected in the Cell field after you have configured your columns and rows. In this section, we discuss what every option entails, and what requirements you must meet to use it.
Standard Statistics
Your column will be treated as categorical, but your row should be numeric or have recode values before you select 1 of these options. For example, with average selected, marital status added to your column, and CSAT added to your row, you will see the average CSAT broken out by marital status.
Below are the available statistics you can display.
- Average
- Median
- Standard Deviation
- Standard Error
Column Counts
When selected, the following columns will display the count, which is the number of respondents.
- Total Count: Adds a column that lists the total number of people who responded to both the column and row questions.
- Missing Count: Shows the number of people who answered other parts of the survey but did not answer this question, whether because it was not displayed to them or they skipped it. If there are no column variables in the crosstab, the missing count will represent respondents who did not answer the row question. If there are column variables in the crosstab, the missing count will represent respondents who did not answer the row question but did answer the column question.
- Counts: Shows how many people from each category of the column gave each available answer for the question selected in the row.
- Bucketed Counts: If you have bucketed your selected row, this will show how many people from each category of the column fit into each bucket.
Column Percentages
Values are rounded to the nearest 1 decimal point. Columns add up to roughly 100%.
- Column Percentages (All): Gives the percentage of those in each column category that gave each answer in the selected row. Calculated using the total number of respondents to the survey.
- Bucketed Percentages (All): If you have bucketed your selected row, this gives the percentage that those in each column category fit into each bucket. Calculated using the total number of respondents to the survey.
- Column Percentages (Answering): This is specifically for questions with display logic applied, meaning there are respondents who might not answer the question because they don’t see it, and for multiple-answer questions, where multiple answer choices can be selected per each respondent. Gives the percentage of those in each column category that gave each answer in the selected row. Calculated using the total number of answers provided to the question, instead of total respondents. Qtip: There is something to keep in mind for Column Percentages (Answering) if you’ve used a multiple-answer question or group as the stub. If any of the choices had choice display logic applied to them, you will not see a Total (Answering) column like usual; instead you will see a discrete value for each of the choices, since the denominator used to calculate them will vary based on the number of respondents who could see the choice.Qtip: There is something to keep in mind for Column Percentages (Answering) if you’ve used a matrix table as the stub. Regardless of whether any matrix questions were hidden via display logic or skipped by the respondent, the Total (Answering) field will display the number of respondents who answered every question. That said, all the calculations are correct – if respondents skipped a question, that stub will not use the Total (Answering) value as its denominator; instead it’ll use the actual number of respondents who answered the question.
- Bucketed Percentages (Answering): This is specifically for questions with display logic applied, meaning there are respondents who might not answer the question because they don’t see it, and for multiple-answer questions, where multiple answer choices can be selected per each respondent. If you have bucketed your selected row, this gives the percentage that those in each column category fit into each bucket. Calculated using the total number of answers provided to the question, instead of total respondents.
Qtip: If Column Percentages (Answering) doesn’t appear as an option (meaning it is not grayed out, but excluded from the list altogether), you can reach out to support to see whether this feature can be enabled for your account.
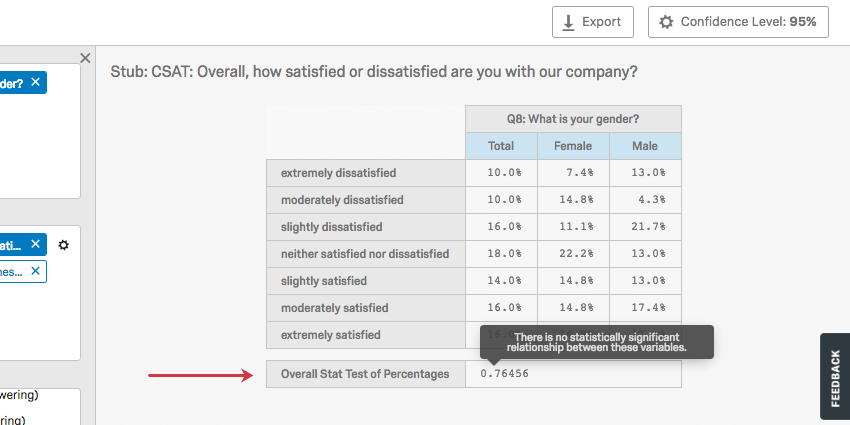
Overall Stat Test of Percentages
Qtip: You must select Column Percentages (All) before this option is available to you.
The Overall Stats Test of Percentages acts as a Chi-squared test. A chi-squared statistic tests the relationship between 2 categorical variables. This test produces a p-value to determine whether the relationship is significant or not. Hover over the p-value in your crosstab to learn whether the test was significant or not.
Example: In the screenshot below, the relationship between gender and satisfaction rating was found to be insignificant.

The Overall Stat Test of Percentages is most useful when your banner is a numeric variable and your stub is a categorical variable. You can configure when a p-value is significant by adjusting the Confidence Level.
Qtip: There are 2 ways to ensure your stub is categorical:
If you have bucketed a variable and would like to conduct a Chi Square on the bucketed version, select Bucketed Overall Stats Test of Percentages.
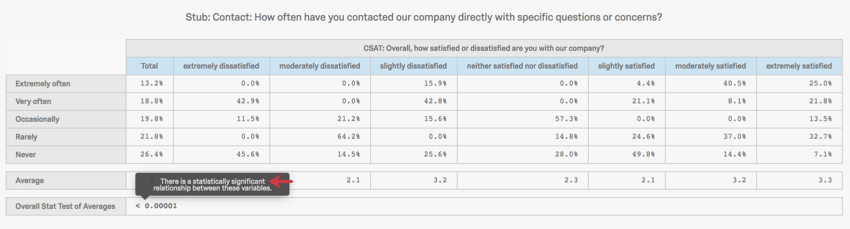
Overall Stat Test of Averages
Qtip: Banners and stubs must be recoded (made numeric) before this option will appear. You also need to make sure you have selected Averages.
The Overall Stat Test of Averages acts as an Analysis of Variance (ANOVA). An ANOVA tests the relationship between a categorical and a numeric variable by testing the differences between 2 or more means. This test produces a p-value to determine whether the relationship is significant or not. Hover over the p-value in your crosstab to learn whether the test was significant or not.
Example: This ANOVA’s results are significant.

You can configure when a p-value is significant by adjusting the confidence level.
Column Stat Tests
Column Stat Tests (All) is a pairwise z-test. Z-tests use the standard deviation to determine if 2 data samples are different from each other. Z-tests are similar to t-tests, but z-tests are more common where the sample size is larger (generally over 30).
Qtip: Before selecting Column Stat Tests (All), please select Column Percentages (All).
Column Stat Tests can be performed on bucketed variables by selecting Bucketed Column Stats Test (All).
Column Stat Tests (Answering) is also a pairwise z-test. The major difference between (All) and (Answering) is that instead of being based on number of responses, (Answering) is based on number of answers to a question. This is helpful in situations involving display logic, since there are respondents who might not answer the question because they don’t see it, and for multiple-answer questions, where multiple answer choices can be selected per each respondent.
Stat Test of Column Averages
Qtip: Banners and stubs must be recoded (made numeric) before this option will appear. Averages must also be selected before this option can be selected.
The Stat Test of Column Averages is a pairwise z-test. Z-tests use the standard deviation to determine if two data samples are different from each other. Z-tests are similar to t-tests, but z-tests are more common where the sample size is larger (generally over 30).
In this case, the column averages are being compared.
Interpreting Significance of Pairwise z-tests
This section explains how to interpret the results of the following:
- Stat Test of Column Averages
- Column Stat Tests (All)
- Bucketed Column Stats Test (All)
When values are compared, the set confidence level is used to determine how sure we are that this difference is statistically significant. Every column is compared with 1 another to determine which column has the higher statistically significant higher value.
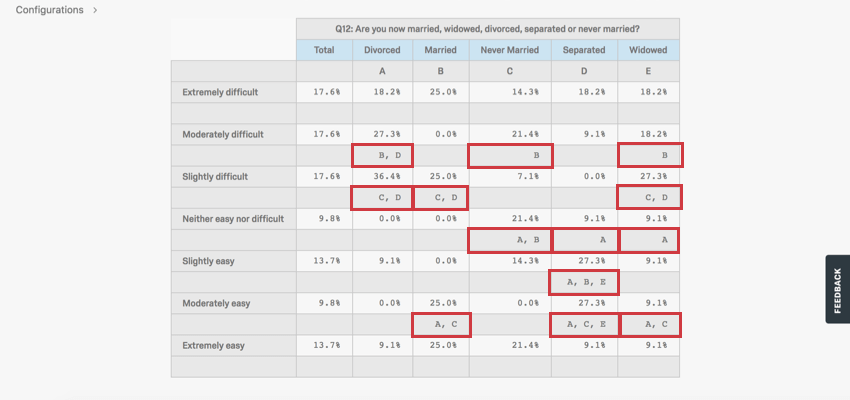
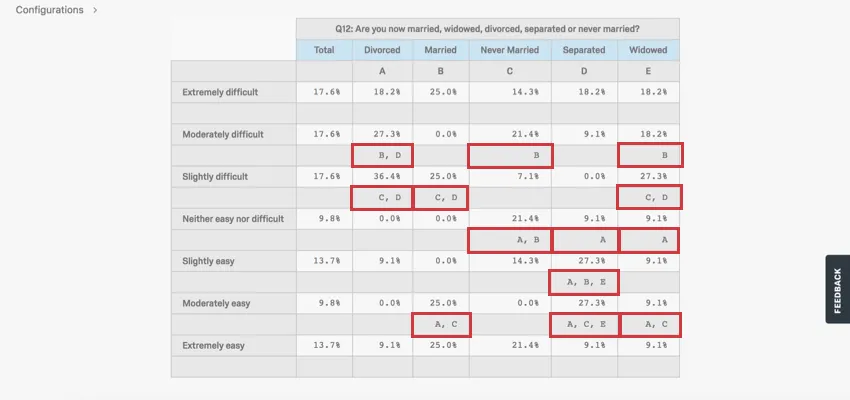
In the example above, we look at how respondents of different marital statuses rated how easy it was to apply for vacation days at their shared workplace. We can draw several conclusions from these results.
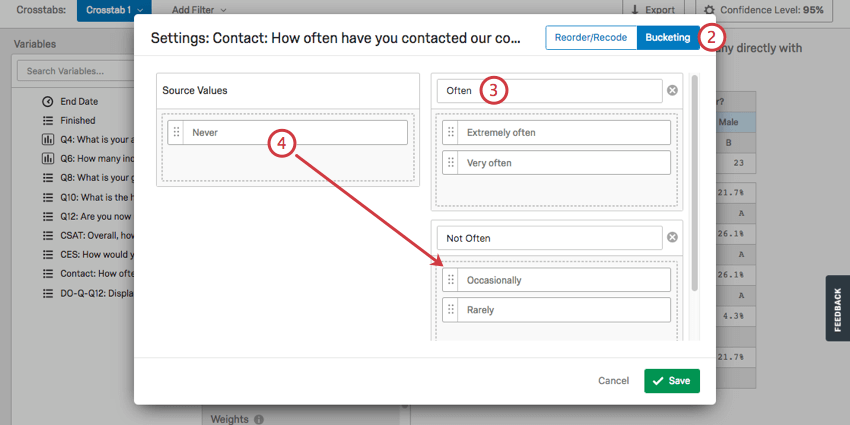
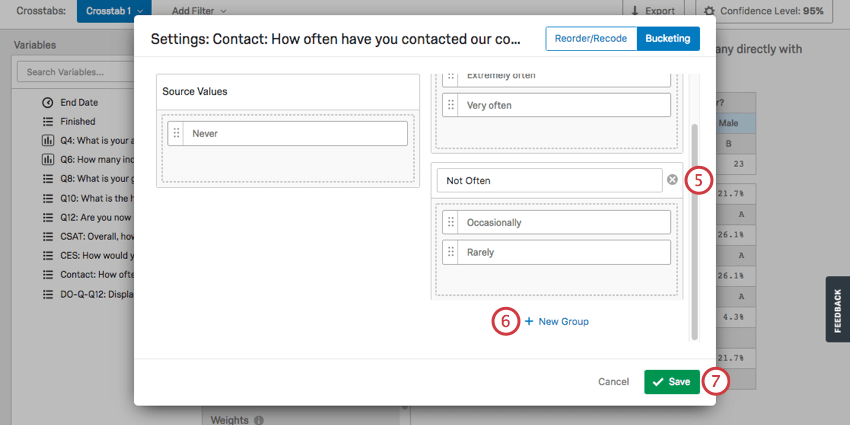
Bucketing Variables
Bucketing allows you to combine choices from previously existing questions into new groups. For example, let’s say you internationally distribute a survey asking what country each respondent lives in. After data collection, you realize you don’t want to do analyses on the countries, but the whole continents. Bucketing would allow you to group each country by continent, so you could analyze your data that way instead.
None of the cells with “Bucketed” in the name will be available until you set up bucketing.
Qtip: Bucketed variables in the Data section are separate from bucketed variables in the crosstabs section.
Using Imported Data with Crosstabs
Imported data and embedded data are compatible with crosstabs, but must be added to survey data before you create your first crosstab. Crosstabs are compatible with the Text, Text Set, Number Set, Number, and Filter Only formats of embedded data.
FAQs
I don't have the tab described on this page! What do I do?
I don't have the tab described on this page! What do I do?
What is the largest size dataset I can analyze?
What is the largest size dataset I can analyze?
That's great! Thank you for your feedback!
Thank you for your feedback!