Creating A Data Model (EX)
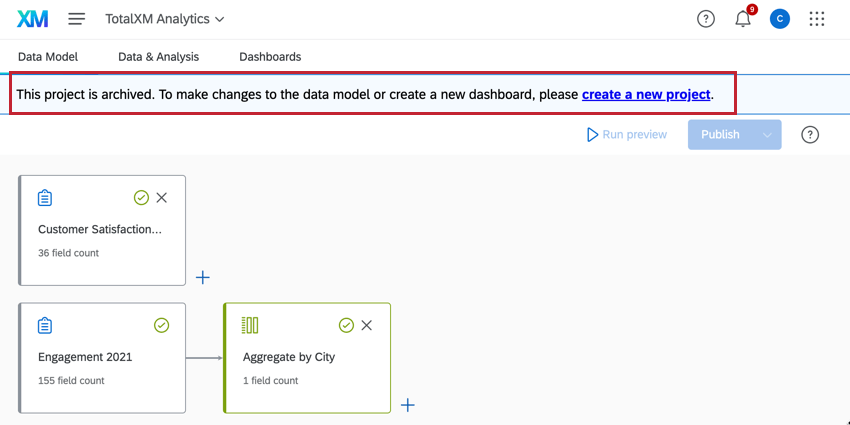
About Creating A Data Model
After creating a new Employee Journey Analytics project from scratch, the next step is to set up a data model to join two or more of your existing data sets. Within the data model you are able to add data sets, join data sets, filter your data, and create an output data set that will be used for analysis.
Just about any type of Employee Experience project’s data can be mapped to your Employee Journey Analytics model. For a list of compatible project types, see this table.
Adding & Editing Sources
The first step when creating your data model is adding a source.
- Navigate to the Data Model tab within your Employee Journey Analytics project.
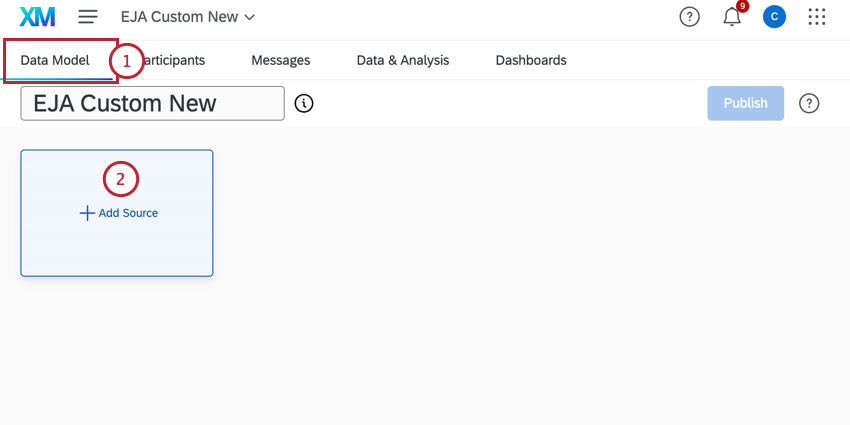
- Click Add Source.
- Under Source Data, choose an EX project to use for the data model. Use the search bar and All source types menu to find a source.
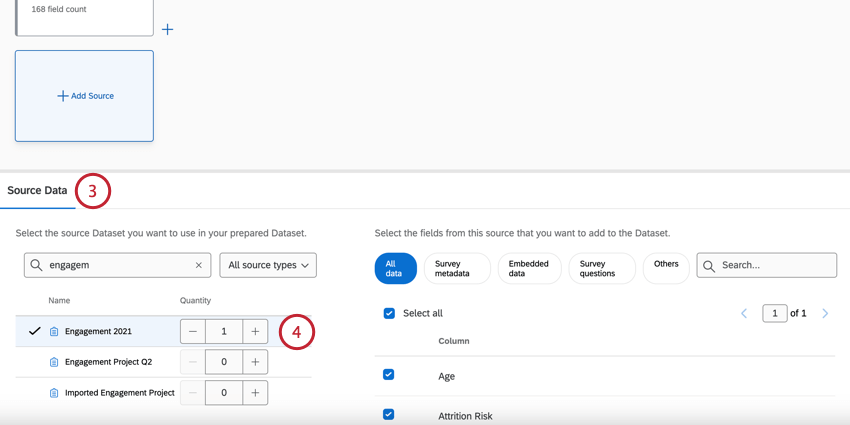 Attention: Only projects you have access to will appear in this list. If any projects are not showing up, make sure they have been collaborated with you.
 - When you’re ready to select a source, adjust the Quantity to 1 (or more, if desired).
Qtip: It can be useful to add the same source more than once if you plan to perform separate unions and joins in your dataset. You cannot create a union or a join with multiple copies of the same source.
- Select all the fields you want to include in your dataset. You can click on different types of data, like “Survey questions”, to see only those fields, or use the search bar to search for specific fields.
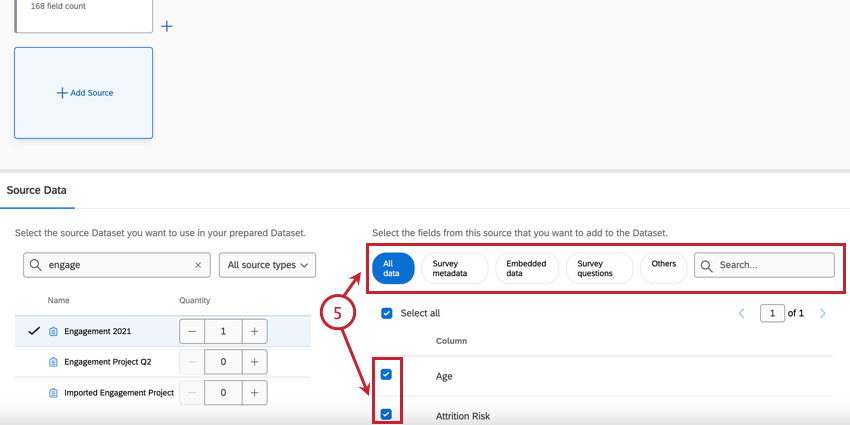 Qtip: When selecting fields to include in your data model, think about which fields will be important when analyzing your data. Fields that are commonly included are survey questions, important metadata, and the field you plan on using to join your data sets.
 - When you have finished selecting fields, click anywhere on your data model to return to it. Your selections will be saved automatically.
- Repeat steps 2-5 for each project you want to add as a data source.
Qtip: If you are adding two or more surveys to your data model that contain the same employee and organization data, you may only want to include one set of this data. Including the same fields twice will create duplicates in your output data set and dashboard.
Editing a Source
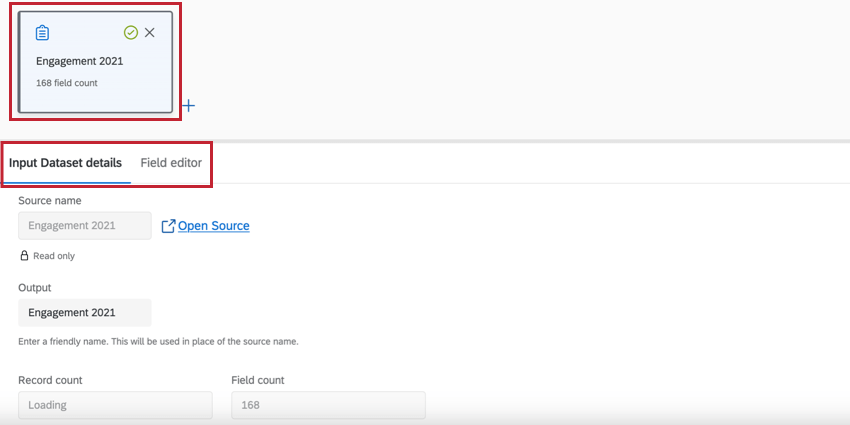
- Input dataset details: This tab shows the source name of the data set, the number of records in the source, and the number of fields in the source. You can also edit the output name of the source, which is what appears in the data model.
Qtip: Editing the output name will not change the name of the original source.
- Field editor: This tab shows the fields you selected when adding the source, as well as their field type. You can also remove fields, edit fields, recode fields, and add new fields here.
Attention: Any edits made here will cause connections that modify the data source to be reset. Field edits should be done before adding connections that modify the data source.
Removing a Source
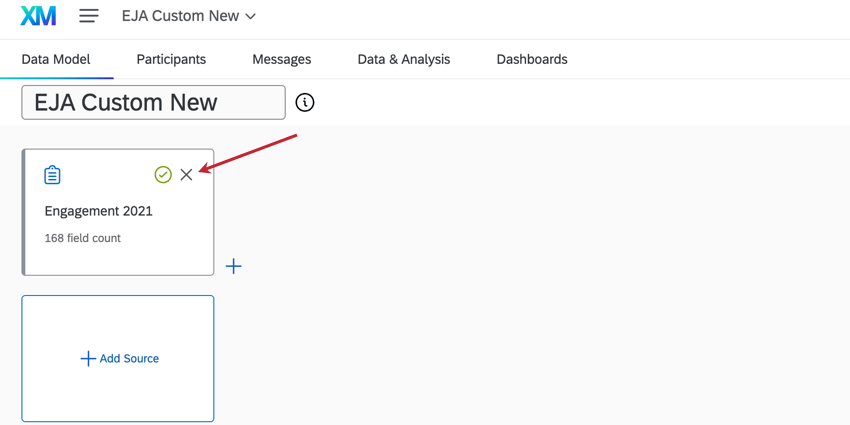
If you have added a source to your data model but decide you no longer want it, click the x to remove it.
Modifying Data Sources
The elements of your data model can be modified by filtering rows or editing columns. Both of these options affect which data will appear in the outcome data set. For example, you may want to add a filter to your sources so that only data from the last 12 months is displayed, allowing you to analyze trends over the last year.
Filtering Rows
This section covers the basics of adding a filter within your data model. For more information on filters and building filter conditions, see Filtering Responses.
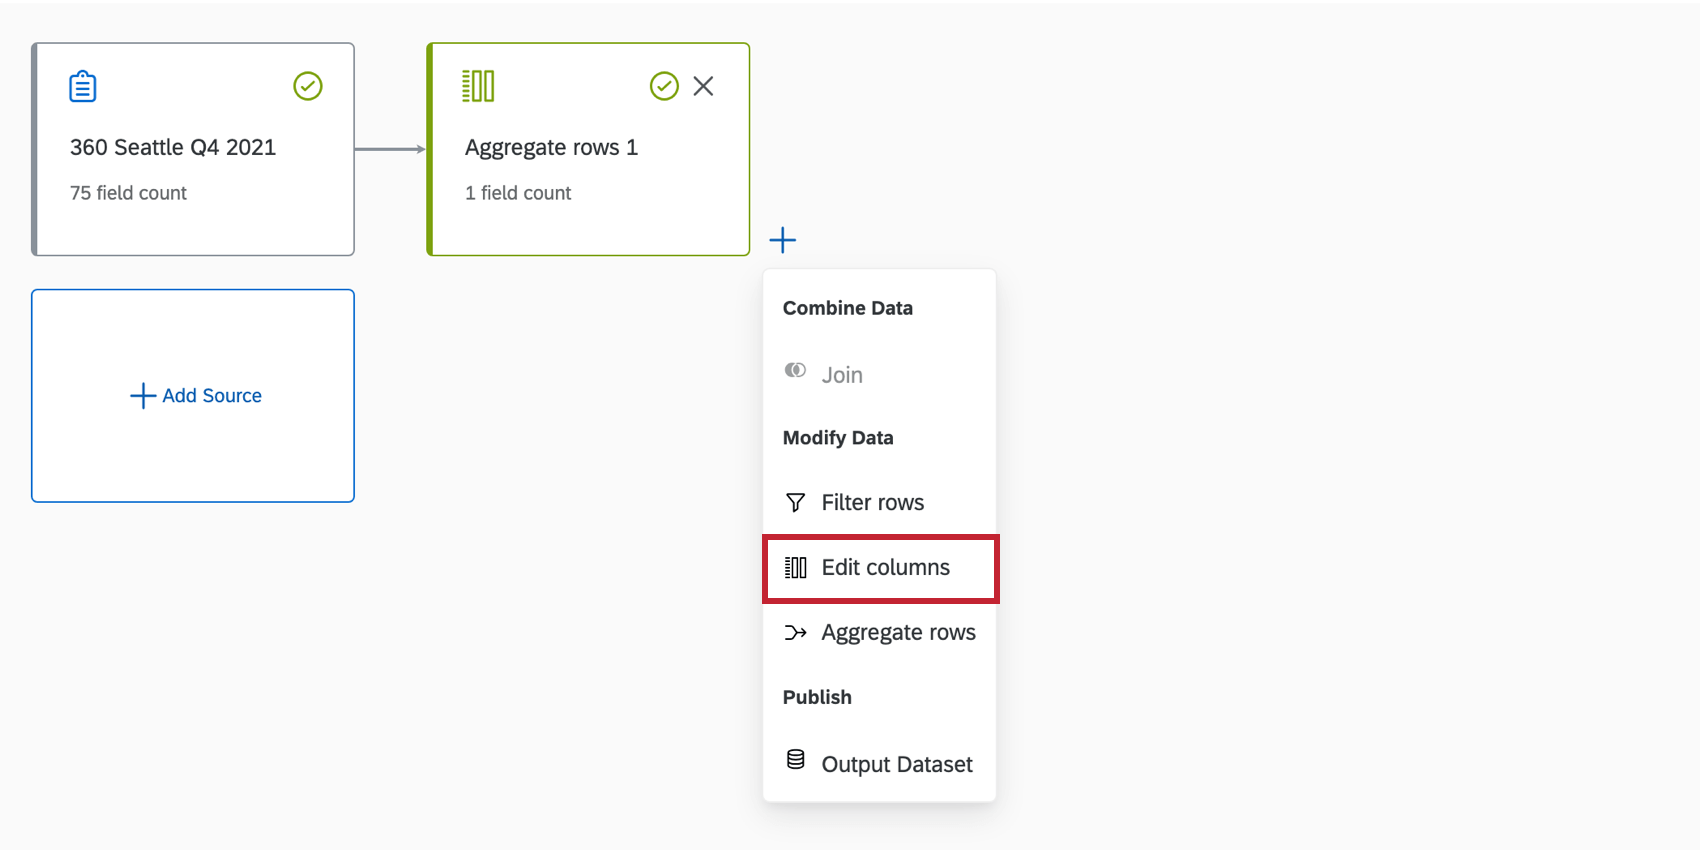
- Click the plus sign (+) next to the element you want to filter.
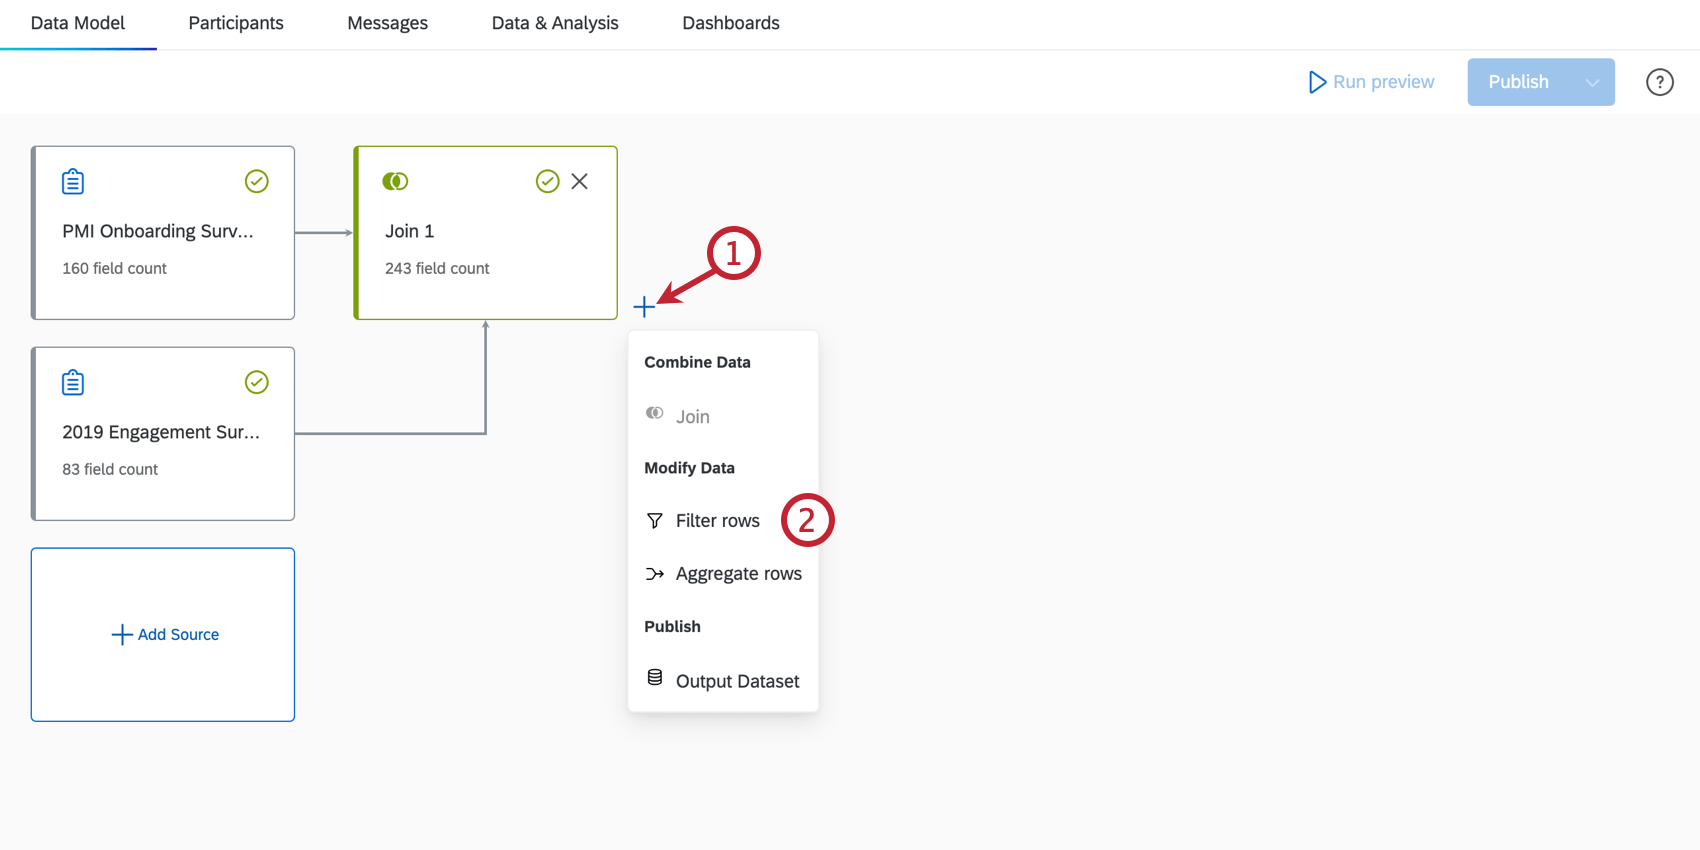
- Click Filter rows.
- Click into the Output field to edit the name of the filter if desired.
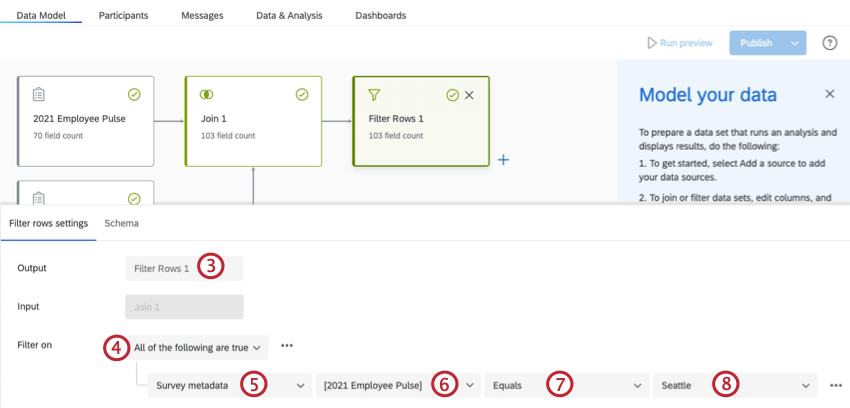
- Choose whether all conditions need to be met for a record to appear in a filter, or if only some of them need to be met. See All vs. Any for more information.
- Select a data type for the filter. If you want to create a filter based on fields from a survey project, select either Embedded data or Survey metadata. If you want to create a filter based on fields from an Imported Data Project, select Others.
- Select a specific field for the data type you selected.
- Select a condition for the filter.
- Select a value for the filter. In the above screenshot, the joined data is being filtered to only include employees that are in the Seattle office.
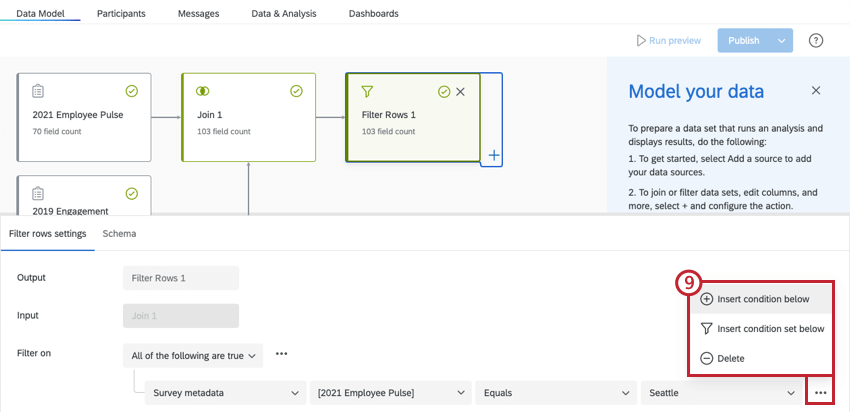
- Click the three horizontal dots next to the first condition to add additional conditions or condition sets, or delete the condition.
- If desired, click the Schema tab to view the fields in your data set, as well as their field type.
Qtip: Use the field editor tab to make any changes to the fields.
- When you have finished setting up your filter, click anywhere on your data model to return to it. Your selections will be saved automatically.
Editing, Removing, and Adding Fields
- Click on the component you would like to edit.
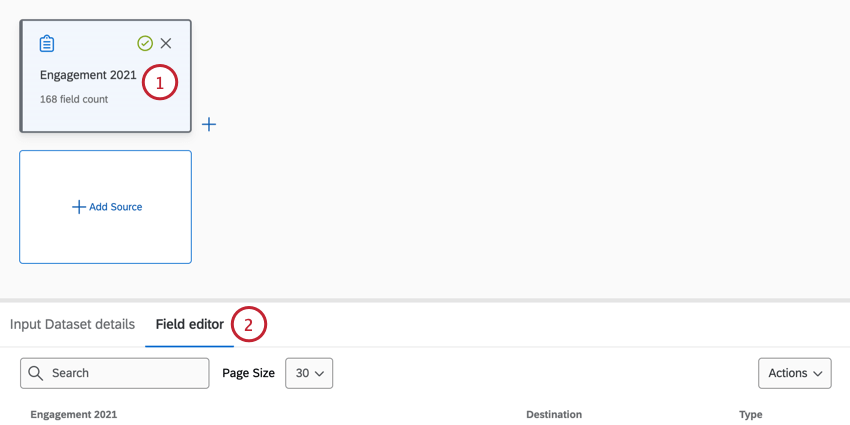 Qtip: Source components and aggregate row components cannot be edited.
 - Click the Field editor.
- Click on the field you’d like to modify.
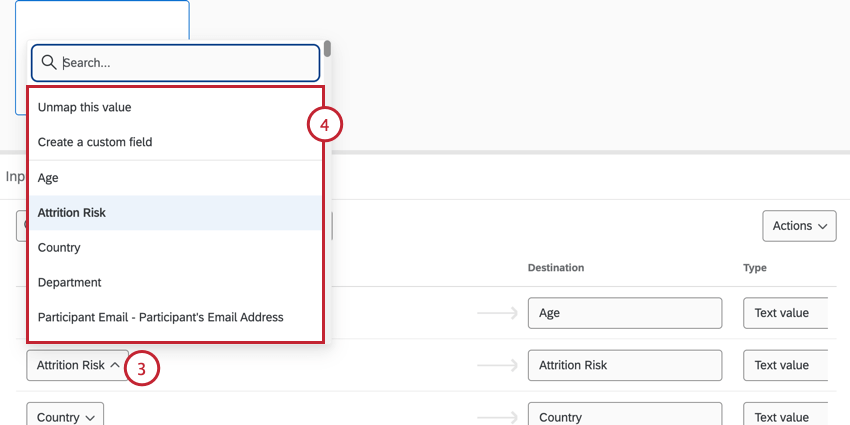 Qtip: Use the search bar to search for specific fields.
 - You can change the input used for this by choosing one of the following:
- Unmap this value: Unmaps the field from the dataset. The field can be remapped later, if needed.
- Create a custom field: Allows you to create a new field in the dataset.
- Another field: The other fields from your dataset will be listed here. You can choose one of them instead
- You can change the field’s name in your dataset by typing a new name in the Destination field.
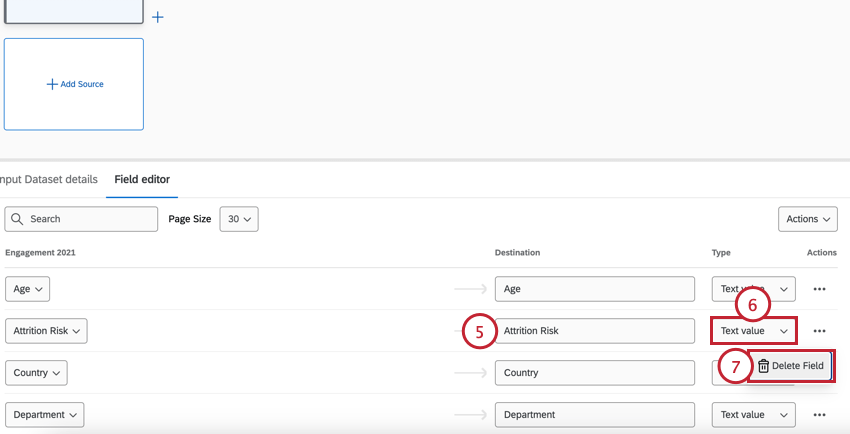
- You can change a field’s type using the Type menu.
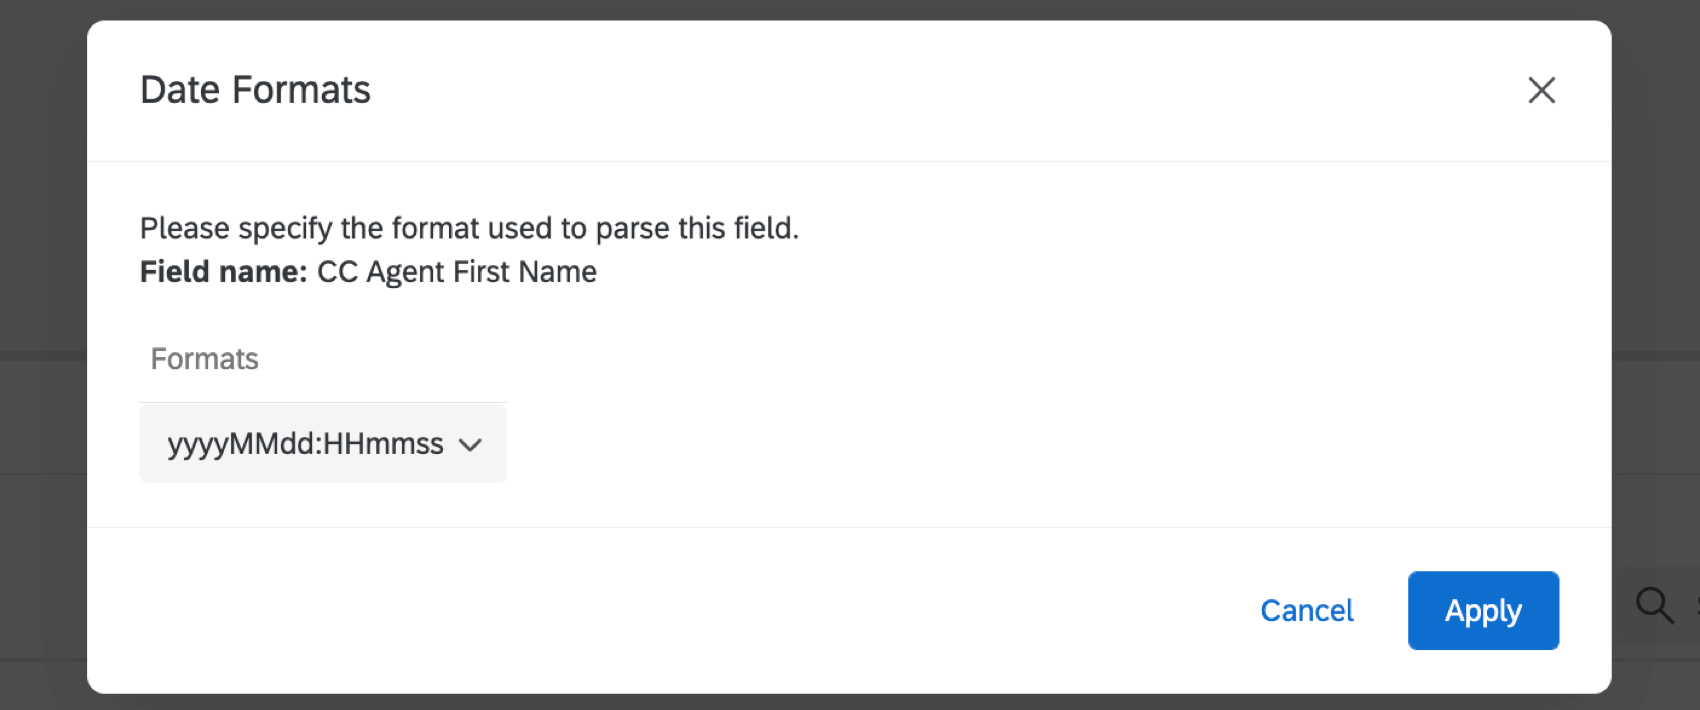
Qtip: If you select Date as the field type, you will have to specify a date format. Choose a format from the dropdown and then click Apply. See Date Format Syntax for more information.
- To remove a field from your dataset entirely, click the Actions three dot menu and click Delete Field.
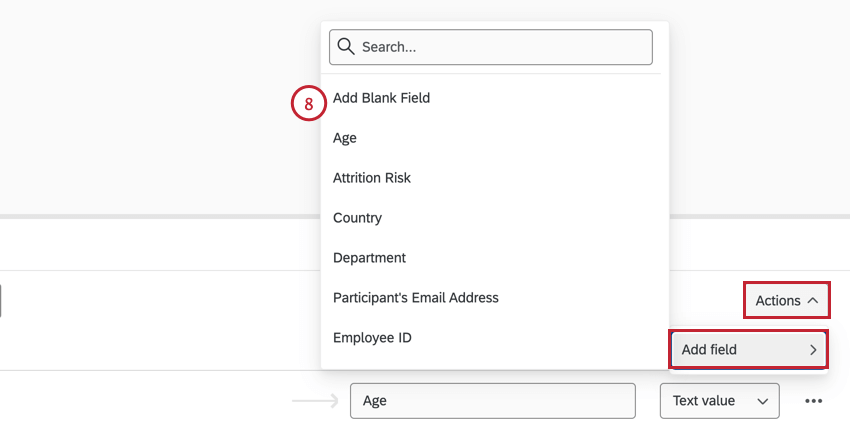
- You can create entirely new fields from scratch by clicking the Actions dropdown menu and then selecting Add Blank Field. A new field will be added to your dataset and you can then repeat the above steps to edit and map the field as needed.
- When you have finished editing your fields, click anywhere on your data model to return to it. Your changes will be saved automatically.
Combining Data Sources
Once you have added at least two sources to your data model, you can begin combining them.
- While on the Data Model tab of your project, click the plus sign (+) next to one of the data sets you want to combine.
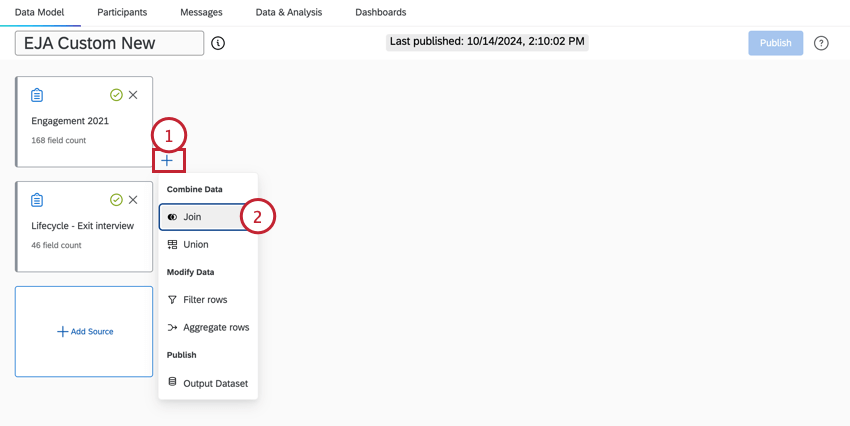
- Click Join.
- Select a Join Type. This will determine how your two data sets are combined.
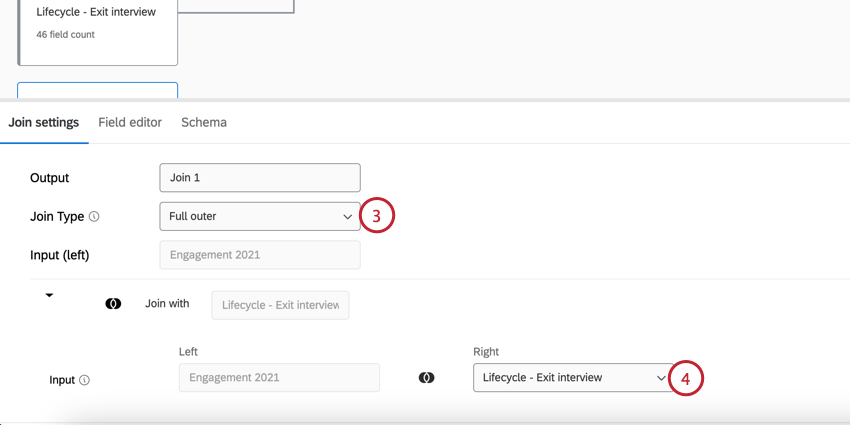
The following join types are available:- Inner: The merged data set will only include matching rows found in both data sets.
- Left outer: The merged data set will include all rows from the left input and matching rows found in the right input.
- Full outer: The merged data set will include all rows found in both data sets.
- Select a data source for your right input. Only data sources that have been added to your data model will show up here.
Qtip: When setting up a join, only data sources that have not already been selected in previous joins will appear in the dropdown.
- Set the join condition you want to use to combine your data sources. Select a field from each data source. This field should be the same in both data sets, such as employee email or unique ID.
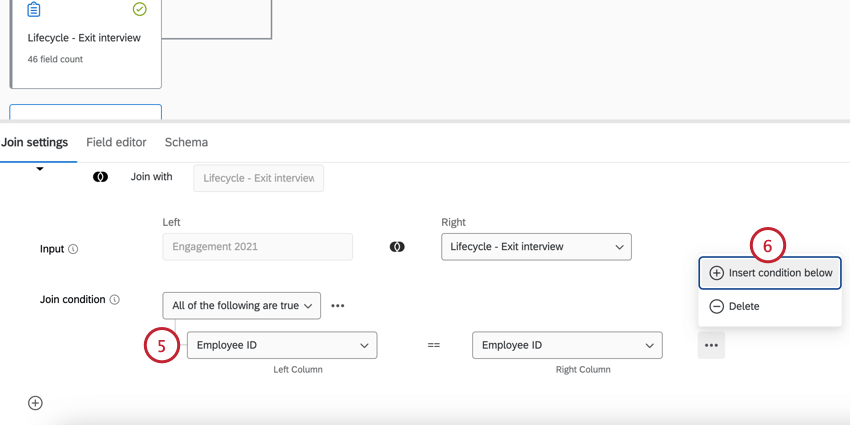
- Click Insert Condition below to create additional conditions or Delete to remove a condition.
- If desired, you can edit the fields from your input sources in the Field editor tab.
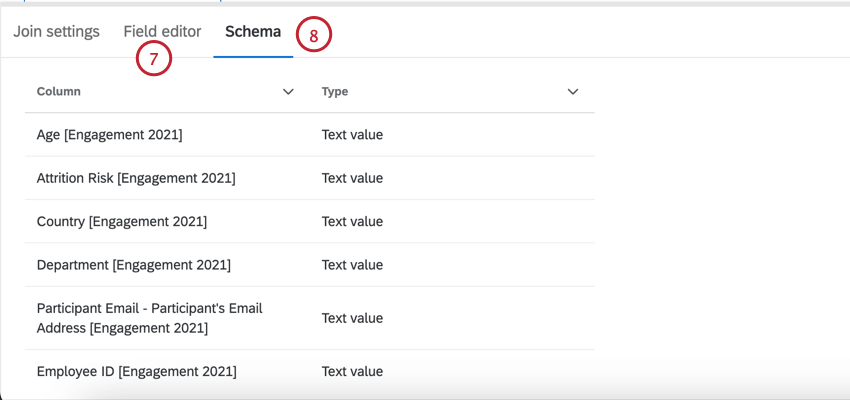
- If desired, click the Schema tab to view the fields in your combined data set, as well as their field type.
- When you have finished setting up your join, click anywhere on your data model to return to it. Your selections will be saved automatically.
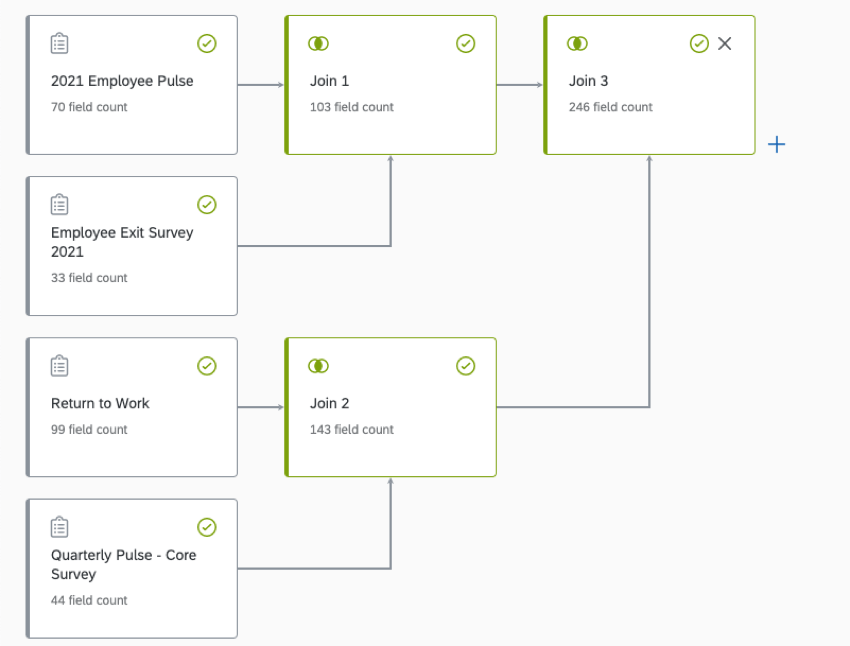
Repeat the above steps to combine additional data sets. You can also combine joined data sets to keep creating a larger output data set, as shown below.
Joining Multiple Participant Responses
Depending on your source projects, it’s possible a participant may have multiple responses in the project tied to the same unique identifier (e.g., a Lifecycle project with multiple responses enabled). The way these responses are handled in the data model is based on the source join order.
If the “right” source has duplicate join keys (i.e., multiple responses per unique identifier), then the data model will join on 1 response and drop the others. However, if the “left” source has duplicate join keys, then the values on the “right” source will be duplicated across those on the “left” source with matching join keys.
Aggregating Rows
You can aggregate rows in your data model to help you report on variables in both datasets. This is especially helpful if you have fields in your projects that represent the same data but are called different names.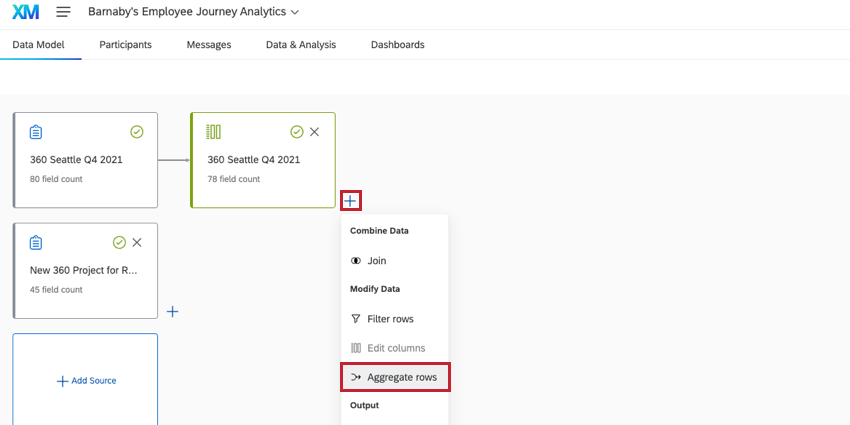
See Aggregating Data Model Rows for step by step instructions on aggregating rows. Note that while the linked page discusses EX + CX reporting functionality, the steps to aggregate data in an Employee Journey Analytics project are the same (you will use 2 EX projects instead of 1 EX and 1 CX).
Adding an Output Data Set
Once you have finished combining and modifying your data, it is time to add an output data set.
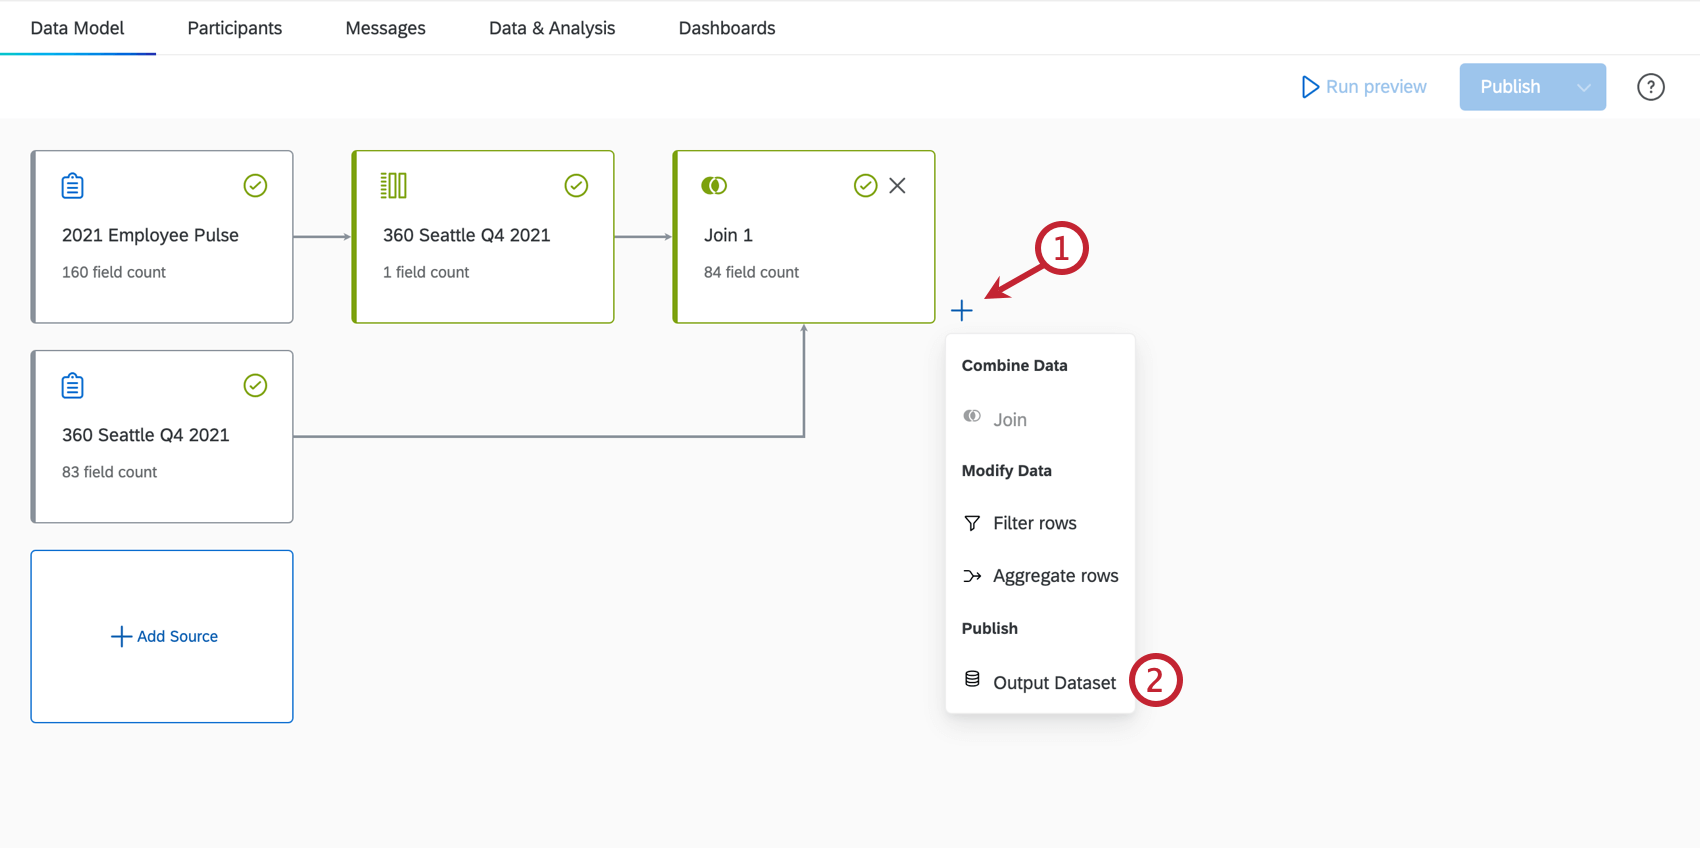
- Click the plus sign next to the last element in your data model.
- Select Output dataset.
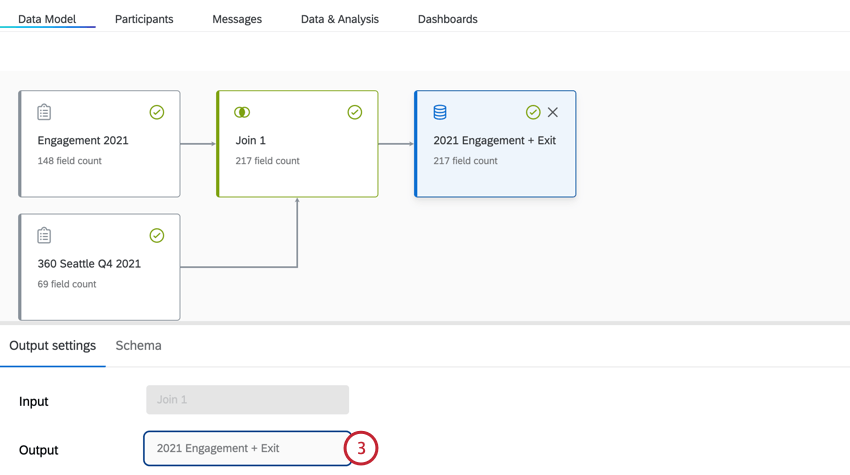
- Give the output data source a name.
- If desired, click the Dataset editor tab to view the fields in your data set, as well as their field type.
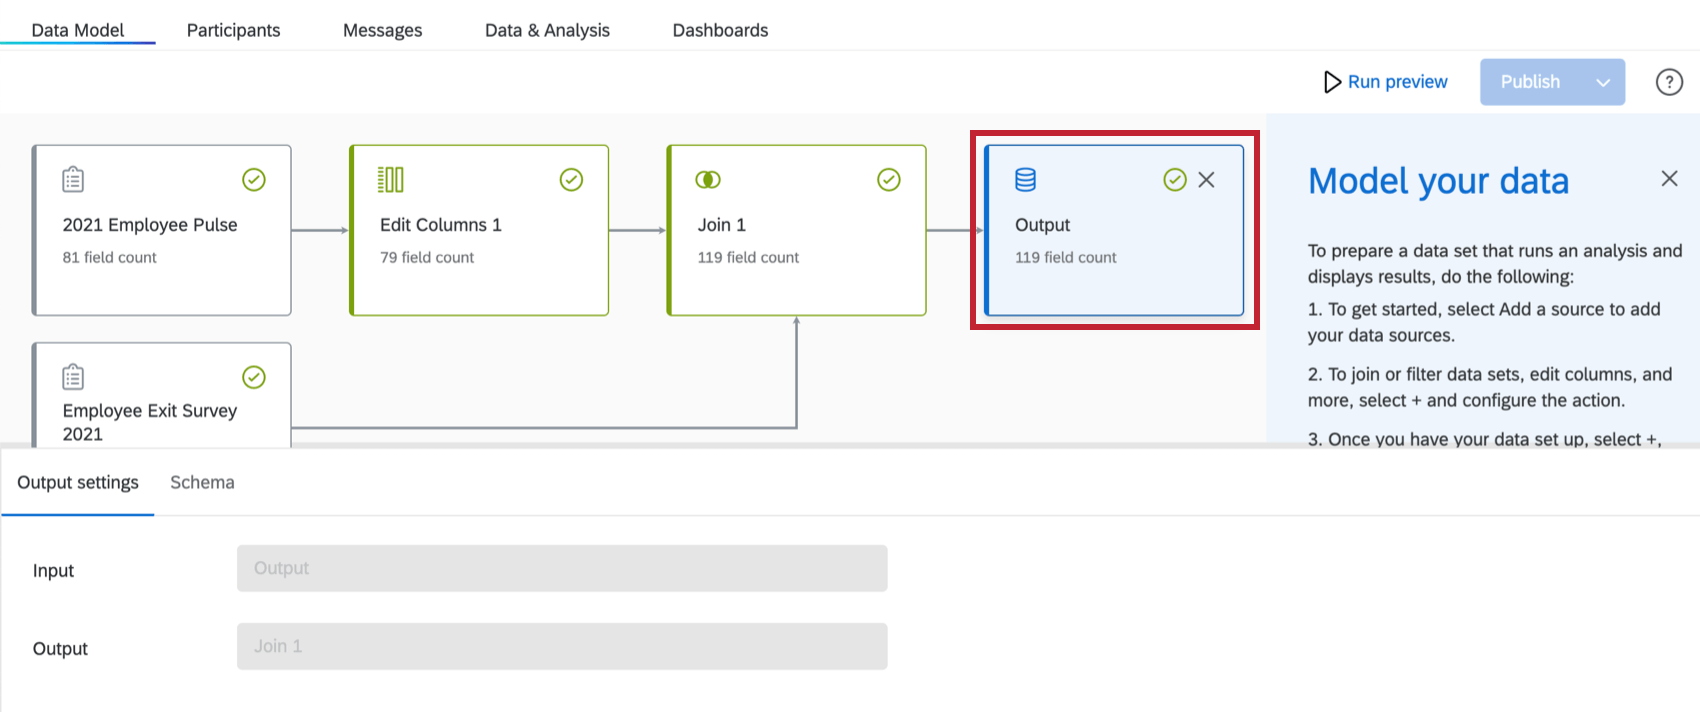 Attention: There is a limit of 1,000 columns for your output data set.
 - Click anywhere on your data model to return to it.
Previewing Your Data Model
After creating your data model, click Run preview to generate your output data set.
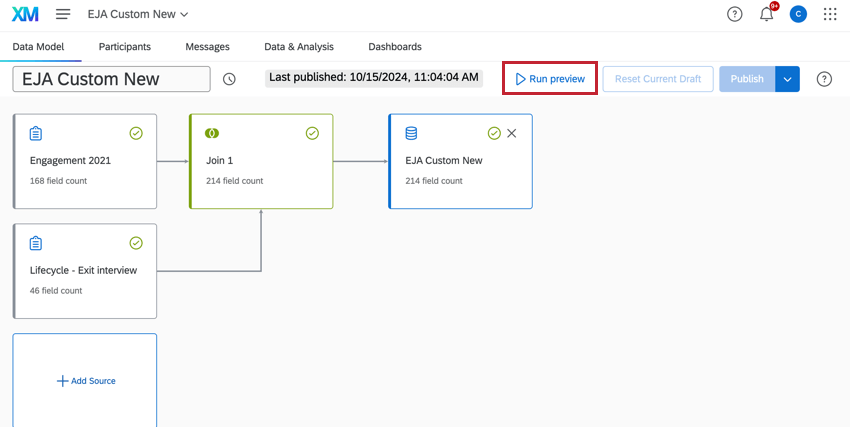
This may take a while to generate; when the preview is complete you will be taken to a preview of your data set.
