-

Qualtrics Platform -

Customer Journey Optimizer -

XM Discover -

Qualtrics Social Connect
Comment Summaries Widget (EX)
About the Comment Summaries Widget
The comment summaries widget takes your team’s responses to open feedback questions and uses AI to create insightful summaries and highlight key topics. This widget is ideal for medium and large teams and organizations, where it can be difficult to go through lots of individual responses. With the help of Text iQ, this widget allows you to quickly identify top themes and topics.
Keep in mind that you will also need to have enough responses to exceed confidentiality thresholds. To learn more about response limits for this widget, see Understanding the Comment Summaries Widget below.
Permissions
In order for dashboard editors to use this widget, a Brand Administrator must enable Allow third party generative AI features for the organization. See Organization Settings.
Once this widget has been added to a dashboard, only dashboard viewers with the Can view comment fields permission enabled can see data in this widget. To update many dashboard users’ permissions at once, see Roles.
Field Type Compatibility
Each part of this widget is only compatible with the field types listed:
- Text question fields: Open Text
- Demographic fields: Participant metadata (Text Set, Multi-Answer Text Set)
Setting Up Text iQ
Before you create a comment summaries widget, you need to set up Text iQ in your EX project.
- Go to your Engagement, Lifecycle, Pulse, or Ad Hoc Employee Research project.
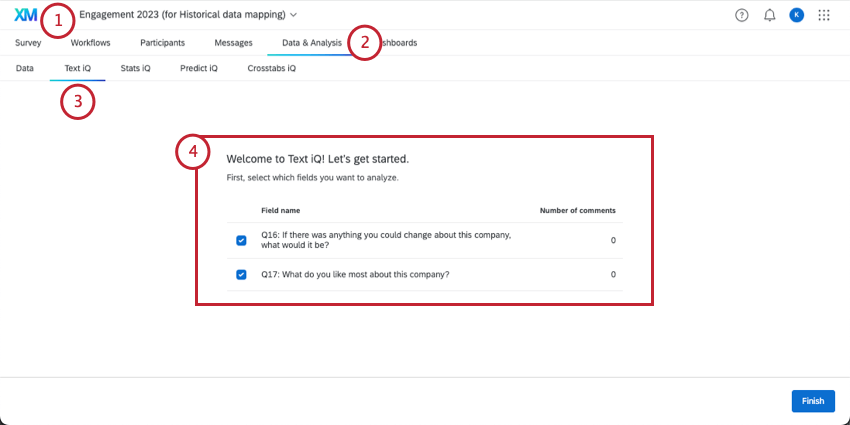
- Open the Data & Analysis tab.
- Go to Text iQ.
- If you haven’t already, set up Text iQ.
Qtip: You may need to update your dataset with enrichments.
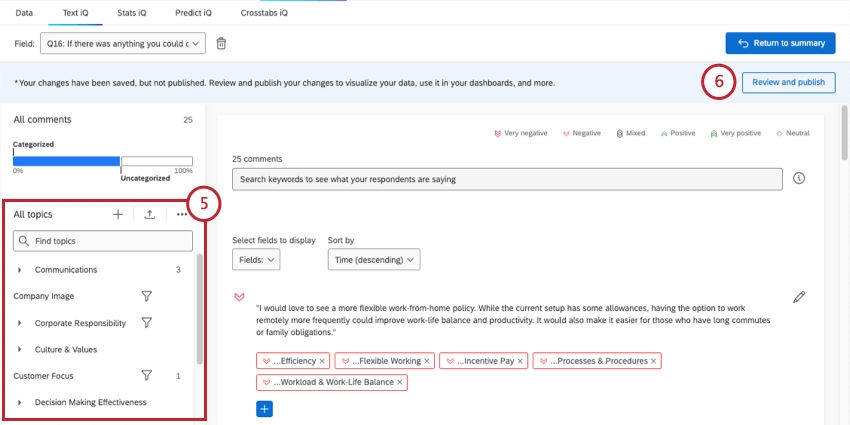
- Create topics.
 Qtip: If you’re not sure where to start, try some expert-designed topics from the Qualtrics library. We offer premade topics specifically designed for Employee Experience research!
 - Apply your changes.
Qtip: Wait until your text analysis is done loading to perform the next steps. You can leave the page while this happens.
- Follow these steps to map Text iQ data.
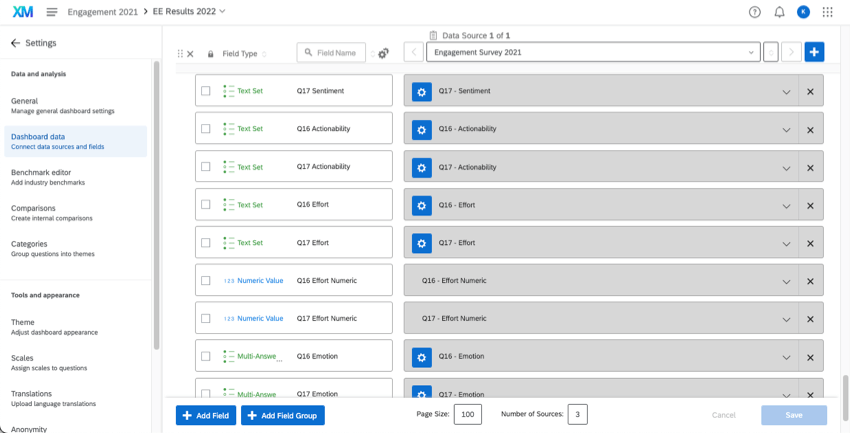 Qtip: If you have more than one source mapped to your dashboard, you need to be careful to separate your Text iQ fields, so each one is only mapped to one data source. See more details on Mapping Multiple Text iQ Sources, under “Data Mapper.”
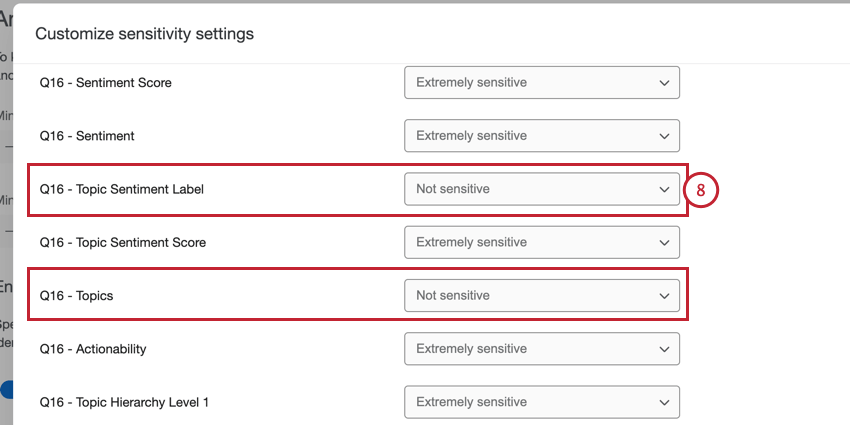
 - If you have enhanced confidentiality enabled for the dashboard, make sure the “Topics” and “Topic Sentiment Label” fields are marked as Not sensitive for any text questions used in the widget.
Creating Comment Summaries
- Select Comment Summaries from the widget menu.
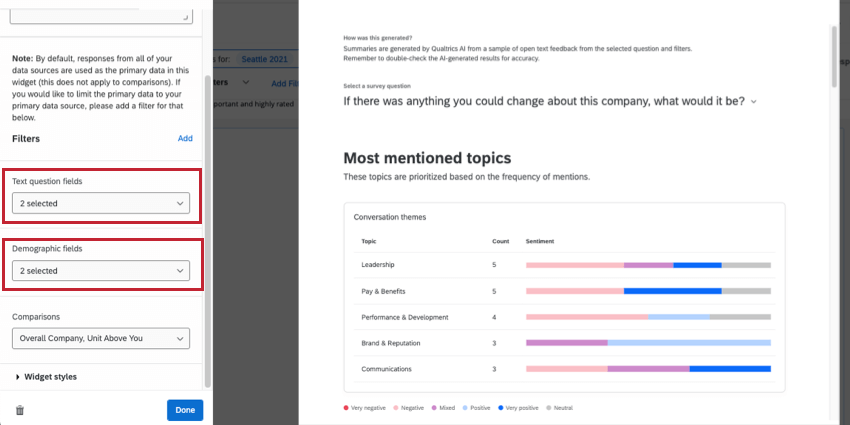
- Under Text question fields, select the text entry questions where you asked for employee feedback.
Qtip: You can select multiple questions, so long as each question’s text fields are mapped to your dashboard. Dashboard viewers will be able to switch between which question’s comment summaries they want to see using the menu pictured below.

- Under Demographic fields, select demographic metadata you’re interested in.
Qtip: If there are any statistically significant results, the widget will highlight the segments with the most significant differences. If there are no statistically significant results, you will not see any demographic-specific information.
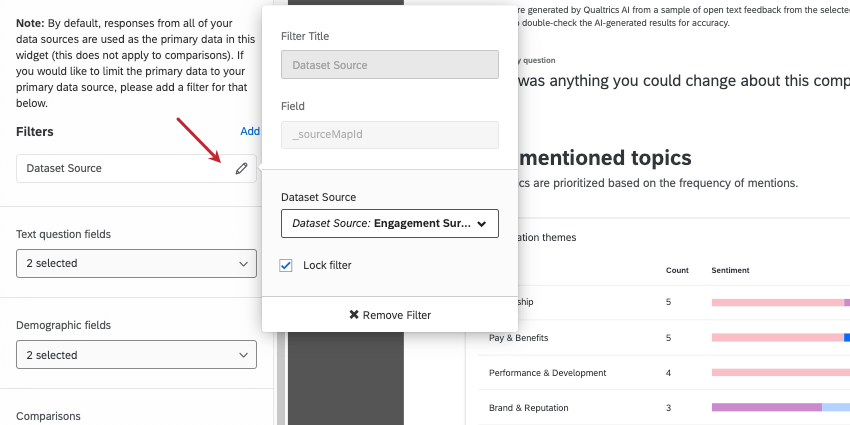
Attention: By default, responses from all of your data sources are used in this widget. If you want to limit the data included, please add a widget filter for a data source.
Comparisons
By adding comparisons to your widget, you can compare different groups’ or units’ general sentiment towards a specific topic.
You can select Comparisons to display in your widget. See how to create comparisons.
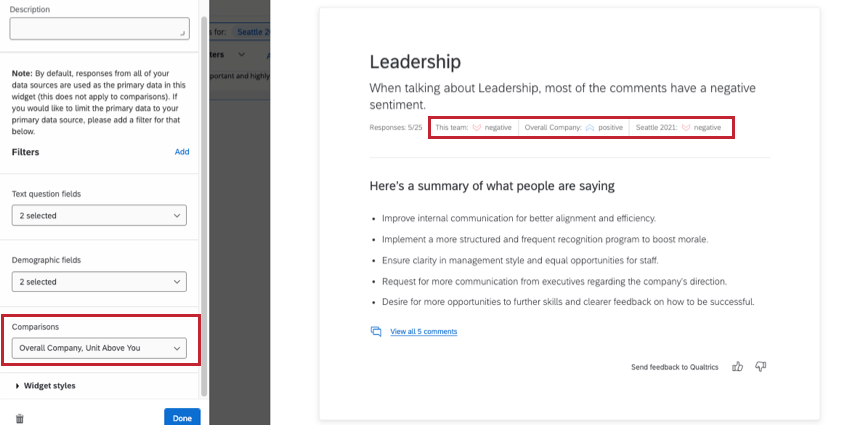
As you add comparisons to your widget, they’ll appear with each of the topic summaries to show how the current team’s overall sentiment compares to each of the comparison groups.
Widget Customization
There are 2 unique display options available for customizing your comment summary widget:
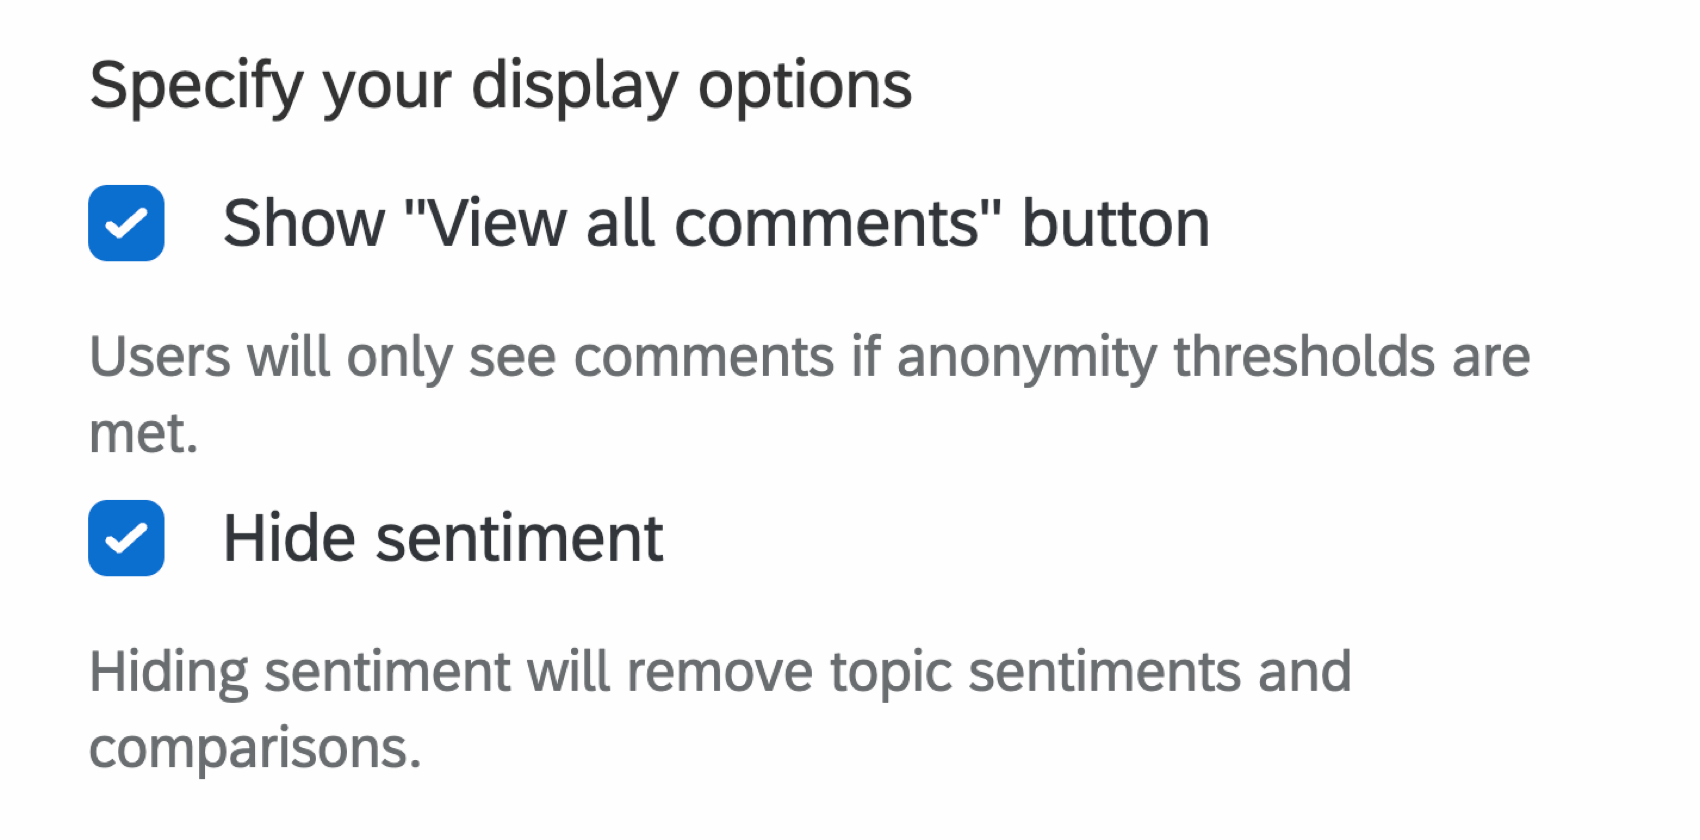
- Show “View all comments” button: When enabled, a “View all comments” button is added to the widget. This button lets dashboard users take a look at the individual feedback provided that the widget is creating summaries for. When this setting is disabled, only the summaries will be displayed for each topic, and the individual comments being analyzed will be hidden.
- Hide sentiment: When enabled, topic sentiments and comparisons will be hidden in the widget. This includes the sentiment breakdown bar, mentions of sentiment in topics, and sentiment in dashboard exports.
Understanding the Comment Summaries Widget
Each comment summaries widget starts by giving you a chart showing the top 5 most mentioned topics found in Text iQ. Then you can scroll down to see more information about each topic. Finally, it’s important to keep in mind how Enhanced Confidentiality and other privacy settings affect this widget.
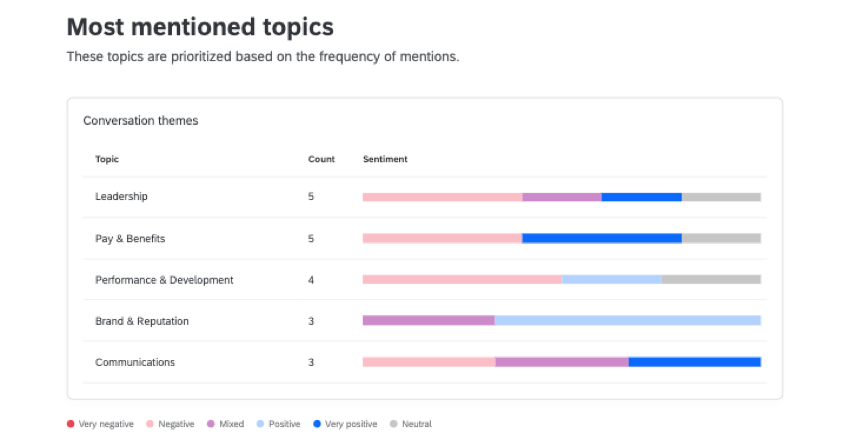
Most Mentioned Topics
The Most mentioned topics will show conversation themes. You’ll see the top parent topics from your feedback, and the count of how many responses reference each topic. You’ll also see a sentiment break-out for each topic.
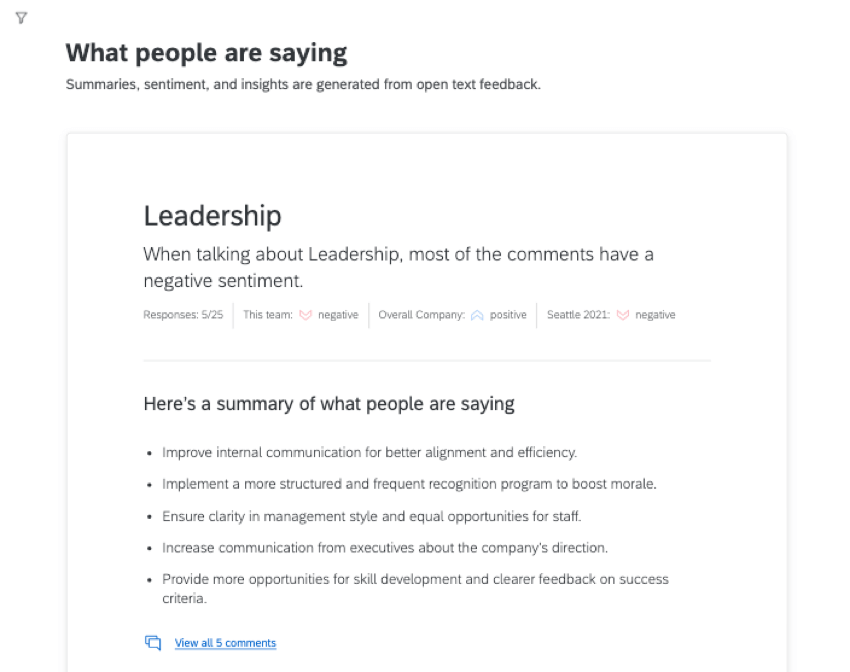
Summaries for Each Topic
Under What people are saying, you’ll see a table for each of the top parent topics identified. For each topic, you’ll see the overall sentiment, followed by the viewer’s team’s sentiment. If you’ve added a comparison, they’ll be displayed here.
The table will provide an AI generated series of bullet points summarizing the comments that fit this topic. You can view all of the exact comments given for this topic by clicking the link. If “View all Comments” has been turned off in the widget settings, the comments will be hidden, and only the summaries will be shown for each topic.
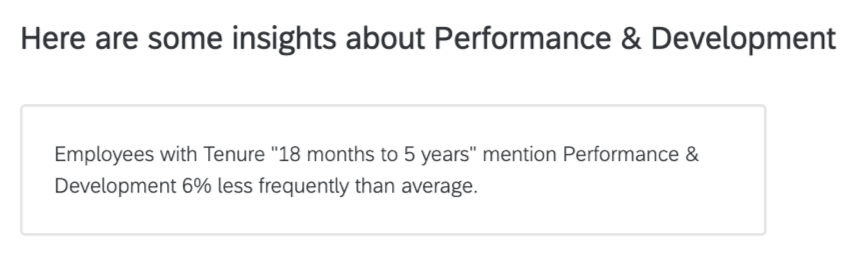
If you added demographics to your widget, you may also see information below the summaries. If there is a statistically significant result, the widget will call out how often specific demographics referenced specific topics. If there are no statistically significant results, you will not see any demographic-specific information.
Comment Summaries and Confidentiality
The comment summaries widget will obey any confidentiality threshold you have set, either on a dashboard or administrative level.
If a team has enough comment responses on a question to exceed the confidentiality comment threshold, summaries will be displayed for each topic.
The widget allows you to view all comments relevant to a topic. However, you can only do this if the responses exceed the confidentiality threshold for the question.