Translating Dashboard Labels
About Label Translations
Dashboard label translations include the majority of fields in your dashboard that aren’t static or data. Labels include:
- Most widget fields (e.g., titles, descriptions, axis labels)
- Dashboard name
- Page names
- Filter names
- Comparison names (with the exception of org hierarchy comparisons and “Same As Viewer” comparisons)
- Benchmark names
- Topics created in Text iQ and displayed in Text iQ table or bubble widgets
Qtip: See columns in your file named “topics:[topic name]”.
Generating a Labels File with Google Translate
- Click the settings gear.

- Go to the Translations tab.
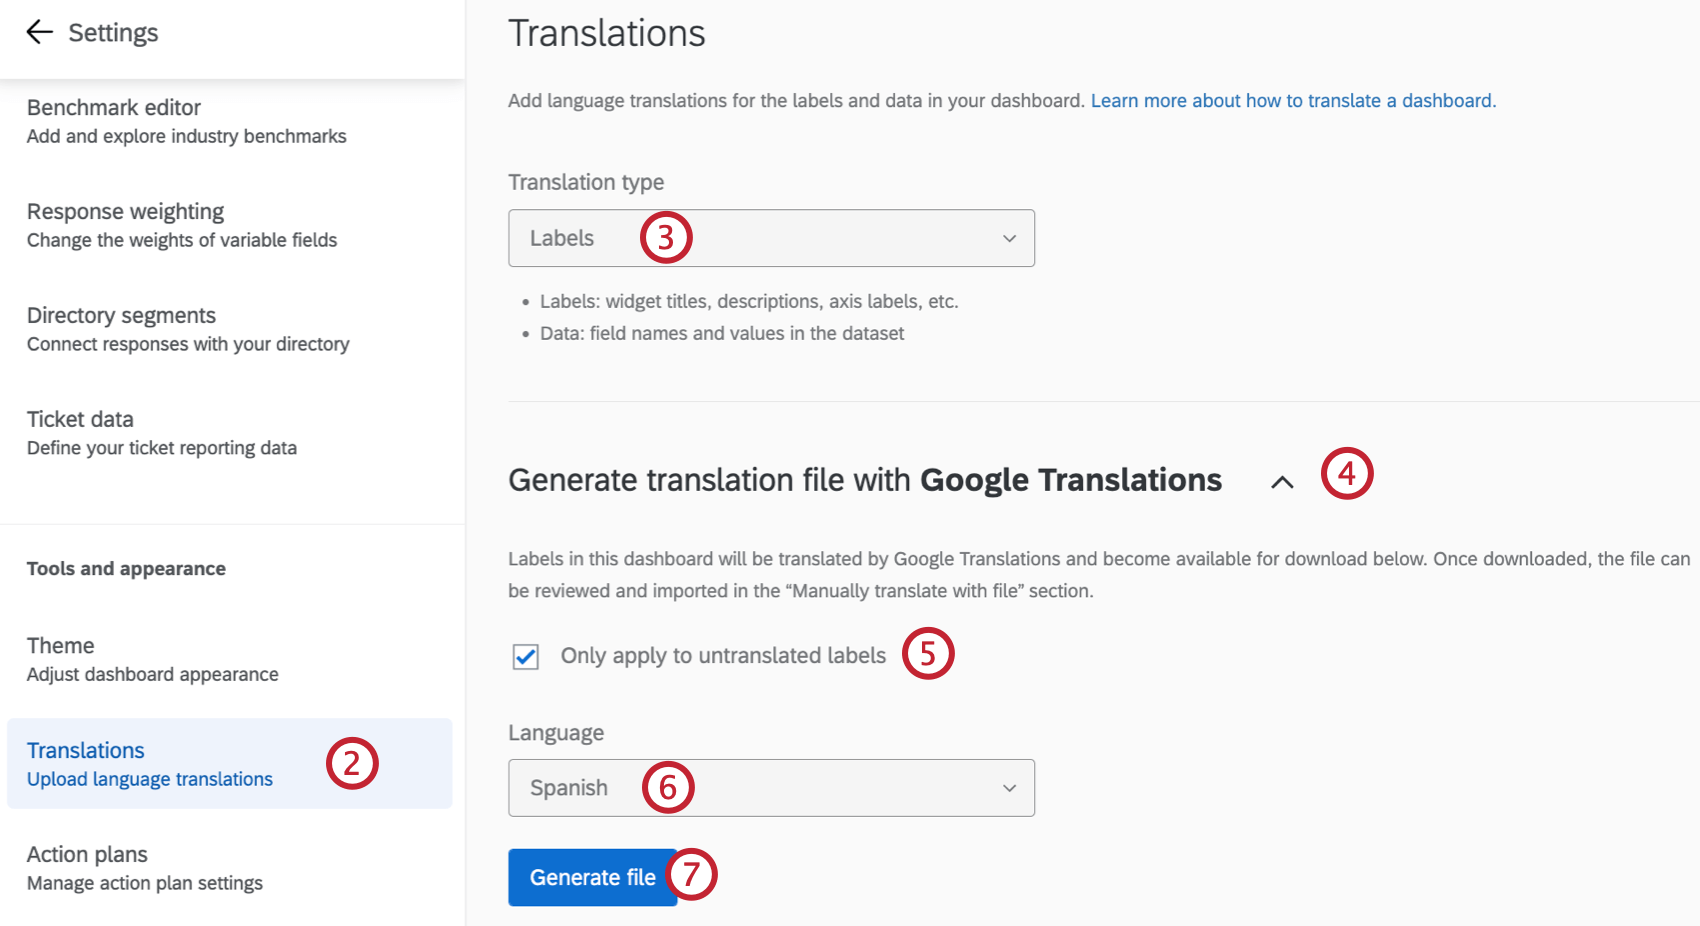
- If you have a Translation Type field, make sure it says Labels.
- Select Generate translation file with Google Translations.
- Check the box if you want the file to only generate translations for untranslated labels.
- Use the dropdown to select a language for the translation. For a list of languages supported, see the Languages in Qualtrics page.
- Click Generate file.
Qtip: Only 1 automatic translation can be processed at a time per dashboard.
- Select Download translation file.
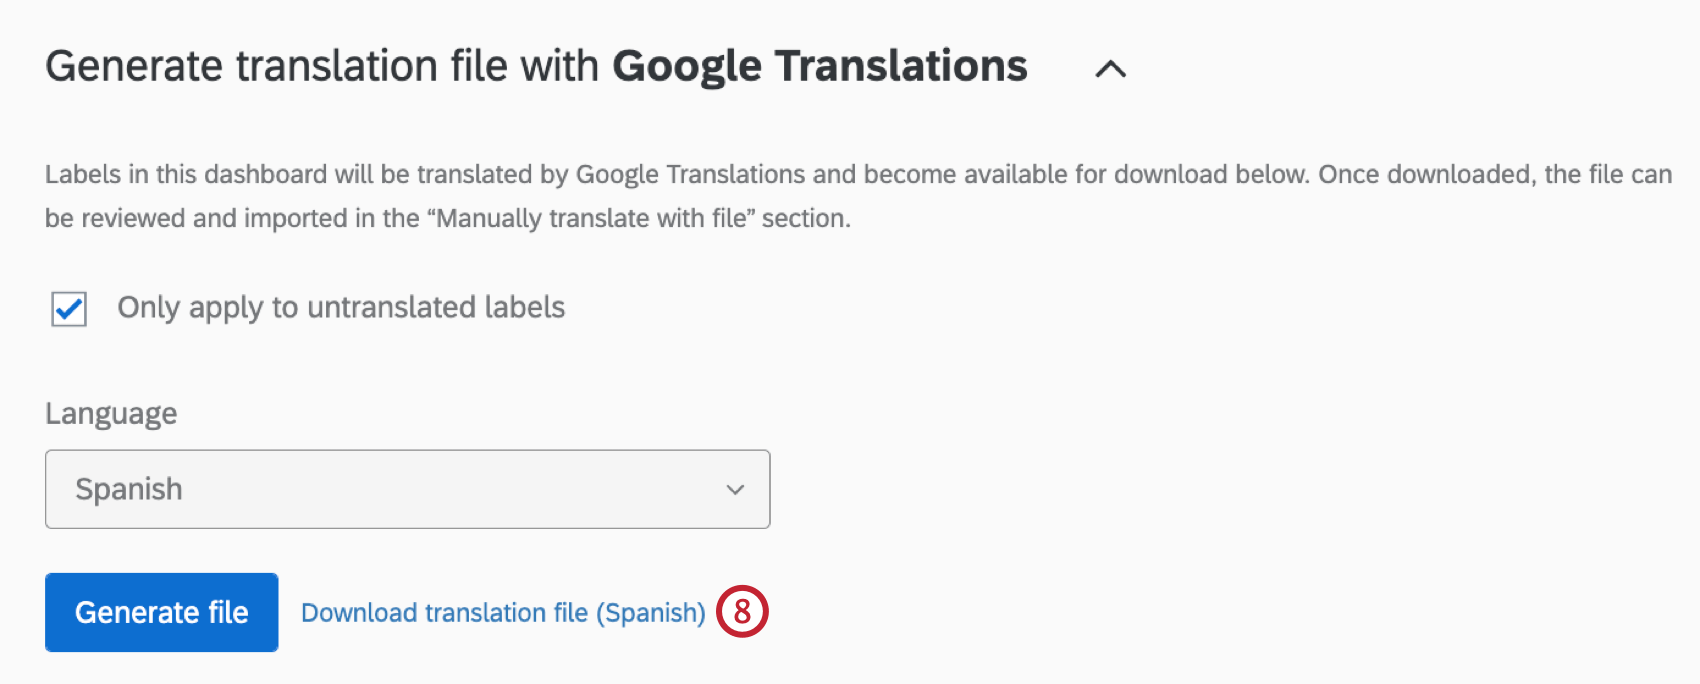
- If desired, you can open this file to review and edit it manually.
Manually Creating a Labels File
For a list of languages supported, see the Languages in Qualtrics page.
- Click the settings gear.

- Go to the Translations tab.
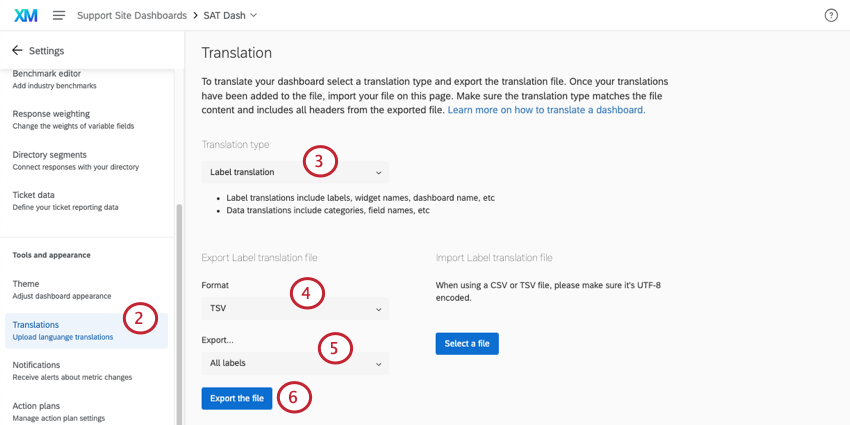
- If you have a Translation Type field, make sure it says Labels.
- Within the Manually translate with file section, choose the file format.
Qtip: We generally advise sticking to TSV, since this file type is better at handling special characters outside the English alphabet.
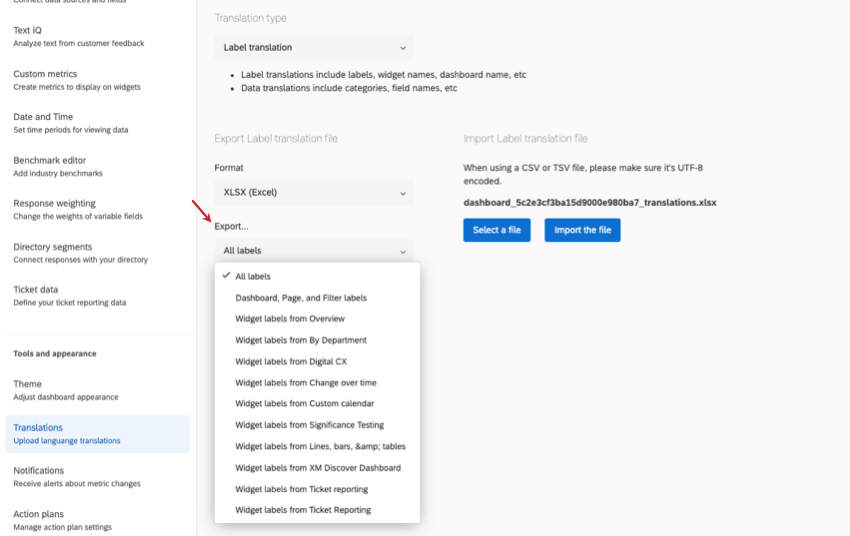
- Under Export, select from the following:
- All labels: Translate all labels in the dashboard. This includes labels for every widget on every page.
- Dashboard, Page, and Filter Labels: Translate only the dashboard name, page names, and filter names (not values). Comparisons and benchmarks are also included. Learn more about partial translation.
- Widget labels from a specific dashboard page: Translate only widget fields from a specific page of your dashboard. Labels translated include most widget fields (e.g., titles, descriptions, axis labels) and text topics. Comparisons and benchmarks are also included. Learn more about partial translation.
- Click Export the file.
Qtip: The Activate Dashboard dashboard permission must be enabled in order to export the translation file.
- Download the file onto your computer.
- Open the file in a spreadsheet editor on your computer. See Opening Translation Files for more information.
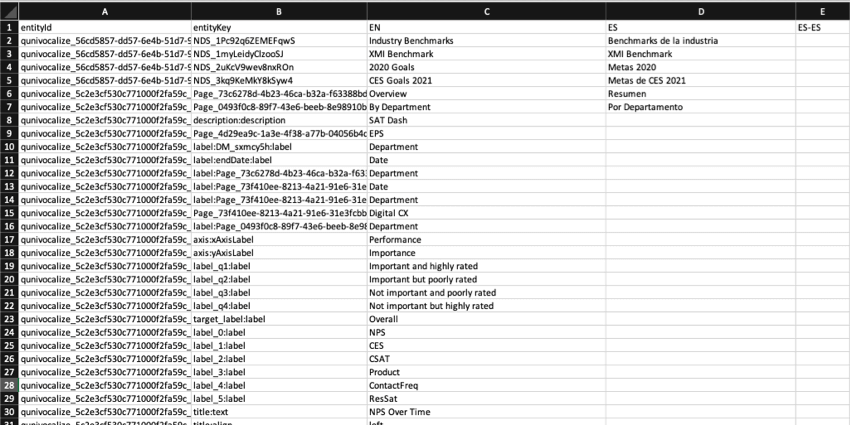
- Add your translations to their corresponding language column. Here are some general tips:
- See the List of Language Codes page for guidance about each language column.
- Follow the file’s exact formatting for creating your translations.
- Use the English column (EN) as a guide.
- Copy and paste to ensure formatting is correct. Do not delete or rearrange the columns, as this will cause the import to fail and translations to be lost.
- Please do not edit anything in the entityId or entityKey columns. Do not delete any strings of numbers and letters – these are internal IDs that identify the parts of the dashboard you are translating.
- Save your file as a CSV file with UTF-8 encoding or as a TSV.
Warning: Once you’ve saved the file, do not open it again as this could cause you to lose formatting for any special characters.
- Click Select a File and select your CSV or TSV file.
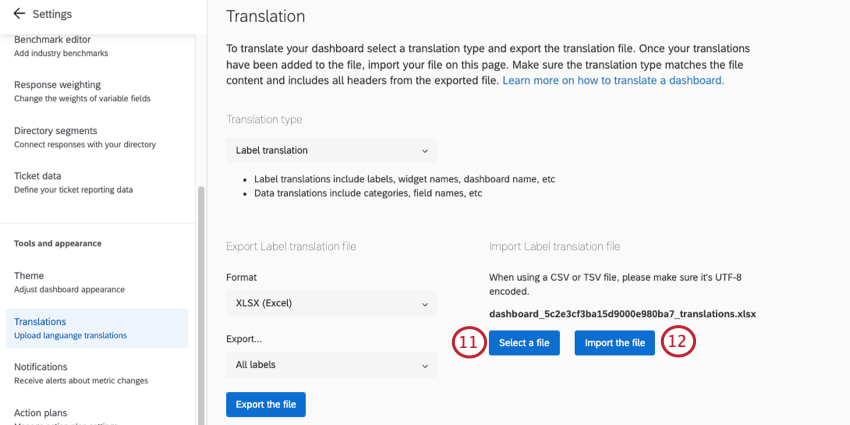
- Click Import the file.
When the translation is done, a message will appear that says Translations updated successfully.
Importing a Labels File
Once you have created a labels file, either manually or using Google Translate, you can import it to your dashboard.
- Click Manually translate with file.
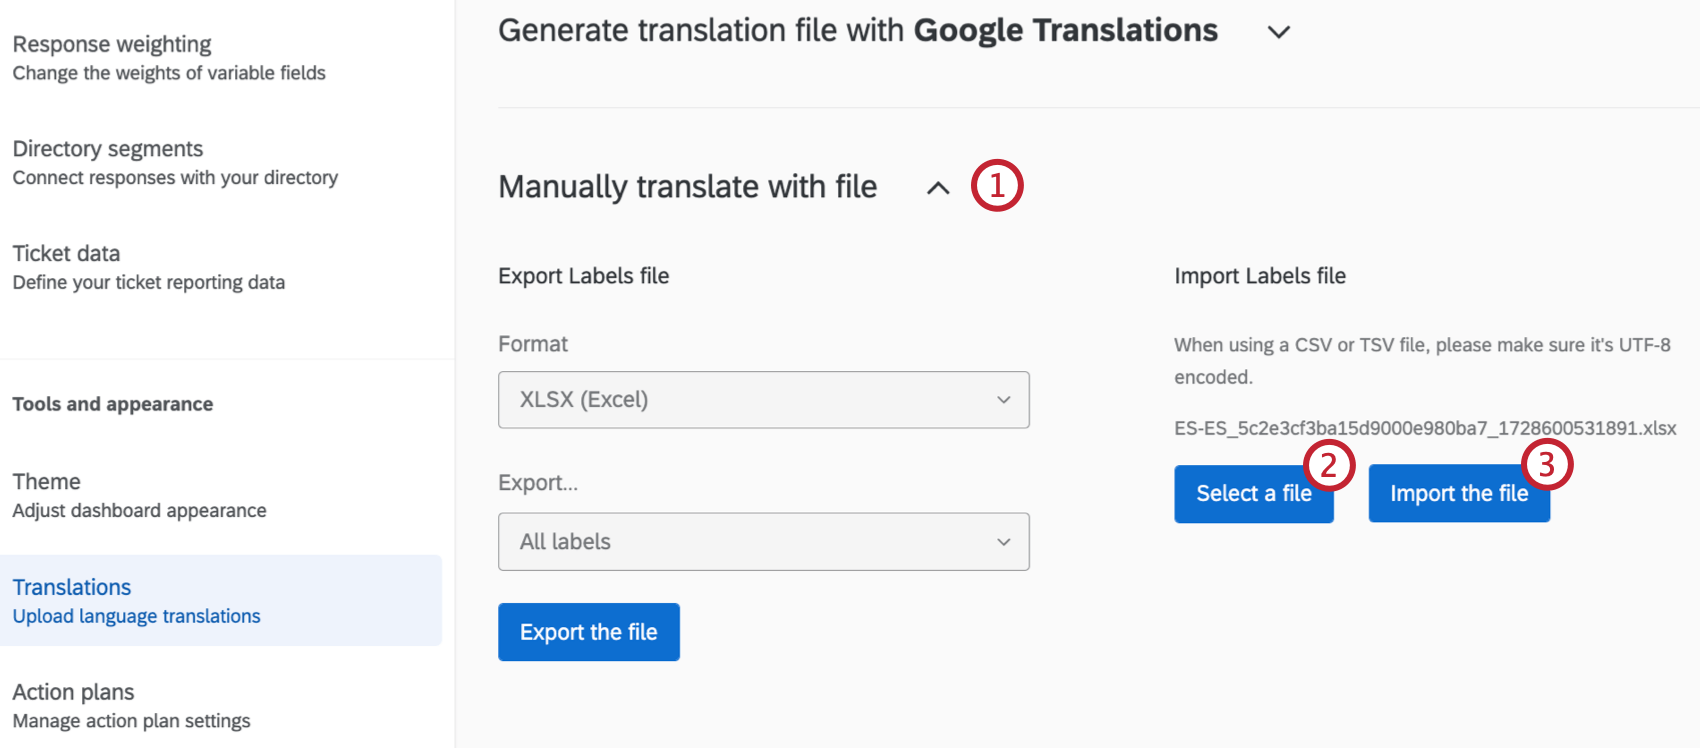
- Click Select a file and select your label translation file.
- Click Import the file.
- When the translation is done, a message will appear that says Translations updated successfully.
Partial Label Translations
You don’t have to upload the dashboard’s entire translation all at once. You can instead upload partial translations. This makes it easy to correct translations for small edits.
To get a sample file for your partial translation, make sure to choose one of the following from the Export menu:
- Dashboard, Page, and Filter Labels: Translate only the dashboard name, page names, and filter names (not values). Comparisons and benchmarks are also included.
- Widget labels from a specific dashboard page: Translate only widget fields from a specific page of your dashboard. Labels translated include most widget fields (e.g., titles, descriptions, axis labels) and text topics. Comparisons and benchmarks are also included.
Here are some recommendations to ensure partial translations are uploaded properly.
- Always keep the header (first) row of the exported file
- The smallest section you can upload at a time is called an entity. Each widget is its own entity. All rows that belong to the same entity have the same entityId. You must have all of the rows related to a single entity for an import to work.
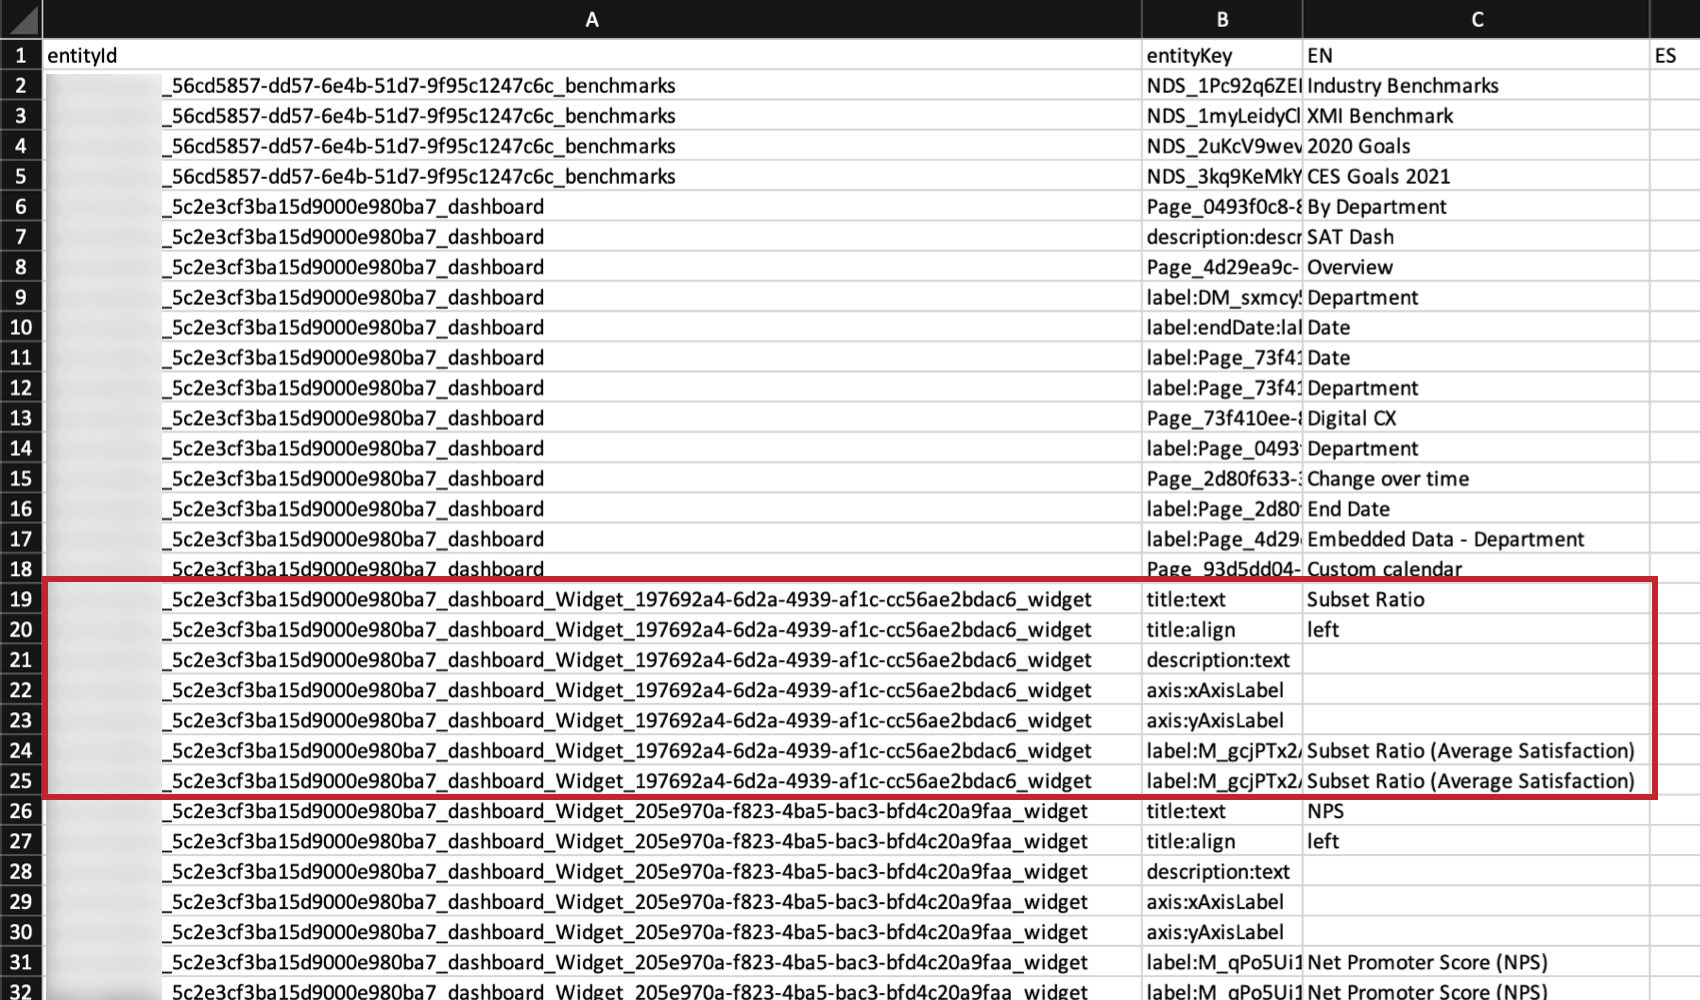 Example: For example, if you’re translating your focus areas widget, you must include every row related to the focus areas widget.Warning: If you upload only a few of an entity’s rows instead of all of them, any previous translations you uploaded for missing rows will be deleted.
 - All of the labels for the dashboard, like page names and filter summaries, must be uploaded together. These are considered a single entity.
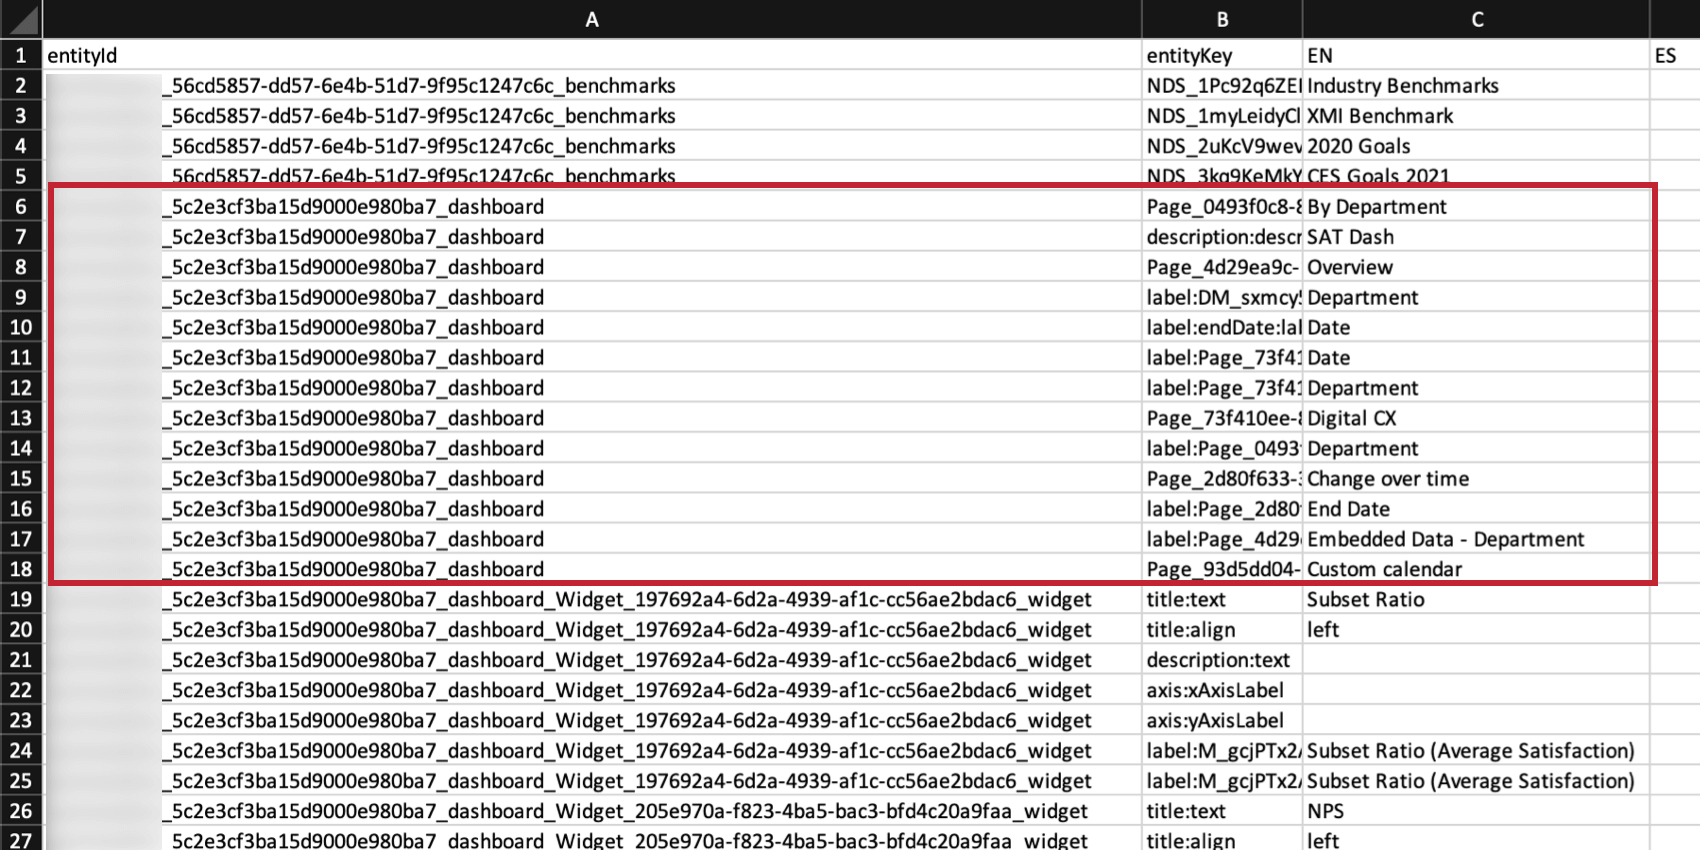
- The best way to safely upload partial translations is to exclude all the rows of an entity you’re not translating. For example, if you’re not going to translate your focus areas widget, exclude all of the focus area rows from the file.
Troubleshooting Translations
See the Dashboard Translation page for help opening files, previewing translations, fixing file formatting, and more.
Translation Compatibility
Widget Compatibility (CX)
The following widgets are compatible with label translations. Label translations refer to labels, widget names, and dashboard names. Data translations refer to categories and field names.
| Label Translations | |
| Record Table | Yes |
| Table | Yes |
| Text IQ Table | No |
| Gauge Chart | Yes |
| Number Chart | Yes |
| Line and Bar Chart | Yes |
| Response Ticker | Yes |
| Star Rating | Yes |
| Key Driver | Yes |
| Breakdown Bar | Yes |
| Online Reviews Widget | Yes |
| Donut / Pie | Yes |
| Focus Areas | Yes |
| Text IQ Bubble Chart | Yes |
| Coaching Priorities | Yes |
| Action Planning Editor | Yes |
| Frontline Reminders | Yes |
Widget Compatibility (EX)
The following widgets are compatible with label translations. Label translations refer to labels, widget names, and dashboard names. Data translations refer to categories and field names.
| Label Translations | |
| Question List | Yes |
| Score Card | Yes |
| Heat Map | Yes |
| Engagement Summary | Yes |
| Demographic Breakout | Yes |
| Participation Summary | Yes |
| Bubble Chart | Yes |
| Comparison Widget | Yes |
| Response Rates | No |
| Record Grid | Yes |
| Gauge Chart | Yes |
| Number Chart | Yes |
| Simple Chart | Yes |
| Response Ticker | Yes |
| Key Driver | Yes |
| Pie Chart | Yes |
| Focus Areas | Yes |
| TextiQ Bubble Chart | Yes |
| Line & Bar Chart | Yes |
| Table | Yes |
| Record Table | Yes |
EX Manager Report Compatibility
The following manager report widgets can be translated with dashboard labels:
- Question List
- Scorecard
- Engagement Summary
- Heat map
