
Categories (EX)
What's on this page
Qtip: This page describes functionality available to Engagement, Lifecycle, Ad Hoc Employee Research, Pulse, and 360 projects. For more details on each, see Types of Employee Experience Projects.
About Categories
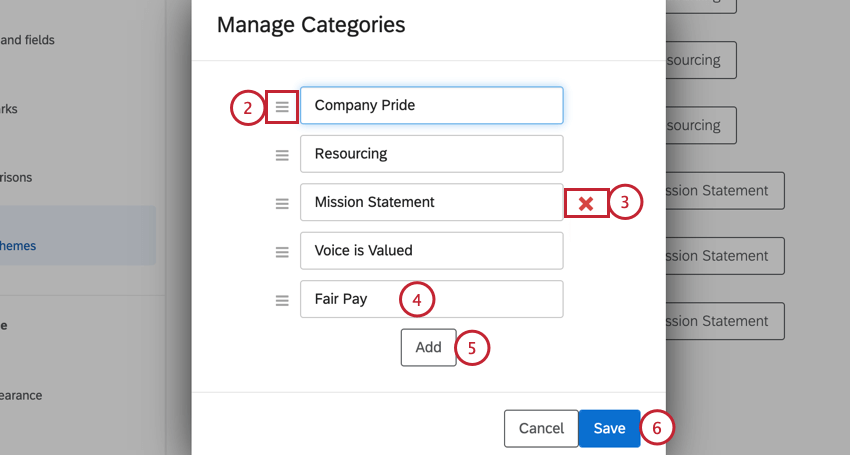
Qtip: A maximum of 100 statements can be added to each category.
Imagine your employee survey asks your participants to rate your company on concepts related to integrity. You’d like to combine all these questions together into one integrity score to display on your dashboard, but how? By using categories, you can group different sets of questions and metadata together for aggregate reporting.
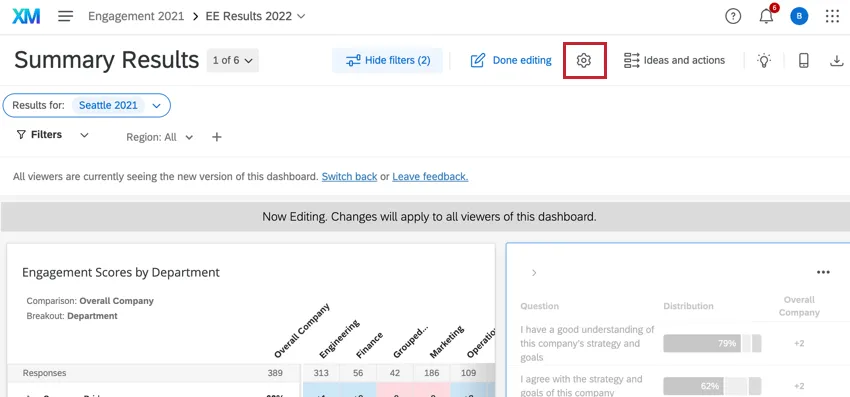
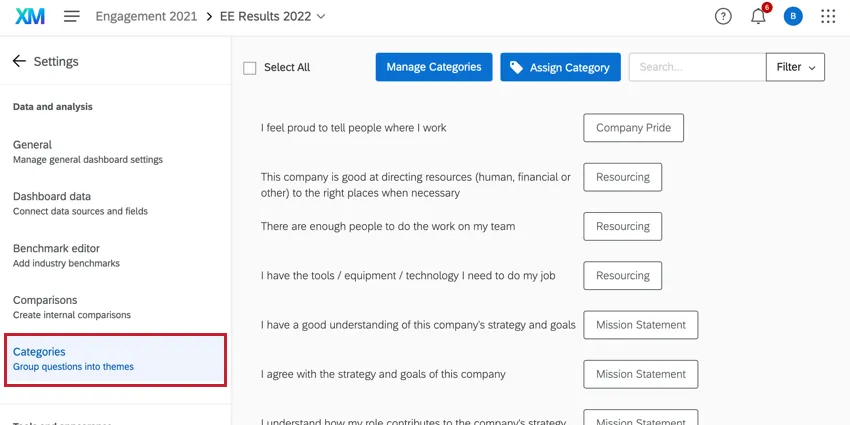
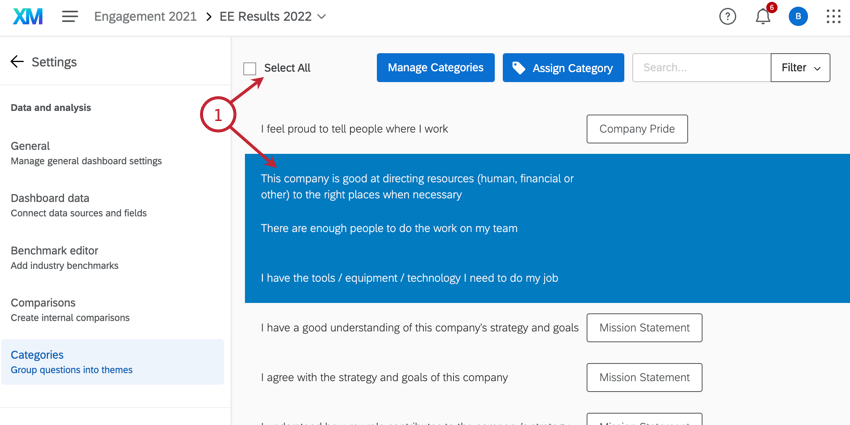
You can manage your categories by going to the Settings and selecting the Categories section along the left.
Qtip: Categories work differently in 360 dashboards than other EX dashboards. See Categories in 360 Dashboards for more information.
Qtip: If some items in a category don’t meet the response threshold or don’t have any responses, the category score is calculated without those items. Viewing all category scores allows managers to see the general themes in their results and understand where they are doing well and where they can improve, but the focus should be on item-level scores and trends, as those are more actionable. In contrast, within Comparisons category scores are hidden if items are missing.
How Category Scores are Calculated
Category scores are calculated by taking the weighted average of the question scores contained in the category. For example, let’s say we have a category that contains 3 questions with the following response counts and favorability scores:
- Question A: 75.13% favorable with 10,000 responses.
- Question B: 80.57% favorable with 9,500 responses.
- Question C: 73.23% favorable with 9,800 responses.
If these 3 questions are combined into 1 category and displayed in a widget, then the overall favorability score for the category will be 76.26%, calculated by:
[(75.13*10,000)+(80.57*9,500)+(73.23*9,800)] / (10,000+9,500+9,800) = 76.26% (rounds up to 76.3% if only 1 decimal place is shown)
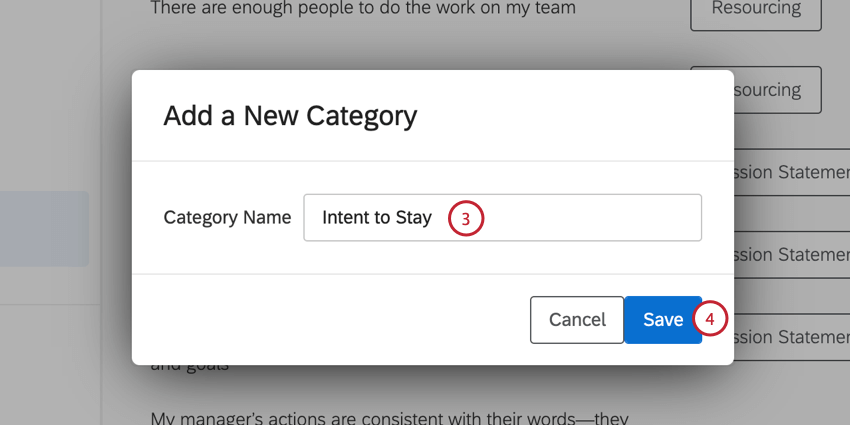
Creating Categories
Managing Categories
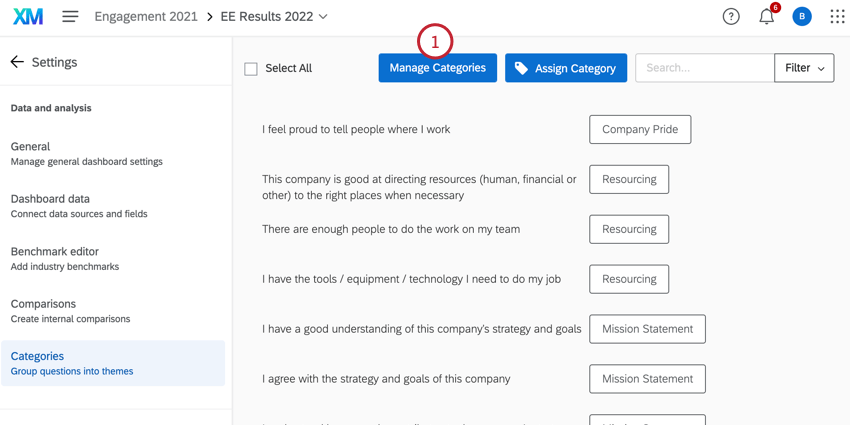
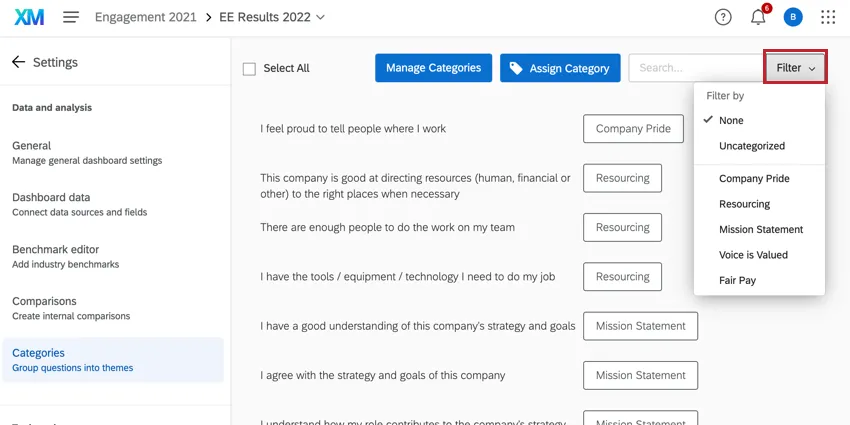
Qtip: Have a lot of questions and metadata? Use the search function to narrow down which statements you want to manage. By clicking Filter, you can even choose to only view and manage statements belonging to a certain category.
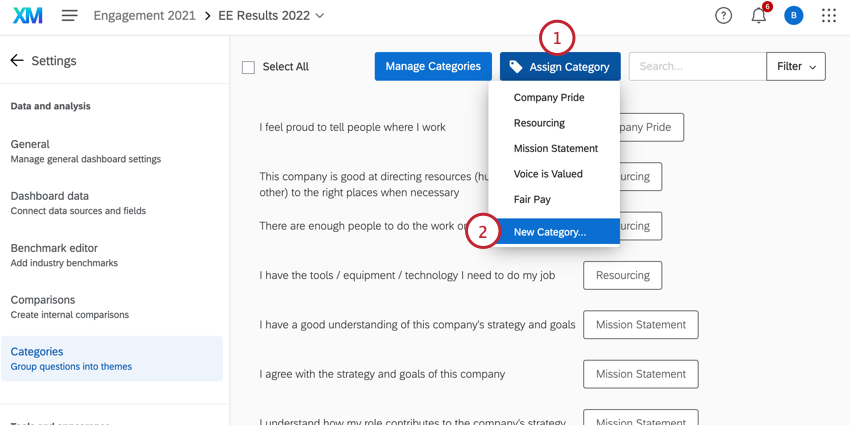
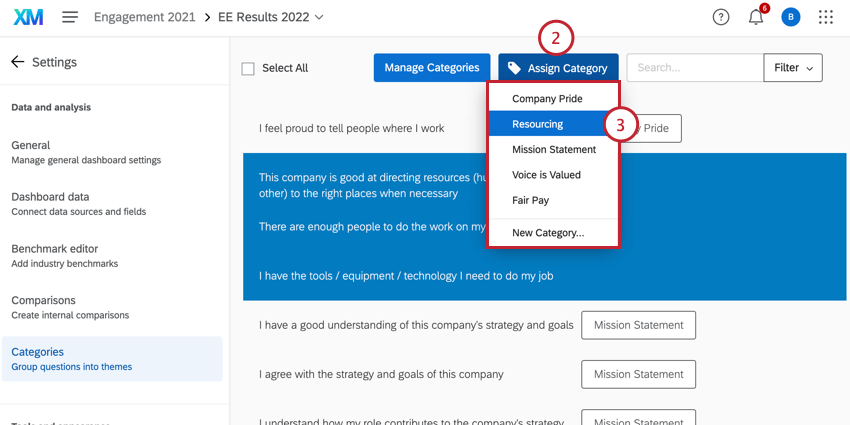
Assigning Categories
Qtip: Only Number Set field types are compatible with categories.
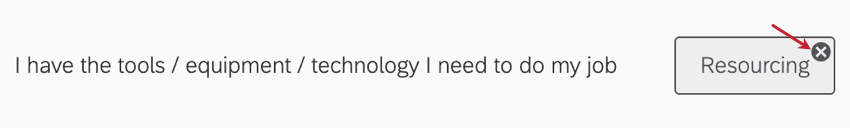
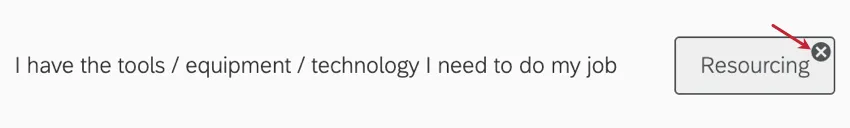
Once you assign a category to a statement, it will appear to the right of that statement. If you hover over the category name, an X will appear. Clicking this will remove the category from that statement.
You can assign as many categories as you want to any given statement.
Qtip: Are there statements in your category that are reverse-coded? Check out our Scale Settings page to figure out how to set this up.
Categories in 360 Dashboards
Qtip: The information in this section is only relevant for 360 dashboards.
For 360 dashboards, dashboard categories function differently. Categories are created by setting up scoring in your 360 survey. You can then choose these scoring categories as metrics in your dashboard widgets.
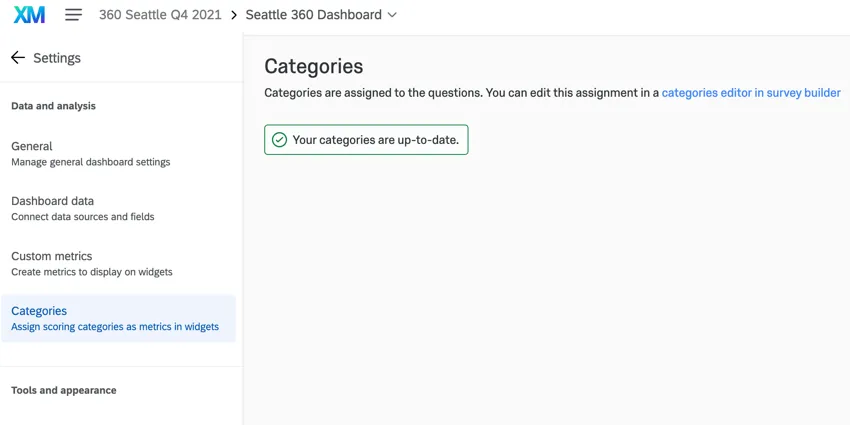
If your categories are up to date in your dashboard, then no action is needed from you in the Categories tab.
However, if your scoring categories have been edited since the dashboard was created, you will have a few options:
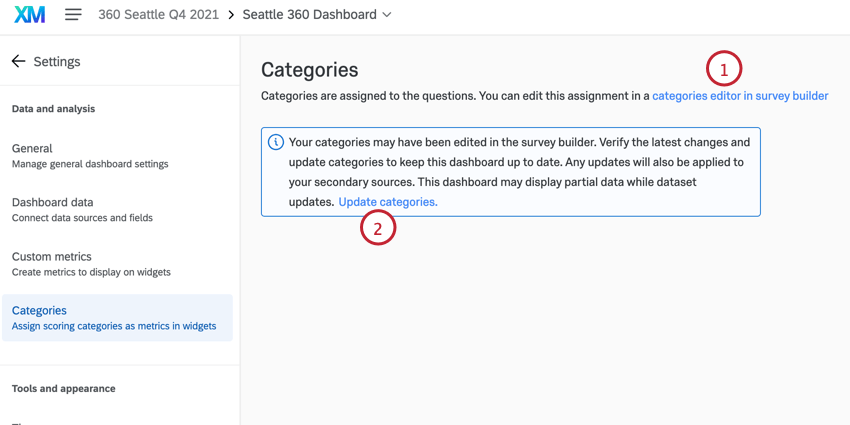

Widget Compatibility
The only widgets that are NOT compatible with categories are the following:
- Image widget
- Rich text editor widget
- Participation summary widget
- Word cloud widget
- Response rates widget
- Response ticker widget
Categories tend to behave a lot like Number Set fields when it comes to widget compatibility. Categories can be pulled into any of the widgets not listed above, either as the main field or as an additional metric. Categories cannot be used in page filters or widget filters.
The scorecard widget only displays data from categories and will not work if you do not have any set up.
FAQs
I'm mapping historical data, and I have categories set up. What will happen if the categories don't have the same items in them?
I'm mapping historical data, and I have categories set up. What will happen if the categories don't have the same items in them?
That's great! Thank you for your feedback!
Thank you for your feedback!