-

Qualtrics Platform -

Customer Journey Optimizer -

XM Discover -

Qualtrics Social Connect
Pricing Study (Gabor Granger)
About the Gabor Granger Pricing Study
The Gabor Granger pricing study is a research tool that helps find out how much customers are willing to pay for your product. This guided solution identifies the best price point to maximize revenue by measuring customer willingness to pay and price sensitivity. It provides automated surveys, instant analysis, and clear reports to simplify pricing decisions and understand how price changes impact demand.
This program comes with 2 pre-configured parts:
- A pricing survey to send to your respondents.
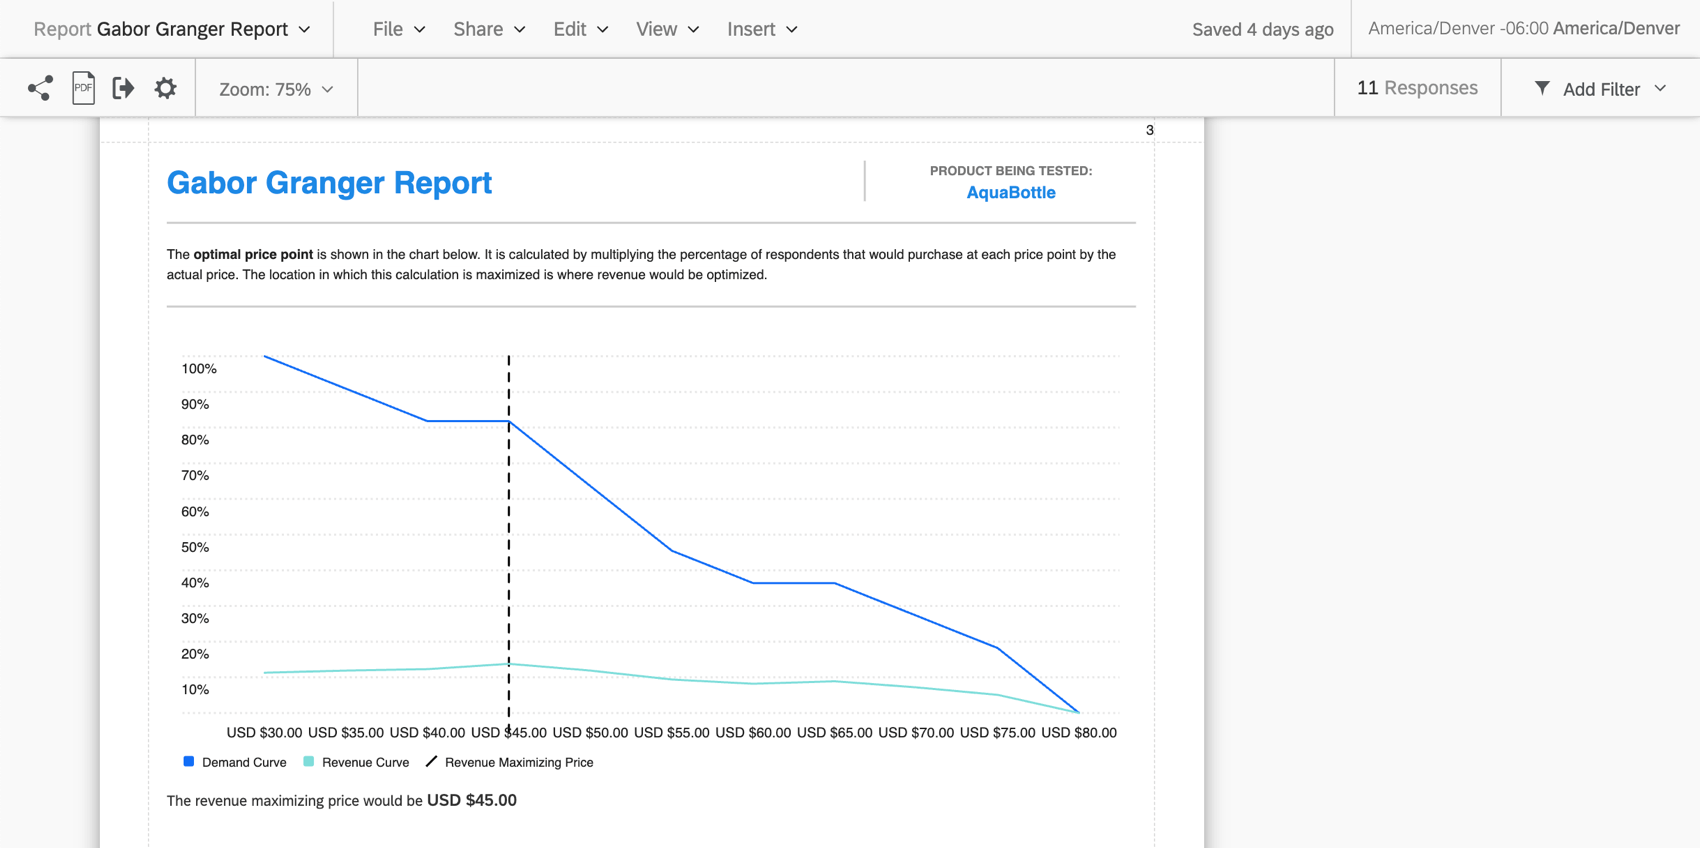
- A Gabor Granger report, with graphs that illustrate the demand curve, revenue curve, and revenue maximizing price calculated for this study.
What is Gabor Granger Analysis?
The Gabor Granger technique, which was developed by Andre Gabor and Clive Granger, is a pricing research tool that helps identify the best price point to maximize revenue. This guided solution uses the Gabor Granger technique to deliver 3 key outcomes:
- Set the right price point to drive demand.
- Understand how price changes affect sales.
- Maximize revenue from your next product launch.
What results does this study deliver?
There are two main outputs of the Gabor Granger pricing study:
- Demand and revenue curve: This graph helps you estimate the potential revenue at different pricepoints.
- Revenue maximizing curve: This graph gives you the optimal pricepoint for your product or service.
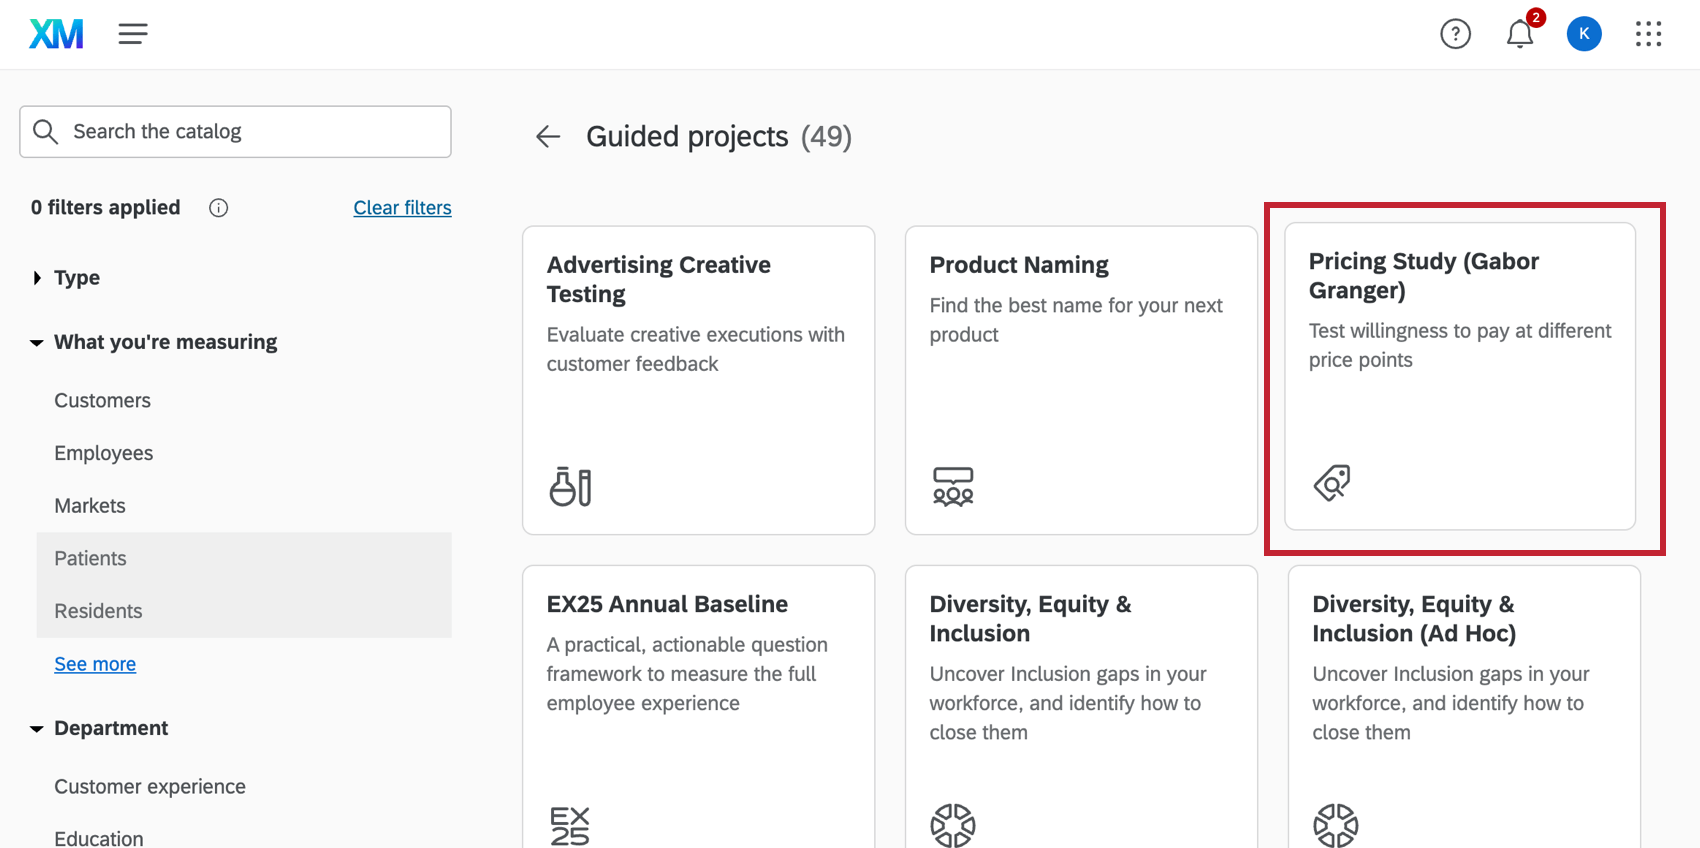
Creating a Gabor Granger Pricing Study
See Creating Guided Solutions for a step-by-step guide on how to create this study from the Catalog. When you begin filling out the fields in the set up assistant, you will be asked to specify 3 items:
- Minimum price: The minimum price that should be considered as part of this pricing study.
- Maximum price: The maximum price that should be considered as part of this pricing study.
- Interval within price points that must be understood: Also known as the price tolerance, this is the range of dollars between your minimum and maximum that you’re interested in.
Example: Let’s say your minimum is $0 and your maximum is $100. If you want to know the likelihood that your respondents will purchase this product for $20 versus the likelihood that they will purchase it for $30 versus the likelihood that they will purchase it for $40 and so on, this number would be 10.
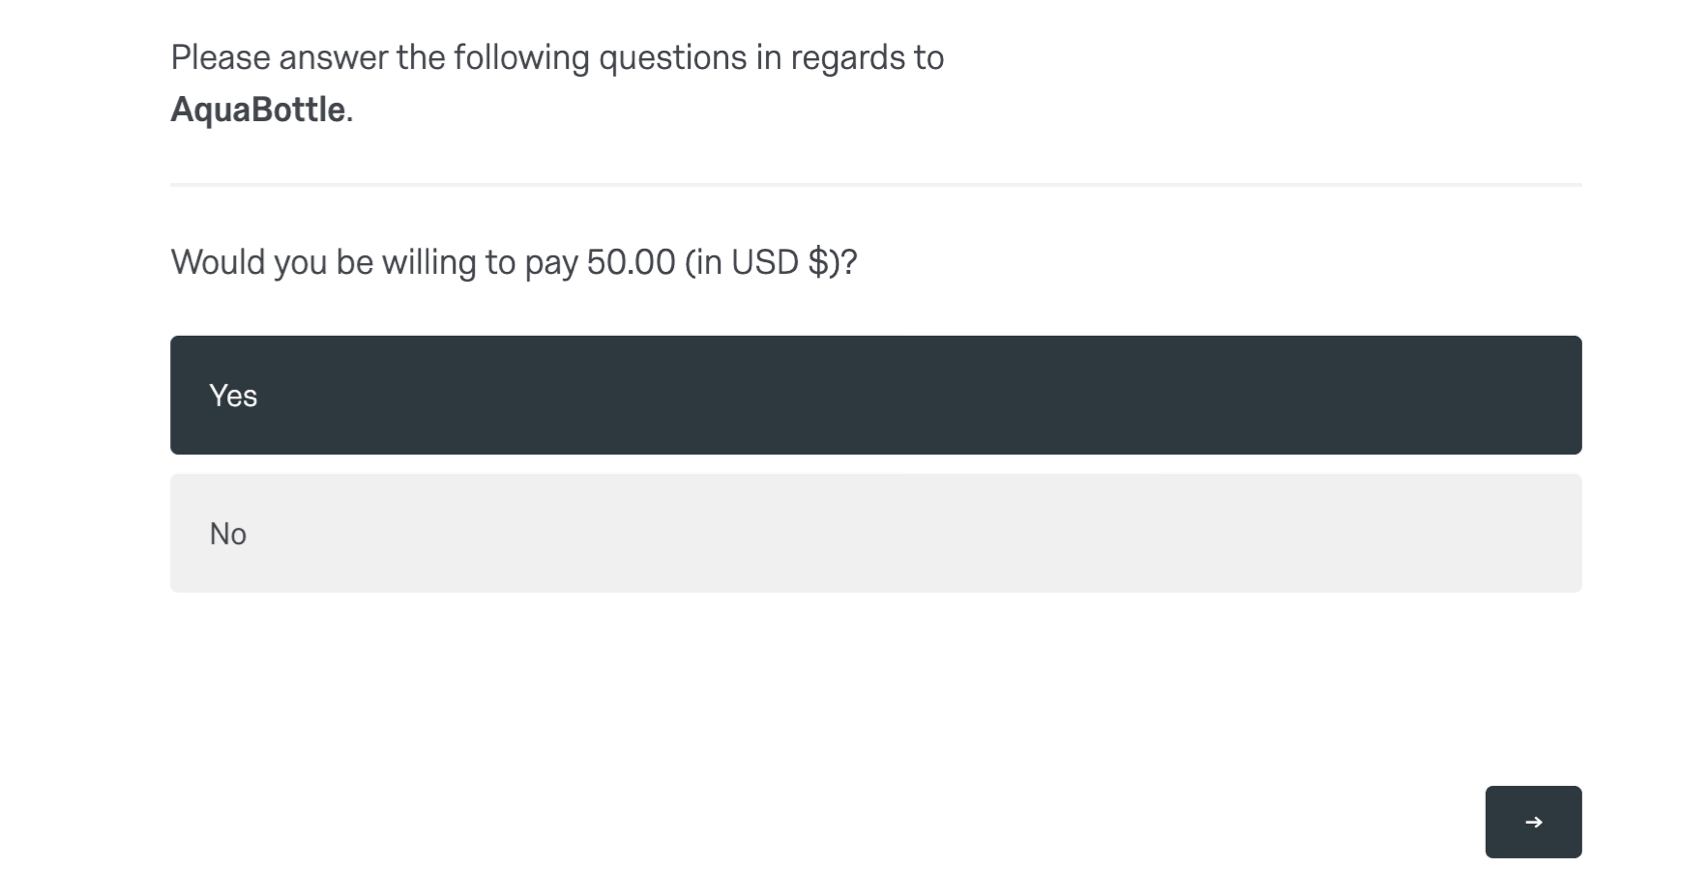
Design of the Pricing Block
The pricing block is where the pricing research is conducted. Once respondents reach this part of the survey, they will see a range of prices and will be asked if they would be willing to pay those amounts for the product or service.
There are three main elements to the pricing block:
- The number of questions shown to respondents.
- The initial price that respondents start with.
- The loop and merge intervals that take respondents through the pricing options based on their responses.
Number of Questions
The number of questions in the pricing block is calculated using the 3 values inserted into the setup assistant:
- Minimum price
- Maximum price
- Price tolerance: This is the figure put into the “interval within price points that must be understood” field.
These values are put into this equation to determine the number of questions each respondent receives:
Number of questions = Math.ceil(Math.log2((MaximumPrice – MinimumPrice) / PriceTolerance))
Initial Price
The first price shown to respondents is randomly selected within the middle third of the price range. For example, if the minimum price is 45,000 and the maximum price is 90,000, the starting price will range from 60,000 to 75,000.
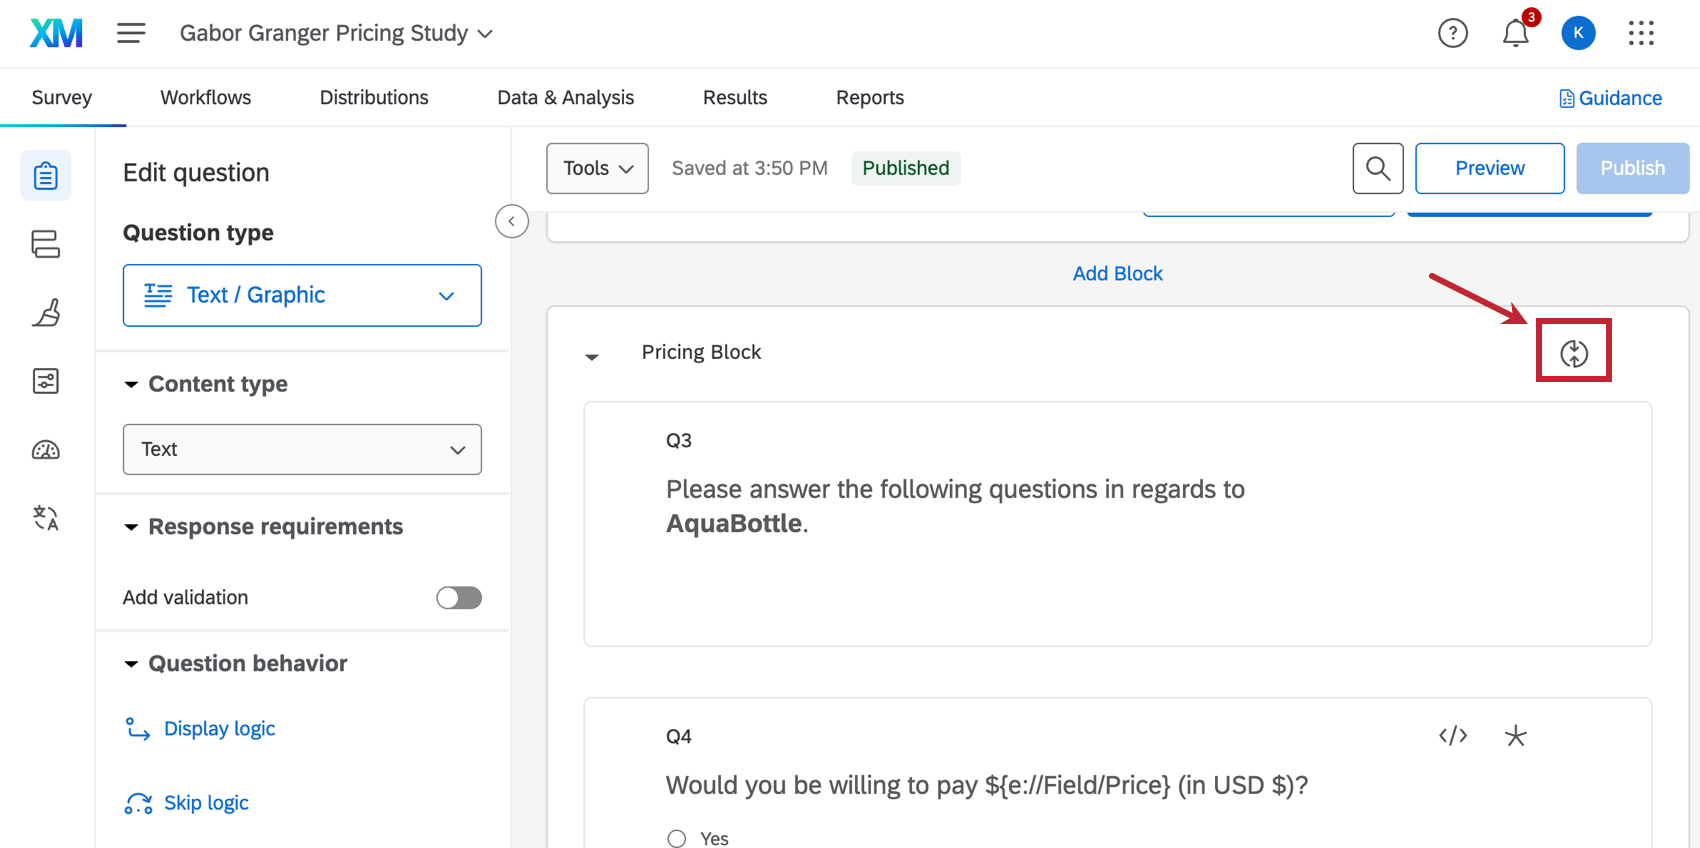
Loop and Merge Intervals
The study automatically generates price intervals by using the price range inserted in the set up assistant. These are used as the fields of the pricing block’s loop and merge.You can see these fields if you click the loop and merge icon in the pricing block of the survey builder.
The number of questions determines the number of price intervals generated.The price intervals are calculated using the following formula:
Interval_1 = (Price Range) / 4
Interval_2 = (Interval_1) / 2
Interval_3 = (Interval_2) / 2
Interval_4 = (Interval_3) / 2
When a respondent says yes to a price question, the current interval is added to the shown price. If they say no to a question, the current interval is subtracted from the shown price. The pricing block follows this pattern until the intervals are complete.
Reports
The Gabor Granger pricing study provides a report with graphs that illustrate the demand curve, revenue curve, and revenue maximizing price calculated for this study. This report relies on the price data field and is automatically updated as responses come in.
Pricing Buckets
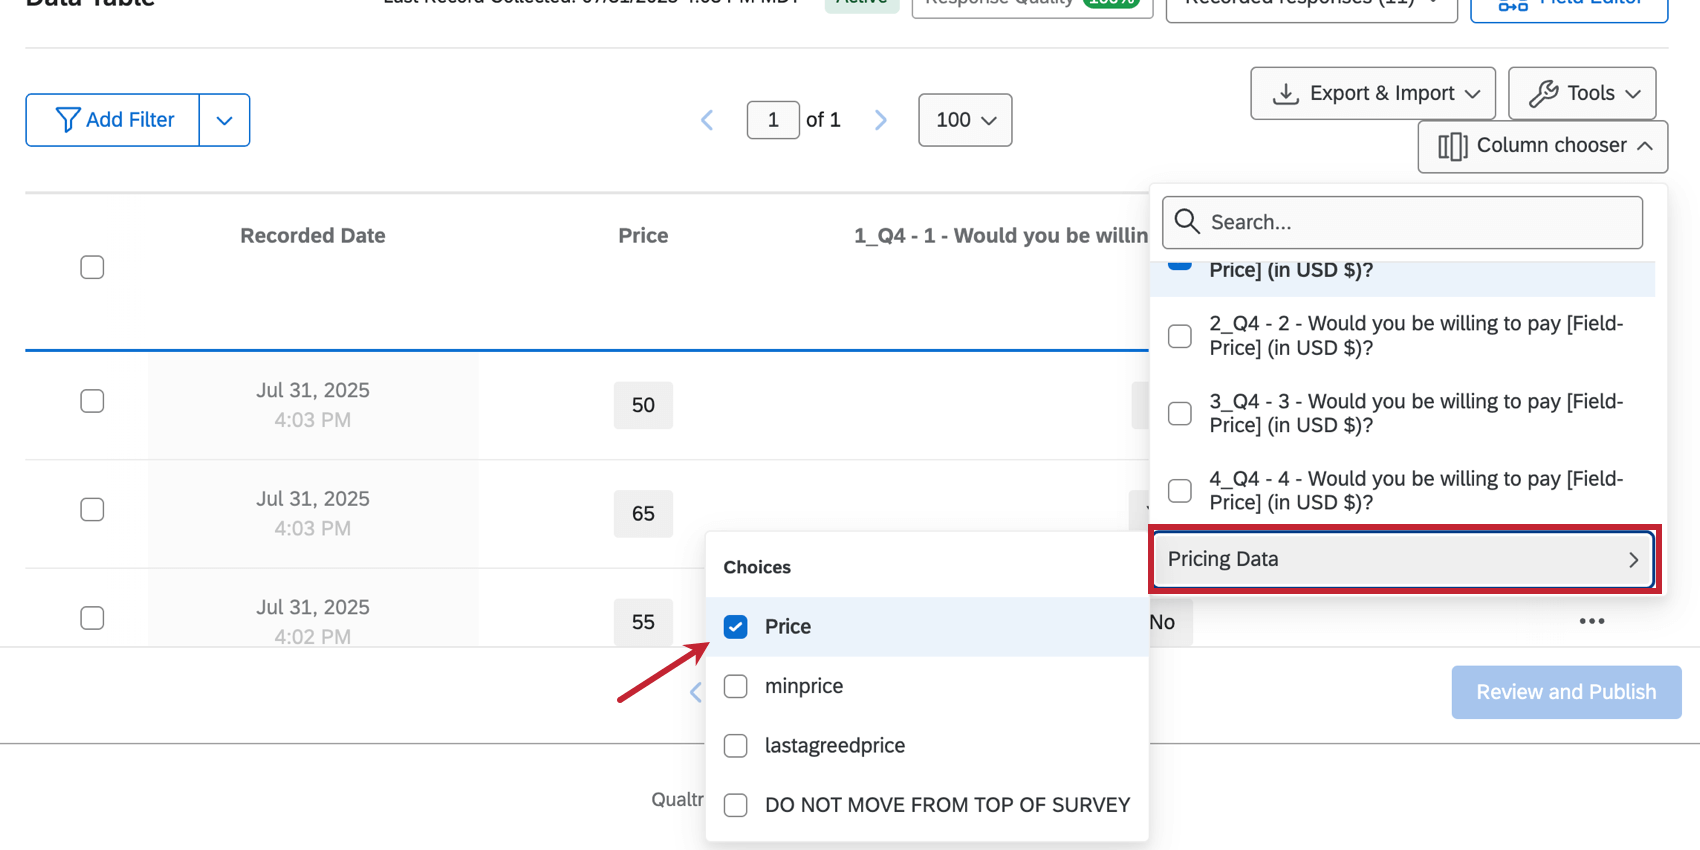
After respondents complete the pricing block, the last agreed price of the responses are put into “buckets”, which are used to populate the graph.
You can view these buckets from Data & Analysis by looking at the Price column in Pricing Data. Select lastagreedprice to view the last agreed price. For more information on pricing data, see Pricing Data Calculations.
Pricing Data Calculations
The Gabor Granger solution provides the following fields of pricing data. Each of these fields are updated throughout the respondent’s pricing block loop, and the final values are stored and used in the summary reports.
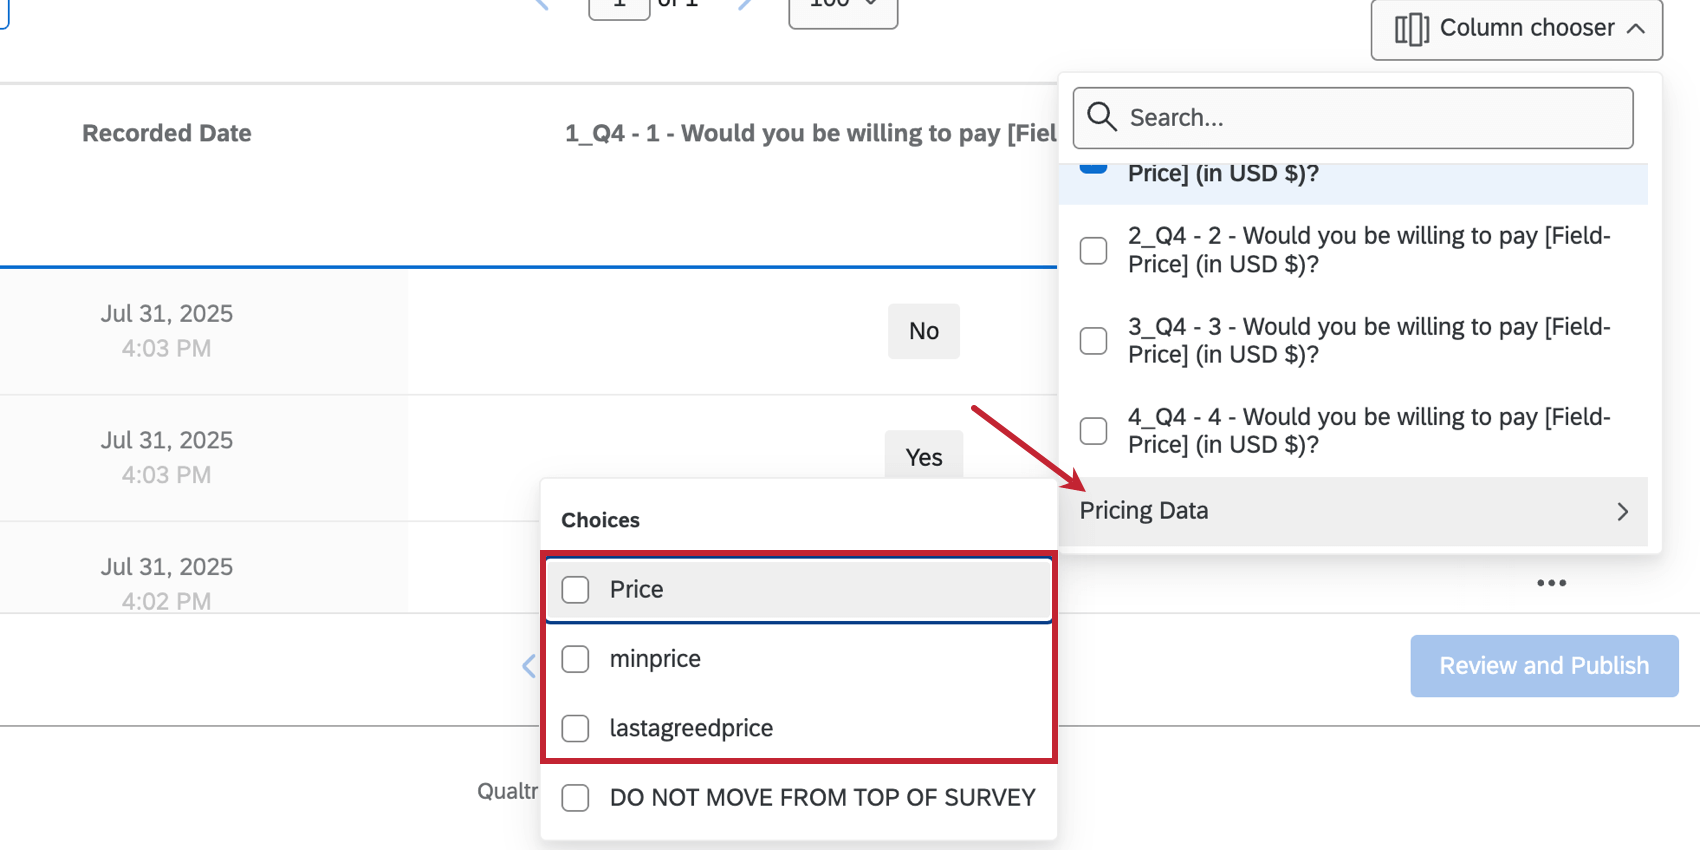
- Minprice: The lowest price that can possibly be shown. This is calculated at the beginning of the survey.
- Lastagreedprice: The last price that the respondent answered agreed to pay for. If the respondent answers “No” to every price, the value is set to “na”.
- Price: The rounded version of the last agreed price. If the last agreed price is 17.5, the price will be 17.
Qtip: This field must be a Number variable type. Changing the variable type can invalidate your survey data.