Using Survey Text iQ in a CX Dashboard
About Using Survey Text iQ in a CX Dashboard
You may want to use text analysis from individual projects in your dashboard instead of dashboard-wide text analysis. This could be due to the fact you want to use a data model, which is currently incompatible with dashboard Text iQ, or because you have already completed extensive text analysis in individual surveys. Regardless, there are special steps you must take to prepare your data so Text iQ features will work in a CX Dashboard.
By following the steps outlined on this support page, you’ll be able to use your Text iQ data in a dashboard, including:
- Report on text enrichments in your dashboard.
- Create a Text iQ Table widget.
- Create a Text iQ Bubble widget.
Required Fields and Types
For your dashboard Text iQ features to work, you need to make sure you have all of the following fields mapped to the specified field types.
In the table below, we give the field’s name and a link to more information on it, the field type, and the format the name will take by default. You can rename these fields as needed, but we highly recommend identifying both the specific questions and the specific field in the name.
| Field | Type | Name format | Required for: |
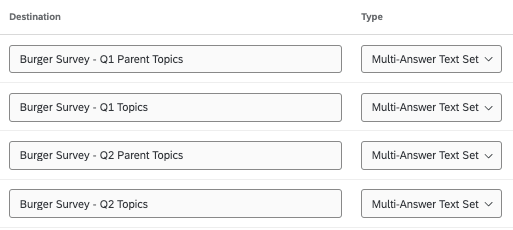
| Parent Topics | Multi-Answer Text Set | QID# – Parent Topics | Text iQ Table and Bubble Chart |
| Topics | Multi-Answer Text Set | QID# – Topics | Text iQ Table and Bubble Chart |
| Sentiment | Text Set | QID# – Sentiment | Text iQ Table and Bubble Chart |
| Sentiment Score | Numeric Value | QID# – Sentiment Score | Text iQ Table and Bubble Chart |
| Topic Sentiment Label | Multi-Answer Text Set | QID# – Topic Sentiment Label | Text iQ Table and Bubble Chart |
| Topic Sentiment Score | Multi-Answer Text Set | QID# – Topic Sentiment Score | Text iQ Table and Bubble Chart |
| Actionability | Text Set | QID# – Actionability | Enrichments |
| Effort | Text Set | QID# – Effort | Enrichments |
| Effort Numeric | Numeric Value | QID# – Effort Numeric | Enrichments |
| Emotion | Multi-Answer Text Set | QID# – Emotion | Enrichments |
| Emotional Intensity | Text Set | QID# – Emotion Intensity | Enrichments |
| Topic Hierarchy Level (separate field for each level) | Multi-Answer Text Set | QID# – Topic Hierarchy Level # |
Mapping Multiple Text iQ Sources
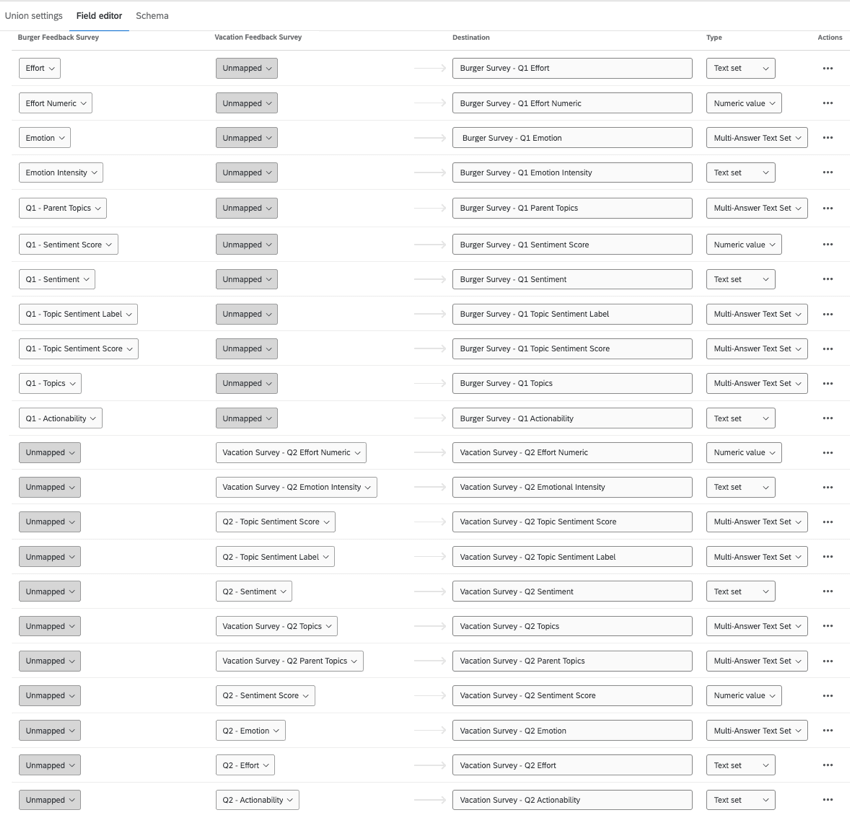
You’ll often create dashboards that need data from more than one survey or source. For Text iQ widgets and enrichments to work in your dashboard, we recommend mapping each source’s Text iQ data separately.
The goal is to make sure each collection of Text iQ fields corresponds to only 1 question from 1 survey.
Data Model
- Edit your data model dataset.
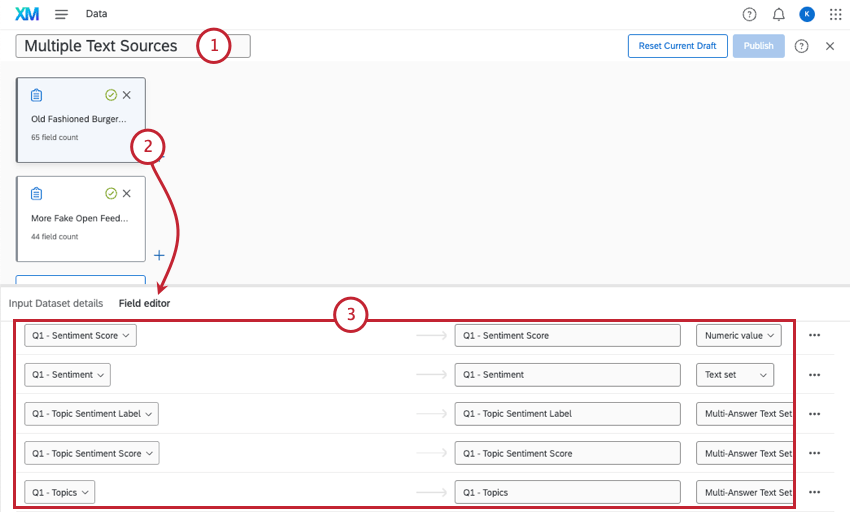
- Check each source’s Field editor.
- Make sure all Text iQ fields are mapped. Add them if not.
Qtip: Remember to follow these field formats.
- Open your union.
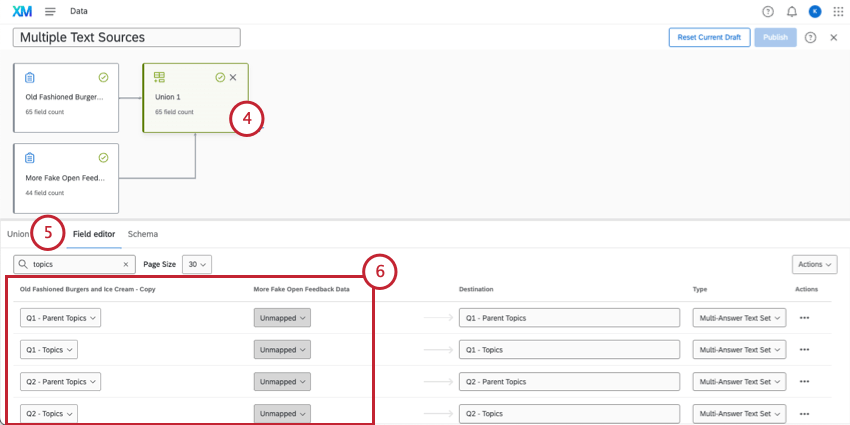
- Go to the Field editor.
- Go through each of the Text iQ fields and make sure they are only mapped to one source. If they’re mapped to multiple sources, set them to Unmapped for all but one source.
- Add a new field for each Text iQ field. Map them to your second source.
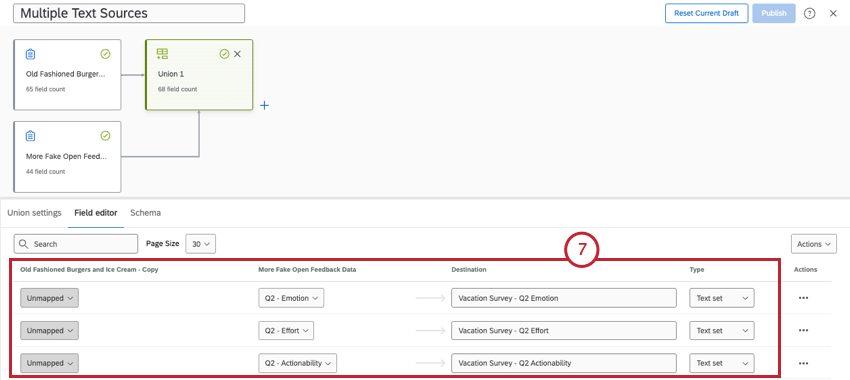 Example: If you have 2 sources, you should have 2 copies of each Text iQ field; one for each source.
 - Repeat steps as needed for each source.
Data Mapper
- Open your data mapper dataset.
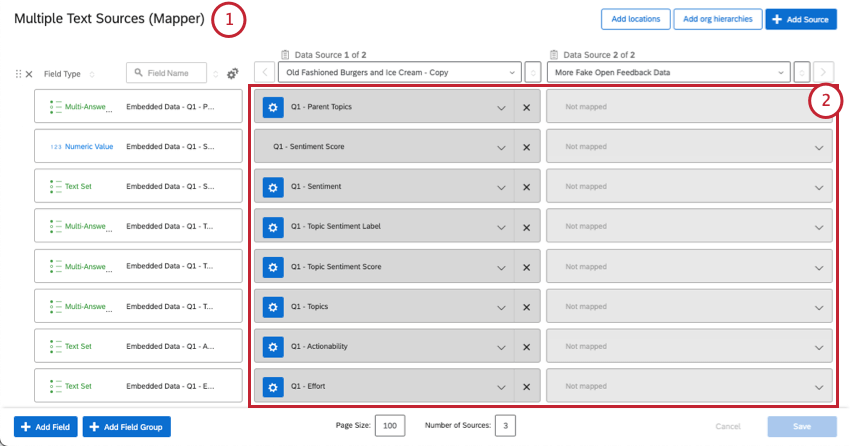
- Go through each of the Text iQ fields and make sure they are only mapped to one source. If they’re mapped to multiple sources, set them to Not mapped for sources that don’t apply.
- Add a new field for each Text iQ field.
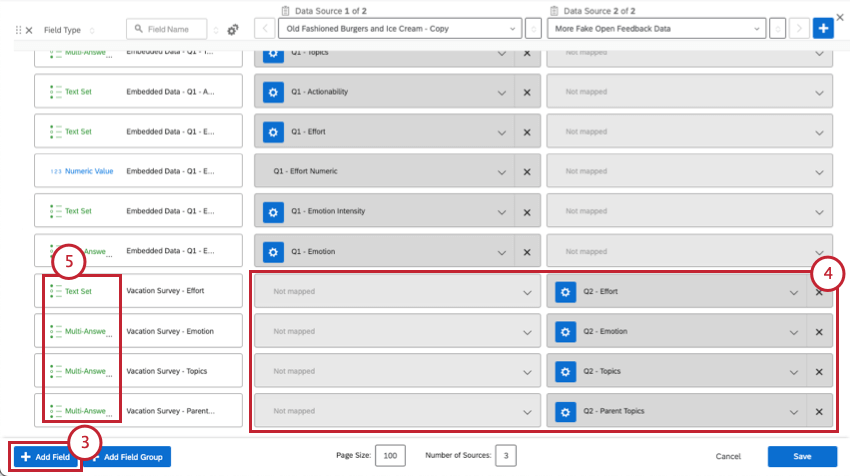
- Make sure the fields are only mapped to one source (your second source).
- Make sure the field types match the instructions from earlier.
- Repeat steps as needed for each source.
Adding Text Analysis to Widgets
Once you’ve finished creating your dataset and adding it to a dashboard, you’re ready to use Text iQ data to build reports. Each field you created can be added to any widget you want, so long as the type and the widget are compatible. You can also now create a Text iQ Table Widget and Text iQ Bubble Chart Widget.
