What is data analysis?
Data analysis is a systematic process that involves collecting, cleansing, transforming, and modeling data to uncover valuable insights that support decision-making. It’s a multidisciplinary approach that combines statistical techniques, computational methods, and domain expertise to extract meaningful patterns and knowledge from raw data.
Today, data analysis has evolved beyond traditional statistical methods to incorporate artificial intelligence, machine learning, and advanced visualization techniques. While data science typically focuses on quantitative computational techniques, data analysis encompasses a broader spectrum that includes both qualitative and quantitative approaches.
Data analysis typically revolves around two types of data:
Qualitative data
Qualitative data is descriptive and typically unstructured. It captures nuances, contexts, and subjective information that numbers alone cannot represent. Examples include:
- Interview transcripts
- Open-ended survey responses
- Field notes and observations
- Focus group recordings
- Social media conversations
- Customer feedback comments
- Case studies
Modern analysis of qualitative data often employs AI-powered text analytics and natural language processing to identify themes, sentiment, and patterns in large volumes of text data.
Quantitative data
Quantitative data consists of numerical values that can be measured and analyzed mathematically. It’s typically structured and suitable for statistical analysis. Examples include:
- Survey responses with numerical scales
- Sales figures and revenue data
- Website analytics (page views, bounce rates)
- Customer satisfaction scores
- Product usage metrics
- Demographic information
- Financial data
Quantitative data analysis has been enhanced by machine learning algorithms that can detect complex patterns and relationships that traditional statistical approaches might miss.
Qualitative + quantitative data
You can use both types of data to gain an understanding of the entire business landscape, from how your offering fits into the picture to what customers are looking for.
For example, it can be used to understand the marketplace, your business’ position within the marketplace, and provide customer insights around preferences, decisions and behaviors.
We’ve added a table below to provide you with an at-a-glance view of the differences between qualitative and quantitative research.
| Qualitative | Quantitative |
|---|---|
| Gathered from focus groups, interviews, case studies, expert opinion, observation, social media (via scraping) | Gathered from surveys, questionnaires, polls |
| Use open-ended and open text questions | Use closed-ended (yes/no) and multiple choice questions and open-ended responses (providing a coding scheme is applied to quantify the topics) |
| Uses a ‘human touch’ to uncover and explore an issue (e.g. a customer complaint) | Cannot use a ‘human touch’ to interpret what people are thinking or feeling |
| Helps to formulate a theory to be researched | Tests and confirms a formulated theory |
| Results are categorized, summarized and interpreted linguistically | Results are analyzed mathematically and statistically |
| Results expressed as text | Results expressed as numbers, tables and graphs |
| Fewer respondents needed | Many respondents needed |
| Less suitable for scientific research | Tests and confirms a formulated theory |
| Helps to formulate a theory to be researched | More suitable for scientific research as it is compatible with most standard statistical analysis methods |
| Harder to replicate | Easy to replicate |
| Less suitable for sensitive data: respondents may be biased, too familiar or inclined to leak information | Ideal for sensitive data as it can be anonymized and secured |
Find out more about qualitative and quantitative research solutions
Why is data analysis important?
The use of data in decision-making has become more important than ever. Across the globe, data-driven decision-making has become the cornerstone of successful business strategy. Organizations that leverage data effectively gain a significant competitive advantage through improved operational efficiency, enhanced customer experiences, and accelerated innovation.
Here are key areas where data analysis creates strategic value:
Customer insights
Modern data analysis provides a comprehensive understanding of your customers across their entire journey. You can identify patterns in customer behavior across multiple touchpoints, revealing how individuals interact with your brand through various channels and stages. With AI-powered predictive analytics, you can anticipate future purchasing decisions before customers make them, allowing for proactive engagement strategies.
Advanced clustering techniques help discover hidden segments within your customer base that might not be apparent through traditional demographic analysis. By mapping customer journeys in detail, you can pinpoint specific friction points and opportunities for enhancement that directly impact satisfaction and conversion. Connecting customer feedback with operational metrics creates holistic insights that bridge the gap between perception and actual business performance.
These enhanced insights enable you to create highly personalized experiences that drive loyalty and growth, turning data into meaningful customer relationships.
Marketing insights
Marketing effectiveness depends on accurate measurement and continuous optimization across all initiatives. You can evaluate campaign performance across all digital and traditional channels, comparing results against benchmarks to identify which strategies deliver the strongest returns.
Multi-touch attribution models allow you to attribute conversions to the right touchpoints throughout the customer journey, providing clarity on which marketing efforts truly drive results. Content strategy can be refined based on detailed engagement analytics, showing precisely what resonates with different audience segments. AI-powered text analysis measures brand sentiment across social media, reviews, and other sources, providing a real-time pulse on market perception.
By tracking the customer journey from initial awareness through to advocacy, you gain visibility into the complete marketing funnel and can address gaps at each stage. Data visualization plays a crucial role in communicating marketing insights effectively to stakeholders at all levels, transforming complex data into compelling visual stories that drive action.
Market insights
Understanding market dynamics is essential for strategic positioning and product development in today’s rapidly evolving business landscape.
Real-time monitoring of the competitive landscape keeps you informed of new entrants, pricing changes, and strategic pivots that could impact your market position. Identifying emerging trends before they become mainstream gives you first-mover advantage and allows you to position offerings ahead of market shifts. Advanced analytics enables you to quantify market opportunities with precision, allocating resources to areas with the highest potential return.
Systematically evaluating your value proposition against competitors enables you to highlight genuine differentiators and address potential vulnerabilities before they affect market share. Predictive modeling helps forecast market evolution, giving you insights into how consumer preferences, technological developments, and regulatory changes might reshape your industry.
By analyzing market data systematically, organizations can anticipate changes and adapt their strategies proactively rather than reactively, turning market intelligence into competitive advantage.
Free eBook: This year’s global market research trends report
Data analysis methods
Various data analysis methods serve different purposes, from describing current states to predicting future outcomes. Your choice depends on your research objectives and the types of insights you need.
Here’s a breakdown of the main approaches, updated with contemporary applications:
Descriptive analysis
Descriptive analysis examines historical data to identify patterns and summarize what has happened. It’s the foundation of data analysis, answering the question “What occurred?”
Modern application: E-commerce companies use descriptive analytics to track shopping behaviors during peak seasons, identifying which products gain traction, when purchases occur, and through which channels. This allows them to optimize inventory and marketing resources for future seasons.
Diagnostic analysis
Where descriptive analysis is about understanding trends, diagnostic analysis is the next stage in uncovering the causes of those trends and highlighting any correlation between the variables in your study.
Diagnostic analysis usually starts with a hypothesis that you’re trying to prove or disprove. For example, your hypothesis could be that the number of people signing up to a gym in August is caused by the hot weather. You’ll use this hypothesis to guide your data analysis and keep you focused on what you’re looking at.
When conducting diagnostic analysis, understanding the distinction between correlation and causation is crucial:
- Positive correlation: When two variables move in the same direction (as one increases, so does the other).
- Negative correlation: When two variables move in opposite directions (as one increases, the other decreases).
- Causation: When one factor directly causes another. Correlation doesn’t imply causation, but causation always implies correlation.
For example, a sudden spike in website errors might correlate with decreased conversion rates, but the underlying cause might be a recent software update that created compatibility issues. Identifying true causation leads to more effective solutions.
Modern application: A SaaS company experiencing increased customer churn might use diagnostic analysis to identify factors most strongly associated with cancellations. By analyzing product usage patterns, support interactions, and account characteristics before cancellation, they can pinpoint specific triggers and address them proactively.
Exploratory analysis
Exploratory analysis is used by data analysts to assess raw data and understand its primary characteristics, and then determine how to manipulate the data sources to get different answers.
Exploratory analysis is primarily used to prove the validity of results gathered from data and that they apply to any goals or objectives. Essentially it’s used as a way to use data before making any assumptions about a situation.
Once the raw data is collected, data analysts can then manipulate the data sources to test the impact of changing variables on the overall results. It can be particularly useful when checking assumptions, uncovering anomalies and discovering patterns.
Exploratory analysis can also be used for more complex studies and modeling, like machine learning.
Modern application: Product development teams often use exploratory analysis on customer interaction data to identify unexpected usage patterns. This might reveal that customers are using certain features in ways designers didn’t anticipate, inspiring new product directions or improvements.
Predictive analysis
As the name suggests, predictive analysis is a data analysis process that uses historical data, algorithms and even machine learning to try to predict what will happen in the future based on previous trends.
Predictive analysis has been rapidly growing in popularity in businesses and organizations as the data analysis tools used to map the future predictions – and better advances in machine learning – have made predictions more accurate.
It also has multiple business applications, which is another reason it’s so popular.
For example, predictive analysis is becoming a key part of cyber security and crime prevention — particularly when it comes to fraud.
By compiling vast amounts of data in real-time and analyzing results and trends to uncover patterns, predictive analysis can help data analysts detect abnormalities in behavior or actions based on previous events and take the necessary actions.
Reducing consumer risk is another major area for predictive analytics and it’s often used when assessing credit scores and predicting whether customers can afford to take on expensive financial products – like a mortgage or loan – based on their previous history.
Leisure businesses like airlines and hotels also use predictive analytics by using data from previous years to predict usage when setting prices.
Modern application: Healthcare providers now use predictive analytics powered by AI to analyze patient data and identify individuals at risk for specific conditions before symptoms appear. These models consider numerous variables including vital signs, lab results, genetic factors, and lifestyle information to enable earlier interventions.
Prescriptive analysis
Prescriptive analysis is one of the more advanced data analysis techniques and is often used by businesses and organizations trying to work out what decisions to make, or what steps they need to take to make something happen, such as increasing sales in Q4 compared to the previous year.
It involves data mining from multiple sources like resources, historical data and past performances and using advanced analysis techniques like machine learning to model the data and provide insights to guide future decisions.
It’s a relatively new type of data analysis because it relies on the collection and analysis of huge amounts of data and advanced technology like artificial intelligence or machines to process and analyze the data effectively.
As more data is provided and analyzed, the models will become more accurate and change based on the variables being input.
Prescriptive analysis is often accompanied by data visualization tools to help decision-makers understand what they’re looking at and take appropriate actions.
It does, however, require businesses and organizations to know the types of questions to ask to gain the correct information and stop people from making decisions based on the wrong assumptions. It also requires the ability to make the right judgments based on the data models provided.
Modern application: AI-powered prescriptive analytics helps renewable energy companies optimize energy distribution across power grids. By analyzing weather patterns, consumption trends, equipment efficiency data, and market prices, these systems can automatically adjust energy distribution to maximize efficiency and minimize costs in real-time.
The data analysis process
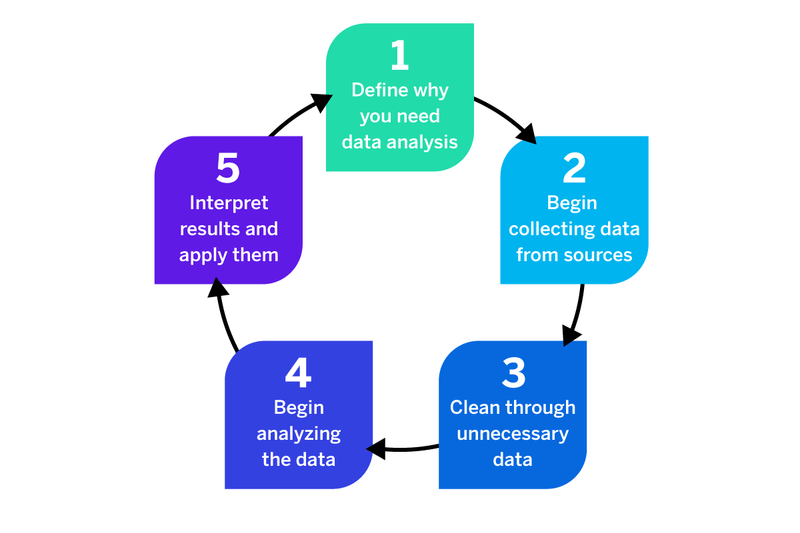
The data analysis process follows a structured approach that ensures accuracy and relevance, regardless of the specific techniques employed.
You can see the outline of the data analysis process in the graphic above, but this is a quick rundown of the data analysis steps you’ll take:
1. What’s the goal of the objective?
Begin by clearly articulating why you’re analyzing data and what questions you aim to answer.
Do you need it to guide strategic business decisions or update business processes? Are you trying to find an answer to a specific question or do you want to test a hypothesis? Or do you need to make improvements to operational processes but don’t know where to start?
Why you need data can help you figure out the right data analysis methods to choose and also guide key decisions like whether you need qualitative data analysis or quantitative data analysis (or a combination of the two).
Then there’s the what of your data analysis — what data should you be collecting? What conclusions do you want to draw from the data? Clearly defining the what will help you to select the appropriate tools and methodology to capture the data for the why. Well-defined objectives might include improving customer retention rates, optimizing marketing spend, or identifying product improvement opportunities.
2. Collecting raw data
Once you’ve decided why you need the data and what method of data analysis is best, you can start the process of collecting your raw data. With clear objectives established, gather relevant data from appropriate sources:
- Primary research (surveys, interviews, observations)
- Internal operational systems (CRM, ERP, sales platforms)
- External sources (market research, industry reports, social media)
- IoT devices and sensors
- Third-party data providers
This could be devising and sending out surveys for quantitative data analysis, emailing customers questionnaires or running focus groups for qualitative data analysis. But remember, modern data collection often involves APIs, automated scraping tools, and integrated data platforms to streamline the process.
3. Data cleaning
Data preparation is crucial for accurate analysis and typically consumes a majority of the total analysis time.
Regardless of how you collect your data, you have to account for errors and put measures in place to prevent them. For example, preventing participants from submitting the same survey twice to avoid duplication. Instead, allow them to modify their answers (if it’s an online survey).
For incomplete surveys, questionnaires or interviews, ensure that participants can only submit them once they’ve filled in the required fields. If they don’t have an answer, encourage them to put N/A, for instance. Advanced data preparation tools now incorporate AI to automate many of these tasks while maintaining data integrity.
Incorrect, incomplete and duplicate responses can affect the quality, consistency and usability of your data, preventing you from making accurately informed decisions.
4. Begin analyzing data
Once you’ve collected and cleansed your data, you can begin the process of data analysis. As you’re analyzing your data you’ll be able to identify patterns in your data that you can use to inform your business decisions.
The most common data analysis techniques
Regression analysis: Estimates relationships between variables to predict outcomes. For example, an insurance company might use regression to understand how factors like age, driving history, and vehicle type affect claim likelihood.
For example, if you’ve been planting trees in an area at the same rate every day for a year, it can predict how many trees you’ll have planted in 5 or 10 year’s time.
Time series analysis: Identifies trends and seasonal patterns in sequential data points. Retail businesses use this to forecast demand fluctuations throughout the year, enabling more precise inventory management.
For example, time series analysis is helpful when it comes to industry forecasts, weather data and rainfall measurements, and stock prices. This is because rather than collecting data over time, analysts record data points at specific intervals, giving a complete, constantly evolving picture of the data.
Monte Carlo simulation: Generates multiple probability-based scenarios to understand possible outcomes and their likelihood. Investment firms use this to model portfolio performance under various market conditions.
For example, you could use Monte Carlo simulation to determine which moves to play in chess (of which there are between 10111 and 10123 positions (including illegal moves), which is more than the number of atoms in the world. The computer essentially calculates all these possible moves (with the most powerful computers doing trillions of calculations per second) and continuously plays until it satisfies a set end condition, e.g. a win.
Factor analysis: Reduces complex datasets to fewer, more meaningful variables. Marketing teams might use factor analysis to identify key drivers of customer satisfaction from extensive survey data.
For example, say you conduct a survey of 500 townspeople, resulting in a dataset of 500 variables. You could work to find which variables are correlated and put them into groups, e.g. income, education, family size. These groups are factors. From there, it becomes easier to analyze the data.
Cohort analysis: Groups similar users based on shared characteristics or experiences to track how behaviors evolve over time. Subscription businesses use cohort analysis to understand how retention rates differ based on when customers signed up.
For example, you could use cohort analysis to understand customer expenditure over time. You can analyze trends in purchase behavior and then gauge whether or not the quality of the average customer is increasing throughout the lifecycle.
Cluster analysis: Identifies natural groupings within data based on similarity. E-commerce companies use clustering to create customer segments based on purchasing behaviors, allowing for targeted marketing strategies.
For example, in medicine and healthcare, you can use cluster analysis to identify groups of patients with similar symptoms. From there, you can alter your method of care. You can also use cluster analysis in areas like marketing to identify homogeneous groups of customers that have similar needs and attitudes.
Sentiment analysis: A qualitative technique that evaluates and classifies emotions expressed in text data. Brands use sentiment analysis to monitor social media mentions and gauge public perception of their products and services.
5. Data interpretation
Once you’ve finished analyzing data from your study, you can begin your data interpretation and begin to apply actions based on what the results are telling you. This analysis allows you to transform findings into actionable insights by following a structured interpretation process that extracts maximum value from your data.
Begin by identifying key patterns and relationships within your results, looking beyond surface-level observations to uncover meaningful connections that might not be immediately obvious. Rigorously test hypotheses against your results to verify assumptions and challenge preconceived notions about what drives your business outcomes.
- Consider business context and limitations when interpreting findings, recognizing that data always exists within a broader operational and market environment that influences its meaning.
- Develop concrete recommendations that translate analytical insights into clear actions teams can implement, bridging the gap between analysis and execution.
- Create visual representations of your findings that communicate complex relationships in accessible ways for different audiences across your organization.
Modern data interpretation often leverages interactive dashboards and automated insight generation with business intelligence tools to make findings accessible to non-technical stakeholders, democratizing data and fostering a culture of informed decision-making throughout the organization. We’ll outline a few of those tools shortly — but first, here are a few mistakes to avoid.
Diligence is essential when it comes to data analysis — but when you’re running complex studies at scale, it’s sometimes hard to keep on top of the quality and assurance process.
Even with advanced tools and methodologies, data analysis is prone to several pitfalls that can undermine its validity and usefulness.
Here are just a few of the most common data analysis mistakes researchers make and how to avoid them:
Sample bias
Sample bias occurs when your data doesn’t accurately represent the population you’re trying to understand.
Any bias in your sample can result in data skewing more to one side and not providing reliable results.
A simple example of this is sampling 1,000 people to assess political preferences but oversampling one political allegiance.
One of the most effective ways to avoid sampling bias is to use simple random sampling. This ensures that samples are chosen by chance — and every person in the population has an equal chance of being selected.
Modern challenge: With more data collection happening online, digital exclusion can create significant bias. People without internet access or limited digital literacy may be systematically excluded from your analysis.
Modern solution: Implement multi-channel data collection strategies combining digital and traditional methods. Use statistical weighting techniques to correct for known population differences.
Confirmation bias
Confirmation bias happens when analysts unconsciously favor data that supports their existing beliefs while dismissing contradictory evidence.
Modern challenge: In an era of information overload, it’s increasingly tempting to cherry-pick data that aligns with pre-existing views or desired outcomes.
Modern solution: Establish hypothesis testing protocols before analysis begins. Have multiple analysts review the same data independently. Create a culture that rewards discovering the unexpected.
Data privacy violations
Improper handling of personal data can lead to privacy breaches and regulatory violations.
Modern challenge: With stricter data protection regulations like GDPR and CCPA, organizations face significant penalties for mishandling personal information.
Modern solution: Implement privacy by design principles in your data collection. Use anonymization and pseudonymization techniques. Ensure proper consent mechanisms and data governance structures.
Algorithm bias
AI and machine learning models can perpetuate or amplify existing biases in training data.
Modern challenge: As organizations increasingly rely on automated analysis, undetected bias in algorithms can lead to systematically flawed decisions affecting individuals.
Modern solution: Regularly test algorithms for fairness across demographic groups. Use diverse training data. Implement human oversight for high-stakes decisions.
Correlation-causation confusion
Mistaking correlation for causation leads to incorrect conclusions about relationships between variables.
Modern challenge: With more data available, spurious correlations are increasingly common and can lead to misguided strategies.
Modern solution: Use controlled experiments when possible. Apply causal inference techniques rather than relying solely on correlational analysis. Consider alternative explanations for observed patterns.
Data quality issues
Poor data quality undermines even the most sophisticated analysis techniques.
Modern challenge: As data volumes grow and sources diversify, maintaining consistent data quality becomes increasingly difficult.
Solution: Implement automated data validation procedures. Establish clear data governance policies. Document data lineage to understand how data transforms throughout its lifecycle.
Ignoring context
Focusing solely on numbers without understanding the broader context can lead to misinterpretation.
Modern challenge: With automated analysis becoming more common, contextual factors may be overlooked in favor of pure statistical relationships.
Modern solution: Combine quantitative analysis with qualitative research. Include domain experts in the interpretation phase. Consider external factors that might influence your data.
What data analysis tools can you use?
There are several tools available that can make analyzing raw data easier and improve your data visualization so you can easily interpret your information and make decisions.
Here are some of the most common and best data analysis tools available:
R
R remains a powerful open-source platform for statistical computing and graphics, now enhanced with AI capabilities through packages like ‘caret’ for machine learning and ‘text2vec’ for natural language processing. It’s particularly strong for specialized statistical analysis and academic research.
SAS
SAS is one of the most widely used software packages for data analysis. It’s primarily used for statistical analysis and data visualization.
As well as quantitative analysis, SAS can be used for qualitative analysis, is highly customizable based on the data analysis you want to use, and offers a range of statistical methods and algorithms.
Python
Python has emerged as the leading language for data science and AI applications. Libraries like Pandas provide data manipulation capabilities, while scikit-learn, TensorFlow, and PyTorch enable sophisticated machine learning. Python’s flexibility makes it ideal for everything from basic analysis to advanced AI implementations.
Java
Java is one of the most versatile statistical programming languages as well as coding languages that can be used for numerous types of data analysis. Java can be connected to SQL and MySQL databases. It’s also highly customizable and can be used for mass data scraping, analysis, and visualization.
SQL
SQL continues to be essential for working with relational databases, with modern implementations supporting advanced analytics functions. Cloud-based SQL platforms now offer integrated machine learning capabilities, allowing for in-database predictive analytics without moving data.
Business Intelligence Platforms
Tools like Tableau, Power BI, and Looker have evolved beyond visualization to incorporate AI-powered analytics that transform how organizations interact with their data. Automated insight generation highlights significant patterns without requiring manual exploration, surfacing anomalies, correlations, and trends that might otherwise remain hidden within complex datasets.
These advancements collectively transform business intelligence from static reporting into dynamic, accessible analysis that drives informed decision-making at all organizational levels.
AI-powered data analysis
Artificial intelligence has transformed market research and data analysis capabilities, enabling organizations to process larger volumes of data, uncover deeper insights, and automate complex analytical tasks. Here’s how AI is revolutionizing data analysis:
Machine learning for pattern recognition
Machine learning algorithms excel at identifying complex patterns in data that traditional statistical methods might miss:
- Supervised learning predicts outcomes based on labeled historical data
- Unsupervised learning discovers hidden patterns without predefined labels
- Reinforcement learning optimizes actions based on feedback from the environment
For example, retailers use machine learning to analyze transaction data and identify subtle purchase patterns that indicate potential fraud, reducing losses while minimizing false positives.
Natural language processing (NLP)
NLP enables the analysis of unstructured text data at scale:
- Text classification automatically categorizes customer feedback by topic
- Sentiment analysis evaluates emotional tone in reviews and social media
- Entity extraction identifies key people, places, and concepts in documents
- Language generation creates summaries of complex findings
Healthcare organizations use NLP to analyze physician notes and identify patients with similar conditions who might benefit from comparable treatments.
Computer vision
Computer vision applies AI to visual data:
- Image recognition identifies objects, people, and scenes
- Anomaly detection spots unusual patterns in visual data
- Emotion recognition interprets facial expressions
- Visual search finds similar images based on content
Retailers use computer vision to analyze in-store customer movement patterns, optimizing store layouts to improve the shopping experience and increase conversions.
Augmented analytics
Augmented analytics combines AI with business intelligence to:
- Automatically generate insights from complex datasets
- Recommend relevant visualizations based on data characteristics
- Create natural language explanations of findings
- Suggest follow-up questions based on initial findings
This democratizes data analysis by making advanced capabilities accessible to non-technical users. In short, AI-powered capabilities help you move from data to insights to action more quickly and effectively.
Ethical considerations in AI-powered data analysis
As AI becomes increasingly integrated into data analysis workflows, organizations must address important ethical considerations:
Privacy and consent
AI systems can extract insights from data that individuals didn’t explicitly consent to share, creating complex ethical challenges for responsible data practitioners.
Ensuring transparent data collection practices with clear consent is foundational, requiring organizations to communicate in plain language exactly how data will be used and what insights might be derived from it. Organizations must vigilantly avoid “function creep” where data collected for one purpose gradually becomes used for additional purposes not covered in the original consent, eroding trust and potentially violating regulations.
Implementing differential privacy techniques can protect individual data while still allowing for valuable aggregate insights, creating mathematical guarantees that prevent re-identification of individuals within datasets. Regular audits of data usage against consent agreements should be conducted to verify alignment between practices and promises, creating accountability and establishing a verifiable track record of responsible data stewardship.
By treating privacy and consent as ongoing commitments rather than one-time checkboxes, organizations can build sustainable data practices that respect individual rights while still delivering valuable insights.
Algorithmic fairness
AI algorithms can perpetuate or amplify existing biases, potentially leading to discriminatory outcomes that affect real people’s lives.
Thorough testing across different demographic groups is essential to identify disparate impacts before deployment, revealing how algorithms may produce different results based on characteristics like race, gender, or socioeconomic status. Using diverse training data that represents all relevant populations helps ensure the algorithm learns patterns that apply universally rather than reflecting historical inequities baked into limited datasets.
Organizations should implement fairness metrics and constraints during model development, establishing quantitative measures that define what constitutes fair treatment across different groups. It’s crucial to consider the historical context of your data and how it might reflect systemic biases that have existed in society, recognizing that even seemingly objective data often contains embedded historical discrimination.
By approaching algorithmic fairness as a fundamental design requirement rather than an afterthought, organizations can create AI systems that advance equity rather than reinforcing existing disparities.
Transparency and explainability
Complex AI models often function as “black boxes,” making their decisions difficult to understand and creating challenges for accountability and trust.
Prioritizing explainable AI approaches for high-stakes decisions ensures that humans can comprehend and evaluate the reasoning behind automated recommendations, especially when significant consequences may result. Thoroughly documenting model assumptions and limitations creates a record of what the system is designed to do and where it might fail, establishing realistic expectations for performance.
Organizations should provide stakeholders with appropriate levels of technical explanation tailored to their background and needs, translating complex processes into understandable terms without oversimplification. Maintaining human oversight for critical applications ensures that AI augments rather than replaces human judgment, especially in domains like healthcare, finance, and criminal justice where decisions profoundly affect lives.
By making transparency and explainability core design principles rather than afterthoughts, organizations can develop AI systems that earn trust through their understandability and appropriate self-disclosure of limitations.
Data sovereignty and ownership
Questions about who owns data and derived insights are increasingly important in an interconnected world where information flows across borders and jurisdictions.
Respecting cultural and community data ownership principles acknowledges that certain types of information, particularly from indigenous communities or vulnerable populations, may have special significance beyond commercial value. Organizations must consider the impact of analysis on marginalized communities who historically have had their data exploited without receiving benefits or having input into how that information is used and interpreted.
Establishing clear data sharing agreements with stakeholders creates transparent governance frameworks that define rights, responsibilities, and limitations for all parties involved in the data lifecycle. Organizations should recognize the value exchange when collecting and using personal data, ensuring that individuals receive meaningful benefits in return for sharing their information rather than treating data as a free resource to be extracted.
By approaching data sovereignty and ownership with respect and reciprocity, organizations can establish more equitable relationships with the communities and individuals whose data drives their insights.
Environmental impact
AI-powered data analysis can have significant environmental costs that are often overlooked in the pursuit of more sophisticated insights.
Evaluating the computational resources required for analysis should be a standard part of planning, considering the energy consumption of training large models and running complex simulations repeatedly. Organizations should acknowledge the environmental impact of data centers and cloud computing, which collectively account for a growing percentage of global electricity consumption and associated carbon emissions.
Optimizing algorithms for efficiency can dramatically reduce computational requirements, with techniques like pruning, quantization, and knowledge distillation enabling similar results with a fraction of the resources. Decision-makers should balance analytical depth against environmental considerations, determining when simpler approaches might deliver sufficient insights without the ecological footprint of more complex methods.
By incorporating environmental impact into the evaluation criteria for analytical approaches, organizations can align their data practices with broader sustainability goals and reduce the hidden environmental costs of digital transformation.
Responsible implementation
Organizations should establish governance structures for ethical AI use that provide systematic oversight and accountability throughout the data lifecycle.
Developing clear ethical guidelines for data analysis creates a framework that helps practitioners navigate complex decisions about data collection, model development, and insight application. Creating diverse ethics committees with multiple perspectives ensures that potential issues are viewed through different lenses, including technical, legal, social, and cultural considerations that a homogeneous group might overlook. Implementing regular ethical audits of data analysis practices provides verification that actual behaviors align with stated principles, catching deviations before they become problematic patterns.
Organizations should train analysts in ethical considerations relevant to their work, moving beyond compliance to build a culture where ethical reflection becomes an integral part of professional practice.
By treating responsible implementation as a structural requirement rather than individual choice, organizations can create systems that consistently produce ethical outcomes even as technologies and applications evolve.
Using data analysis to improve your ROI
Data analytics drives ROI by enabling more efficient resource allocation, identifying growth opportunities, and reducing costs through optimization. With AI-powered analysis, these benefits are amplified through faster insights and deeper pattern recognition.
Here are practical examples:
A healthcare provider used predictive analytics to identify patients at risk for readmission. By implementing targeted interventions for these high-risk patients, they reduced readmission rates, improving both patient outcomes and financial performance.
A retailer applied conjoint analysis to optimize their product assortment, identifying which features customers valued most at different price points. This data-driven approach increased conversion rates while maintaining healthy margins.
An educational institution used clustering analysis to identify student engagement patterns correlated with retention. By implementing targeted support programs for at-risk segments, they improved retention rates, significantly enhancing both student success and institutional revenue.
The key to maximizing ROI from data analysis lies in connecting insights directly to business outcomes and implementing closed-loop systems that measure the impact of data-driven decisions.
Leverage Qualtrics Research Services to get more from your data
If you don’t have a team of research experts in-house to carry out your data analysis, one option is to outsource the process. With Qualtrics® Market Research, you can count on us to design your study, find respondents, field it and report on the results. We’re with you every step of the way.
Get expert help with survey design and research methodology — including everything from cluster analysis to Van Westendorp pricing, and access more than 90 million panelists, ensuring your study reaches the right people at the right times.
Conduct high-quality data analysis with Qualtrics Strategy & Research
Conducting data analysis isn’t just about collecting and analyzing raw data, it’s about getting information that lets you take actions to generate business value.
Whether it’s qualitative research and quantitative analysis, ensuring you can collect, analyze and utilize research data is key to guiding decision-making. And with Qualtrics’ Strategic Research, you can.
Strategic Research is an advanced, AI-powered market research solution that combines experience feedback, sophisticated methodologies and analytics in a single platform. With guided solutions and automation to help turn insights into action, from workflows to integrations, Strategic Research helps to deliver real business impact.
Through Strategic Research, obtain immediate insights, reduce market research costs, improve productivity and create breakthrough experiences at every stage.
Free eBook: This year’s global market research trends report