

Frontend Development
Optimizing Qualtrics Lighthouse Performance with 4 lines of JavaScript
Introduction
At Qualtrics, one of our core values is being customer obsessed, and our pursuit of that value leads us to relentlessly explore ways we can improve our customers’ experiences in impactful ways. In Engineering, this is a big responsibility to own and as such I dedicated time and effort to learn more about Google Lighthouse. In this blog post, I outline my investigation into Lighthouse performance scores, and how that investigation led to a 4‐line code change that improved Qualtrics’ contribution to the score by 100%. Google Lighthouse has increasingly become an industry standard for measuring website performance against an array of performance indicators and identifying areas for improvement. Google’s announcement that Core Web Vitals (part of Lighthouse scoring) will now affect page ranking (SEO), means that optimizing Qualtrics’ impact to Lighthouse scores is now of utmost importance to our customers.
Working on the Qualtrics Digital Experience team means that I get to work at the interface between Qualtrics and our customers’ websites. The Qualtrics Digital CX solution enables brands to collect feedback directly from their customers inline within their mobile apps and websites through personalized feedback widgets and APIs. The JavaScript code we ship to production runs at ‘web scale’ and gets run as a third party script across all our customers’ websites. This translates to around a billion page views each day! Because of this, optimizing the lighthouse score is a big win for our customers.
Investigating Website Feedback’s effect on the Lighthouse Performance Score
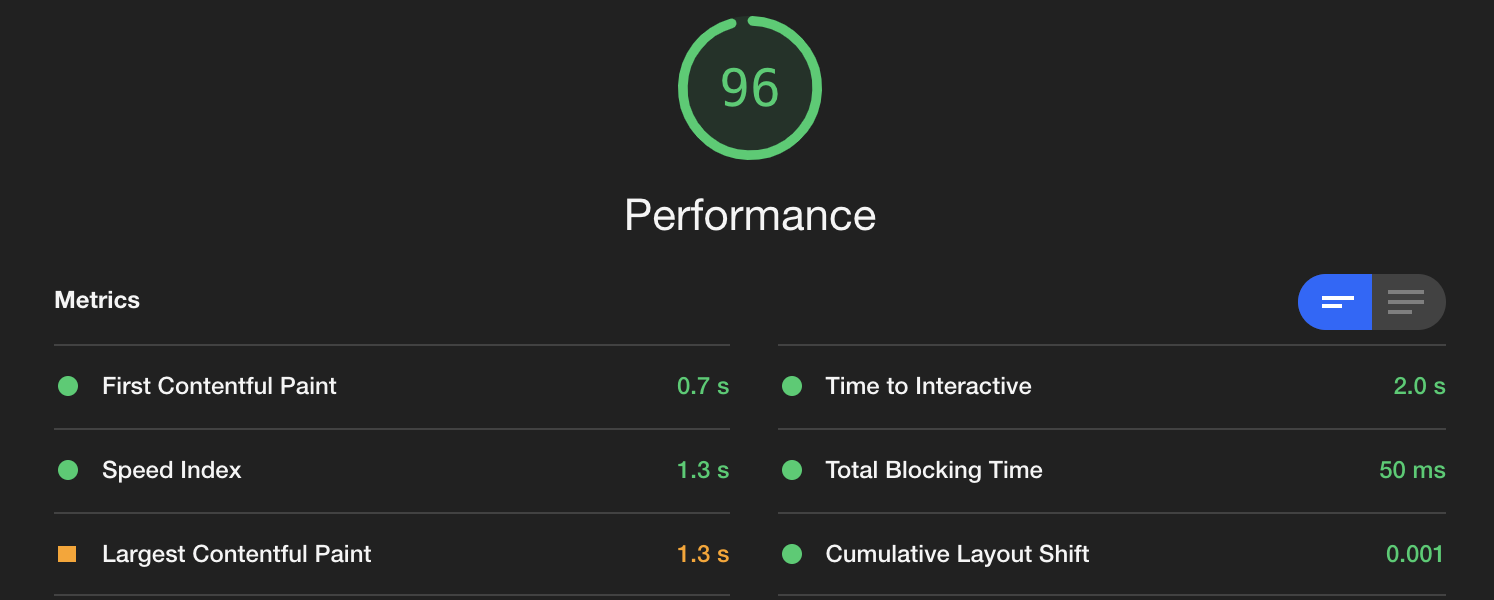
The Lighthouse performance score is computed based on 6 different performance metrics, each with a different weighting. The six metrics and their respective weighting are:
- First Contentful Paint (FCP) — 15%
- Speed Index — 15%
- Largest Contentful Paint — 25%
- Time to Interactive — 15%
- Cumulative Layout Shift — 5%
- Total Blocking Time — 25% (Spoiler: this is where our code had the most impact)
Due to variations between Website Feedback Intercept logic and type of UI widget configured, these capabilities can impact Lighthouse metrics to various degrees depending on the parent page as well as the complexity of the intercept, causing the overall performance score to fluctuate either up or down depending on the situation. I evaluated how Qualtrics Website Feedback affected these metrics by blocking all requests to Qualtrics using Chrome dev tools, running a Lighthouse performance test, then comparing those results to a Lighthouse performance test with Qualtrics enabled. The following sections outline how Qualtrics Website Feedback can affect each of these metrics and how that contributes to overall performance score.
First Contentful Paint
FCP measures how long it takes the browser to render the first piece of Document Object Model (DOM) content after a user navigates to your page. Because this measurement is only concerned with the very first piece of content on the page, and Qualtrics Website Feedback loads its content asynchronously after the primary page content has loaded, Website Feedback does not have any effect on the FCP metric. Thus, despite this metric carrying a high (15%) weighting toward the overall score, Website Feedback does not play a significant role in affecting it. If Lighthouse highlights FCP as an area of specific concern for your overall site, focus should be placed on any blocking code or dependencies (styles, images) that are loading as part of the initial page content.
Speed Index
Speed Index measures how quickly content is visually displayed during page load. This is distinct from FCP in that it measures how long it takes for all of the visual content on the page to appear, not just the first content. The index score is based on a comparison to the speed of other websites collected by Google. Because Website Feedback is intentionally loaded after the main page content there’s an intentional added delay for the page to be "visually complete" (time for main page content + time for Website Feedback to load). In addition if there are numerous active intercepts on the page, evaluating all of the targeting logic for each of the intercepts prior to rendering can negatively impact the Speed Index score. If intercepts triggered on page load are prominently displayed on the page it’s also possible that latency from Website Feedback targeting could have a slight negative impact to the Speed Index score, but this slight impact is generally offset by the value of flexible, personalized feedback collection from the intercept.
Largest Contentful Paint
The Largest Contentful Paint (LCP) metric reports the render time of the largest image or text block visible within the viewport, relative to when the page first started loading. The impact of Qualtrics Website Feedback on this heavily weighted (25%) metric varies depending on the type of intercept being used. For most intercept types there will be no impact to LCP from Website Feedback; however for intercepts featured prominently on the top of the page that trigger on page load and contain large text blocks or images (Info Bar, Custom HTML) impact can be significant. This is due to the fact that Lighthouse identifies the largest text/image block within the viewport and if an intercept contains the largest text or image block in the viewport the LCP time will be measured by the time it takes for the intercept to render. Due to the fact that Qualtrics Website Feedback intentionally loads after the rest of the primary page content, if an intercept is flagged as the LCP element it can significantly add to the overall LCP time (due to the intentional render delay). This is not something that can be improved through changes to Qualtrics code. In this situation, it may be prudent for a customer to re‐evaluate whether the large text blocks or images can be eliminated from the intercept.
Time to Interactive
TTI measures how long it takes a page to become fully interactive. A page is considered fully interactive when:
- The page displays useful content, which is measured by the First Contentful Paint,
- Event handlers are registered for most visible page elements, and
- The page responds to user interactions within 50 milliseconds.
Due to Qualtrics Website Feedback having low/no effect on the First Contentful Paint metric and its deferred loading behavior, the TTI score is largely unaffected by Website Feedback code. If TTI is highlighted as an area of concern by Lighthouse, focus should be given to reducing the size of initial JavaScript dependencies or reducing reliance on other 3rd party JavaScript long running tasks in the main thread.
Cumulative Layout Shift
CLS measures the sum total of all individual layout shift scores for every unexpected layout shift that occurs during the entire lifespan of the page. A layout shift occurs any time a visible element changes its position from one rendered frame to the next. While some intercept types can cause a slight amount of layout shift (an inline info bar animating in for example), in practice the low weighting of this metric (5%) makes any Website Feedback impact to CLS negligible in the context of the overall performance score. Small improvements to the CLS have little impact on the Performance score, so Website Feedback does not affect performance through CLS in any meaningful way.
Total Blocking Time
TBT measures the total amount of time that a page is blocked from responding to user input, such as mouse clicks, screen taps, or keyboard presses. The TBT sum is calculated by adding the blocking portion of all long tasks between First Contentful Paint and Time to Interactive. Any task that executes for more than 50 ms is a long task. The amount of time after 50 ms is the blocking portion. For example, if Lighthouse detects a 70 ms long task, the blocking portion would be 20 ms (70 − 50). TBT is one of the two heaviest weighted metrics (25%) and is also the metric with the highest potential to be affected by 3rd party JavaScript (due to the potential of long running scripts). In my investigation, I observed that our Website Feedback code was negatively contributing to the TBT score in all test runs. The silver lining was that I knew improvements would yield big benefits to the overall performance score due to the 25% weighting of TBT. With this information in hand, I decided to focus all my efforts on finding out why our code was impacting TBT, and eliminating any negative affect our code had on that score.
Deep Diving on TBT — Finding the problem
Armed with the knowledge that TBT was where our code was having a negative impact, I set out to find where our code was blocking the main (single) JavaScript thread. Thankfully, Chrome Dev Tools has an excellent feature in the Performance Tab that enables creating a performance profile to explore the timing, depth, and duration of the code that executes on the page in a ‘flame chart’ graph.
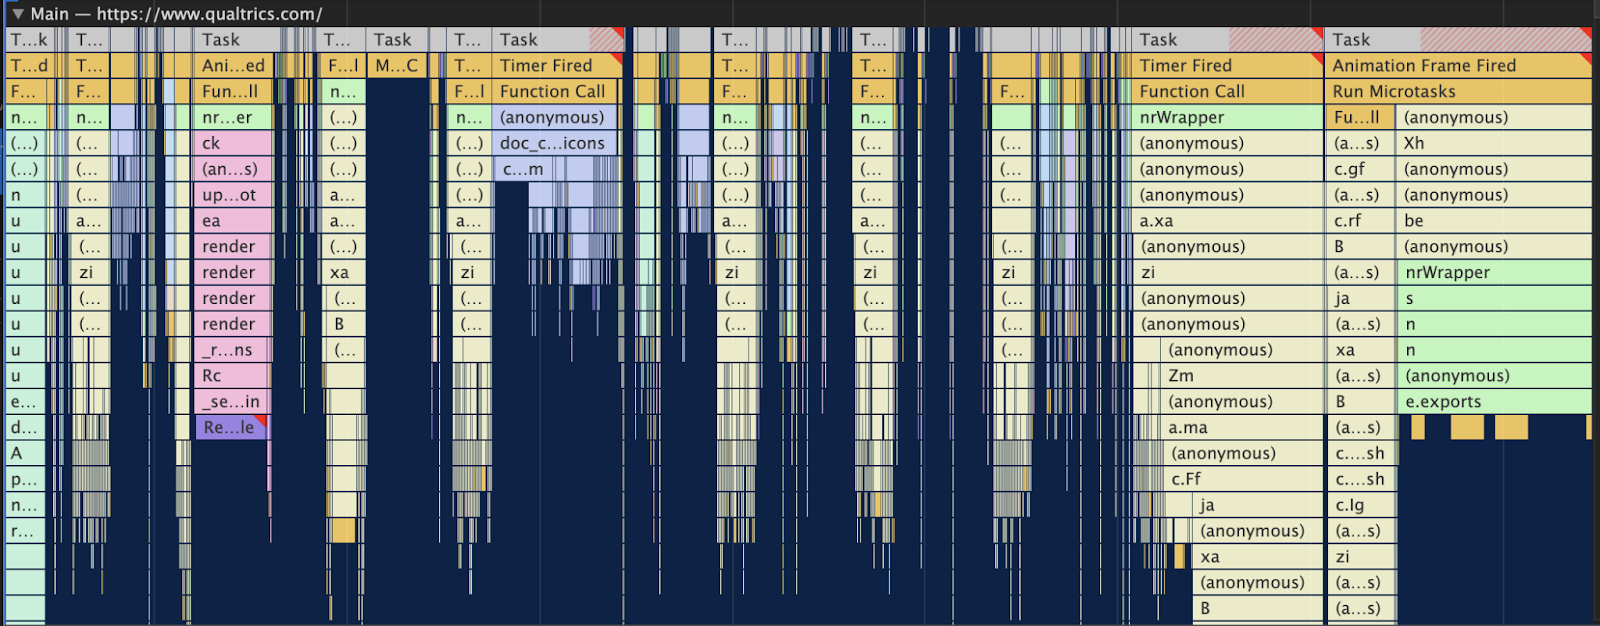
When looking at these flamecharts the very top ‘Task’ sections represent a single JavaScript task. When the task exceeds 50 ms, the portion of the task over 50 ms is highlighted with a red hash.

Since TBT scores are based on tasks that exceed 50ms, these red hashes are a great way to zero in on code that is negatively impacting the Lighthouse TBT score. Using this technique I was able to quickly find the section of our code that was consistently exceeding the 50 ms threshold (see below).

From the chart it became clear that the code that evaluates the targeting logic for each of the Website feedback intercepts (e.doCSTargetingEvaluation) and the code that loads all of our JavaScript dependencies (e.loadModules) was all running as a single synchronous task that was blocking the main thread well past the 50ms threshold, and because of this, the more intercepts on the page, the worse the TBT score would become. The problem was now clear — a large section of our code was running as a single, long‐running JS task.
Solving the problem
The solution to this problem may seem obvious: break the long running task into smaller, separate tasks, so that no single task exceeds the 50ms threshold that Lighthouse counts against the TBT score. However, to those not familiar with the mechanics of the JavaScript runtime environment, the way to actually do this task splitting may not be immediately obvious.
The concepts of the JS event loop, tasks, and microtasks could be a blog post unto itself (check out the Mozilla Developer Network docs). At a high level though, the JS runtime is essentially an infinite loop that processes a queue of incoming events, schedules tasks associated with those events, and runs any previously scheduled tasks all in the same main thread responsible for rendering html and responding to user interactions. Put another way, the entire time the JS runtime is tied up executing your long‐running task, it isn’t able to respond to any user interactions, which is why Lighthouse negatively scores long‐running tasks in the first place. The good news is, JavaScript provides different tools for explicitly scheduling code as a task, and one of the simplest is the setTimeout function. The setTimeout function is often used to ‘run code after a delay’. For example:
setTimeout(() => {
console.log("Hello!");
}, 1000);
This will print ‘Hello’ after 1 second (1000 ms). More accurately though, this code will cause a task to be scheduled that will print ‘Hello’, and that task will run after 1 second. In that context, the following code without the ‘1000’ delay argument is also valid:
setTimeout(() => {
console.log("Hello!");
});
This code will schedule a task that will print ‘Hello’ the next time the JavaScript event loop runs.
Understanding this concept made the solution to the TBT problem trivial once it was identified. I simply changed our intercept targeting function (the doCSTargetingEvaluation function from above) from this:
ClientSideTargeting.evaluateIntercept(intercept);to this:
setTimeout(() => {
ClientSideTargeting.evaluateIntercept(intercept);
});
This tiny change caused that function to break all of our evaluations into separate tasks which ran separately from the rest of the code previously run as one long task. The flame chart created after this code change reflects this:
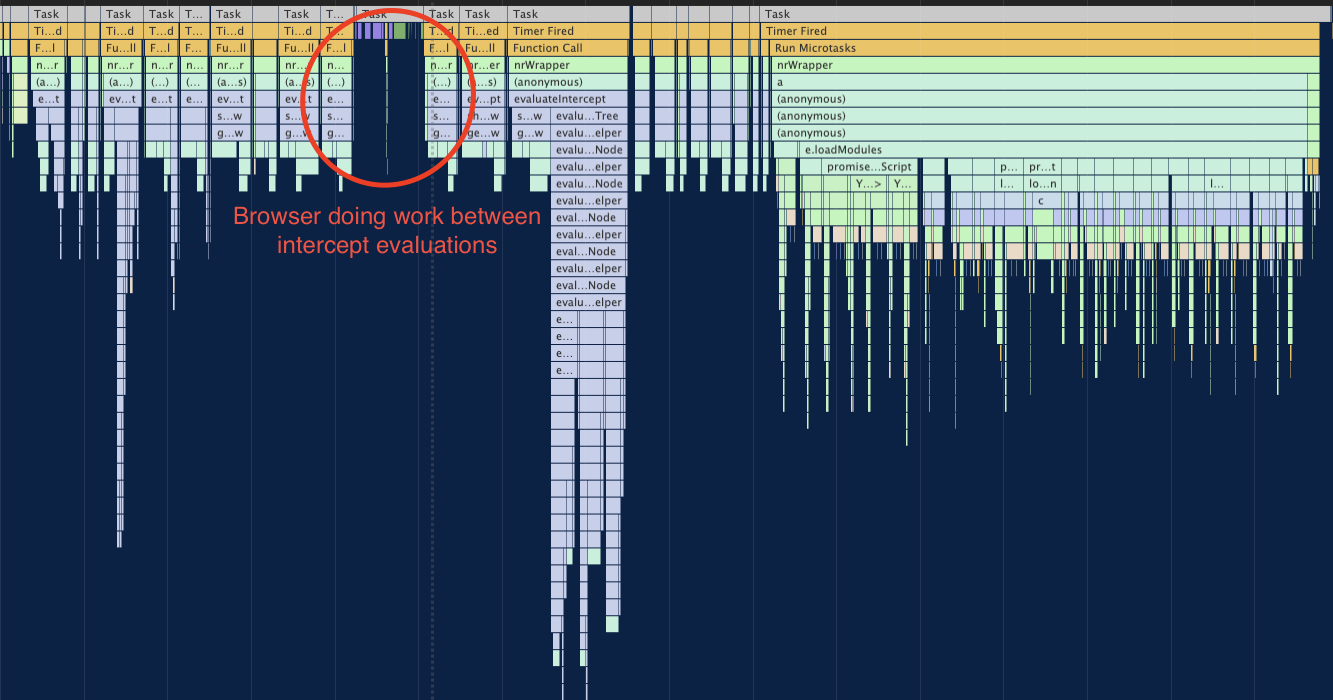
One of the flame charts I captured after this change clearly shows the browser doing work (responding to clicks, repainting elements, etc) between one of our intercept evaluation tasks. Now none of the JS tasks emanating from Qualtrics exceed the 50ms threshold (no red hashes in the chart), and any negative contribution to the Lighthouse TBT score was completely eliminated. Pretty powerful for a couple lines of code!
Additional Tips for Optimizing Lighthouse Performance Score
Since the changes I made above have been rolled out, there should be very little, if any, effect from Qualtrics Website Feedback on Lighthouse scores; however, there are some scenarios where the design and contents of an intercept could still negatively impact the score. The following are approaches that can be used to improve performance scores in those scenarios.
Improve LCP Score by removing large images / text
As mentioned in the LCP section above, if you are using Info Bar or Custom HTML intercepts that contain large images or blocks of text that appear at the top or near the top of the page, the intercept may be negatively impacting the LCP score. This in turn reduces the overall performance score due to the 25% weighting of LCP. To mitigate this, either remove the large images or choose a different solution for this top section of the page.
Reduce the number of active intercepts on the page
Intercept targeting logic is evaluated client‐side, so each active intercept on a page adds additional script evaluation that Website Feedback must complete in order to display intercepts. In most situations this has no effect on the performance score because the evaluations are ‘batched’ into small tasks; however, in some cases with a large amount of complex targeting logic, these batched evaluations could still negatively impact TBT and Speed Index. To mitigate this, remove unnecessary intercepts from the page zone to reduce the number of targeting evaluations on the page.
Conclusion
Thanks for joining me on this journey through the guts of Lighthouse and the JavaScript runtime! Lighthouse and Chrome Performance profiles tools can be used together as a powerful tool to understand how your code is impacting the page it’s running on. I highly recommend looking over the full documentation for Lighthouse as well as the Chrome performance tools so you can fully take advantage of them in your own projects.