Pricing doesn’t just dictate the dollar amount at which you will agree to part with your product. Price is communication. Price is signal. For example, a high-end fashion designer would never agree to sell their perfume for the same price as a dollar-store aftershave, not just because their profit margin would suffer, but also because that price would signal a cheapening of their entire brand and make it less likely shoppers would be willing to spend as much on their other products.
About Pricing Surveys
Pricing surveys and value research are always of great interest to managers faced with determining the merits of increasing profit margins by raising prices, or the likelihood of increasing revenues by decreasing prices. You can run effective studies using a variety of research approaches, including conjoint analysis, Van Westendorp models and price rating scales.
See how Qualtrics can help you run a variety of pricing research projects.
Price Rating Scales
Rating scales are used to provide graded scales that indicate importance or acceptability of a given concept. Their application within online pricing surveys usually involves determining
1. The degree of importance that consumers attach to a given price level. This approach reports the overall importance of price and not the optimal price for a given product or brand. Price importance, along with measures of other attribute importance constructs, is useful in segmenting respondents into key market segment groups. Pricing questions or pricing scales can alternatively include such measures as
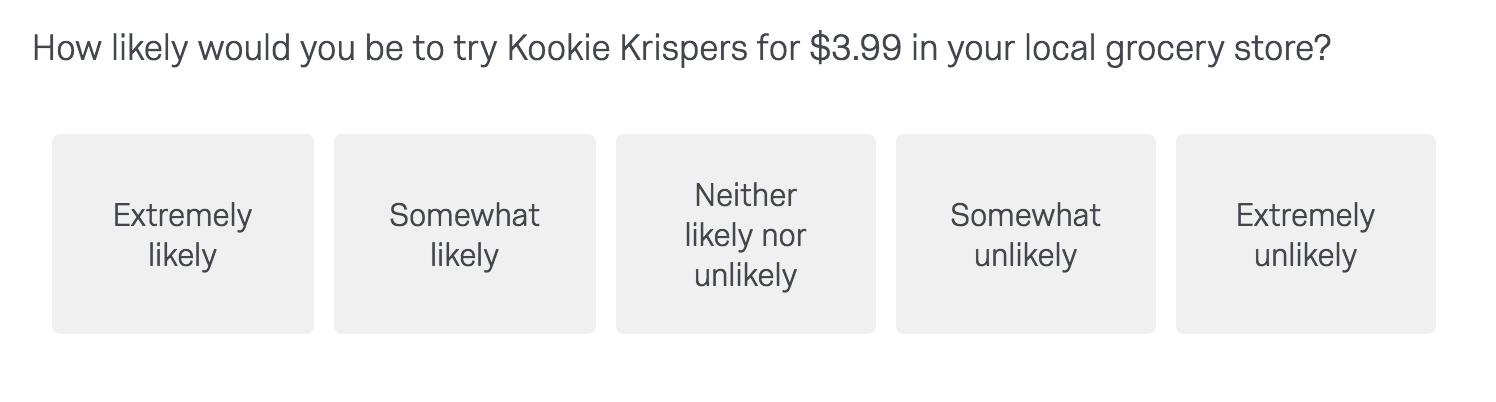
2. The likelihood of trial,
3. The likelihood of purchase at given price points, or
4. The overall acceptability of a series of price points can be measured. These pricing measures would be repeated for multiple price points, thereby allowing the researcher to pinpoint the optimal price for a given product. Multiple price points or pricing questions must be used.
Direct Pricing Measures
Direct measurement scales ask respondents to respond to “likelihood of purchase” questions when the price climbs by an extra $5, $10, $15, $20 and so forth. This method is similar to “dollar metric” approaches used in the 1960’s to test how many additional cents would it take to get you to switch from “Coke” to “7up”. Respondents were presented with all possible brand combinations and would indicate how much they were willing to pay for one brand over another.
Many different ways to include premium measures into the pricing scale exist and can be implemented for specific pricing studies.
Learn more about testing product concepts and features.
Van Westendorp Pricing Model
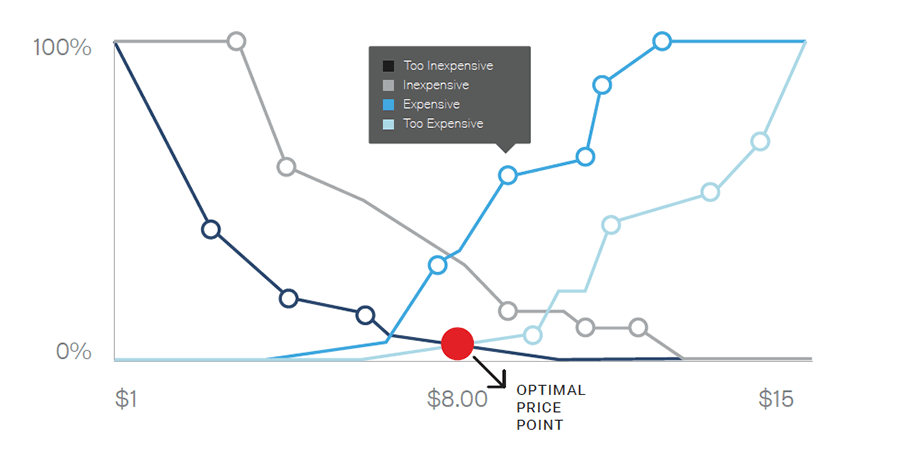
The Van Westendorp method uses a series of questions to identify key psychological price points given the respondents’ introduction to a product description. Respondents are asked to report:
1. The price at which the product is so cheap that the respondent would question its quality.
2. The price at which the product is inexpensive, but not so inexpensive that the respondent would question its quality.
3. The price at which the product is expensive, but not so expensive that the respondent would consider it.
4. The price at which the product is so expensive that the respondent would not consider it.
The price measurements in each of the respective categories provide a distribution of perceptions about the acceptable price of the product. The analysis of these distributions will help answer such questions as what is the average expected price; at what price would we expect purchase intention to drop sharply; and at what point is the price too inexpensive to imbue a quality image? Economists express these concepts in terms of price elasticity of demand.
The key to an effective Van Westendorp study is to create a price scale so that lower is not always better and so that users of a product are differentiated from non-users of the product. Furthermore, the price–value of the product must be measured so that an accurate view of price perceptions and propensity to buy are included.
Respondents often report a preference for an expensive product over a cheaper alternative, but this may not hold true in an actual purchase situation. Validation measures for pricing questionnaires are always essential.
Experimental Test Markets
Online pricing experiments provide an interesting approach to comparing price changes and their effects in “real world situations.” Different market segments may be chosen to receive different product, pricing, or purchase situation information. For example, prices may vary by distribution location (i.e., convenience store, grocery store, and megastore), and the likelihood of product purchase in each of these store types can be compared.
The use of graphics in the form of pictures of the store and product provide a window into the world that assures more realistic and accurate price elasticity estimates.
Econometric Models
Tracking the effects of pricing on market share over an extended period of time gives a unique view of price-demand relationships. Monthly or quarterly measures show changes that result from marketing programs, competitive action, or general market demand. These trend analysis studies estimate price-demand relationships and can show the interaction between price and brand sales if market measures of price changes are included. By way of contrast, the Van Westendorp method, conjoint analysis, and discrete choice conjoint analysis may be modeled to include the influence of broader price ranges on the brand and can be accomplished in much shorter time periods.
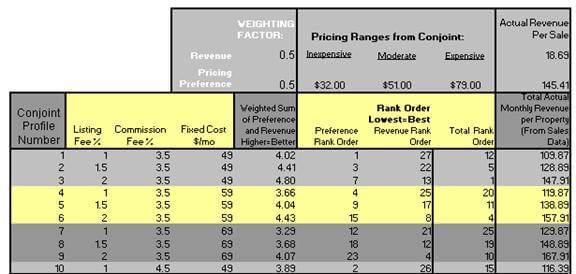
Full Profile Conjoint Analysis
Traditional “full profile” conjoint analysis uses ratings or rankings of distinct product profiles as the means to estimate pricing effects. For example, a conjoint analysis product profile might be composed of five attributes. Using express mail services as an example, each service is composed of a set of attributes like company name, delivery options, price and drop-off location options. For each attribute, there are levels that can be identified. For example, the company name might include FedEx, UPS, DHL, USPS. Price might include $3.95, $7.95, $11.95. Delivery options might include next morning, next day, two day, or five day.
The conjoint analysis profiles present different combinations representing express mail services. Respondents view these combinations and state their preference. The design of conjoint analysis combinations is non-trivial and must be done using experimental design methodology. The conjoint analysis processes a set of utility functions for each respondent measured, for segments within the sample, and for the total sample. Utility functions show the demand curve or relative importance of each attribute and each level of each attribute.
Conjoint analysis simulations are used to analyse the sensitivity of each of the attributes to changes in the marketplace. Conjoint simulations of the actual marketplace can be run to estimate the choice share (market share) that would be derived from changing the feature level combinations that make up the product. Conjoint simulations typically assume that consumer utilities are linear and additive and may not represent the real world.
Learn how our Conjoint Analysis Software makes it easy to run a study.
Self-Explicated Conjoint Analysis
The self-explicated conjoint model provides a simple alternative for producing utility score estimates equal to or superior to that of full-profile and other popular approaches such as Adaptive Conjoint Analysis. The self-explicated model is based theoretically on the multi-attribute attitude models that combine attribute importance with attribute desirability to estimate overall preference.
Initially, all attribute levels are presented to respondents for evaluation in order to eliminate any levels that would not be acceptable in a product under any conditions. Next, attribute levels are presented and each level is evaluated for desirability. Finally, based on these evaluations, the most desirable levels of all attributes are evaluated for relative importance. As with the full-profile model, these scores can be summed and simulations run to obtain a score for any profile of interest. This simple self-reporting approach is easier for the respondent to complete and straightforward in terms of determining the importance or desirability of attributes and attribute levels (See Srinivasan, V. (1997, May). Surprising robustness of the self-explicated approach to customer preference structure measurement. Journal of Marketing Research, 34, 286-291.)
Discrete-Choice Conjoint Models
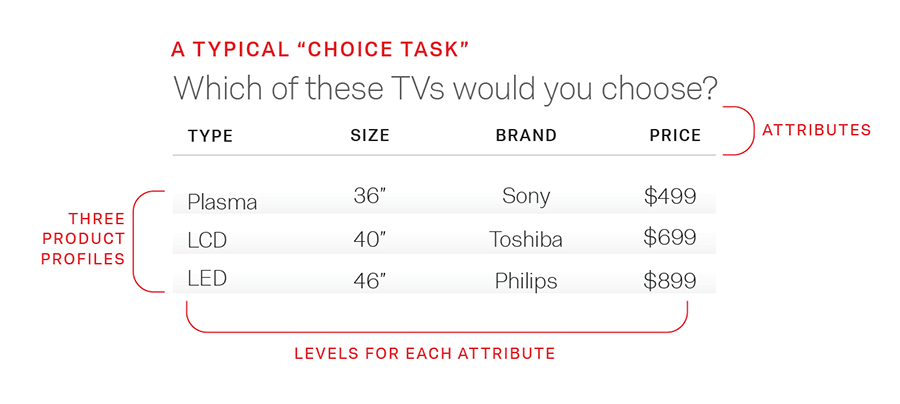
Discrete-choice modeling is used to determine the influence that both price and product features have on brand value. In discrete-choice conjoint studies, the respondents are shown different full profile sets. They then choose the one that they most prefer. This choice task is much easier and often more realistic than the rating or ranking tasks used in the other conjoint analysis models.
When customers shop for products such as clothing or a dishwasher, a brand is often associated with a set of attributes, such as its price, style, colour, fit, and type of material. Each individual respondent is faced with a choice of two to five product configurations, and then chooses one of the configurations. These choices reflect the value or utility he/she assigns to each attribute. These choices are later analysed to produce the utility functions that derive differences in the attribute values from the competing alternatives and/or differences in the characteristics.
Discrete-choice conjoint analysis using d-optimal designs offers some advantages over a ratings-based conjoint analysis. Discrete-choice conjoint presents optimal sets of choices within a group of products. The discrete-choice conjoint analysis provides estimates of the demand curves for all attributes and brands included in the study. Also incorporated is the ability to estimate feature level interactions, including the brand-price interaction. Like all conjoint analysis simulations, discrete-choice conjoint analysis simulations can be used to place product choices into a competitive market situation.
Are you ready to start your own pricing research? Request a personalised demo of pricing research tool.
Webinar - Sophisticated research made easy: Brand Awareness and Performance