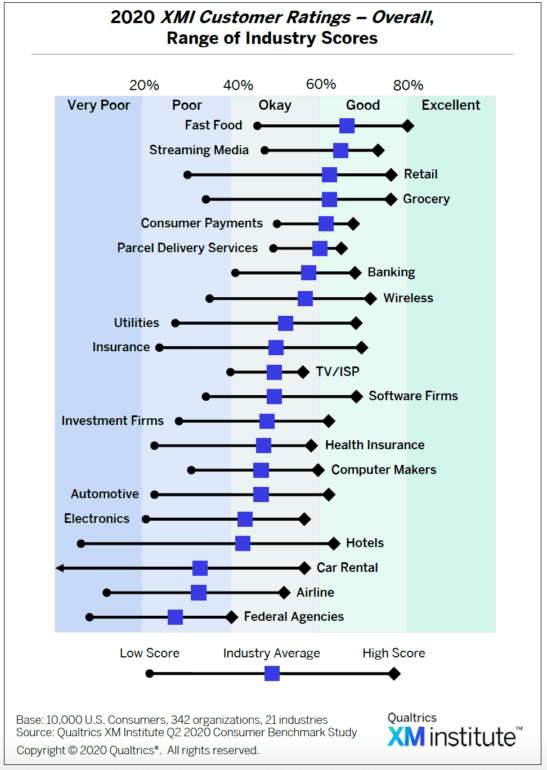
To help your business understand its CX performance and how it compares to companies in your industry, Qualtrics XM Institute released the second annual XMI Customer Ratings. The Ratings are a cross-industry, open-standard benchmark of customer experience measuring the performance of over 300 organizations across 21 industries.
The XMI Customer Ratings exist in two forms, Overall and Consumer NPS. The Overall Ratings are a composite metric of customer experience delivery measuring consumers’ feelings of success, effort, and emotion when interacting with companies, while the Consumer NPS Ratings measure the Net Promoter Score first championed by Bain et al. This is the second year the Ratings are being published by the XM Institute, continuing the publication of the Temkin Ratings.
Standout findings for XMI customer rating benchmarks
Both versions of the Ratings, Overall and Consumer NPS, are available to all Qualtrics CX customers. Contact your Customer Success Manager to access the full report, but, in the meantime, explore some of the key findings below.

Overall performance
The Overall Ratings range from a high of 80% in the Fast Food industry to a low of -1% in the Car Rental industry. Twenty-five percent of companies were rated as either “poor” or “very poor” for their CX delivery. In comparison, 39% of companies were in the “good” range, and only one was in the “excellent” range. You can download a more specific data snippet here.
Success ratings
The success component of the Ratings earned the best scores with an average of 55% across all industries. Car Rental companies were the worst performing in this area, with the lowest averages at 33%. In comparison, the Grocery industry performed the best in this area, earning the top score with 84% and one of the higher industry averages at 66%.
Effort ratings
Federal Agencies earned the lowest average effort ratings at 27% while the Fast Food industry performed best with an average score of 71%.
Emotion ratings
Industries earned the lowest scores in the emotion component, with a cross-industry average of 43%. Federal Agencies had the lowest average (24%), while Streaming Media performed the best (57%).
NPS performance
Most industries saw a decline in their NPS from 2019 to 2020, with an average drop of 18.4 points. The Fast Food industry earned the highest NPS at 51 while the Hotel industry earned the lowest at -40.
NPS by age
NPS increases steadily with age. Consumers in the 18 to 24 age range were the least likely to recommend companies, averaging a -22 NPS. On the other end of the spectrum, consumers that are at least 75-years-old were the most likely to recommend companies with an average NPS of 38. You can download a more specific data snippet here.
How the ratings are calculated
To generate the Ratings, Qualtrics XM Institute asked a representative sample of 10,000 U.S. consumers to rate their interactions with over 300 companies across 21 different industries. They then evaluated their responses across the three components of CX: success, effort, and emotion. The Overall scores were calculated for each company in the study in the following way:
- For each of the three separate components, we look at the percentage of consumers who gave the company a high score ("6" or "7") on our set of 7-point scales) and the percentage who gave the company a low score ("1," "2," or "3").
- Within each individual component, we subtract the percentage of low scores from the percentage of high scores. This results in three separate ratings. Each rating is an index score with a range of -100% to 100%.
- Finally, we average these three component scores (success, effort, and emotion) for each company to generate that firm's XMI Customer Rating - Overall Score.
In order to calculate the Consumer NPS Ratings, Qualtrics XMI followed the standard procedure established by Bain & Company, Satmetrix, and Fred Reichheld, who have a registered trademark for Net Promoter Score, Net Promoter, and NPS. The calculation for the Overall Ratings was done across 21 industries while the NPS calculation was only done for 20 industries because NPS data was not collected for Federal Agencies.
How to display benchmarks in your dashboard
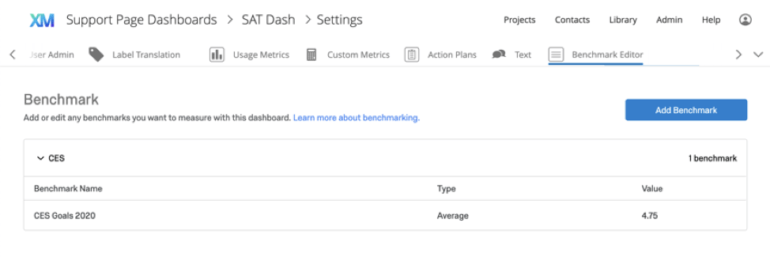
If you are new to benchmarks, you can use the Benchmark Editor to quickly upload the benchmark data you’d like to display in your dashboard. This could be your own benchmark data or XM Institute data. Simply go to the settings of your dashboard, select the benchmark editor, and click “add benchmark” then follow the workflow.

If your company doesn’t have your own NPS or Overall score to compare against the benchmarks, you can use this XM Solution which comes with pre-configured dashboards, questions from the survey and email templates to make it easy to capture and compare insights against other brands in your industry.
For those that already display the XMI Customer Ratings - Consumer NPS or XMI Customer Ratings - Overall, you can quickly update them with the new 2020 data by going to the benchmark editor, clicking on “View updates”, reviewing the changes, and then confirming them.
If you need support updating your 2019 benchmark data, you can view this support page or feel free to contact your Customer Success Manager. And lastly, keep an eye out for new visualizations that will be bringing to benchmarks in the coming quarters!
Learn more about the XM Institute NPS and Customer Ratings Benchmark Solution


