
Human Experiences
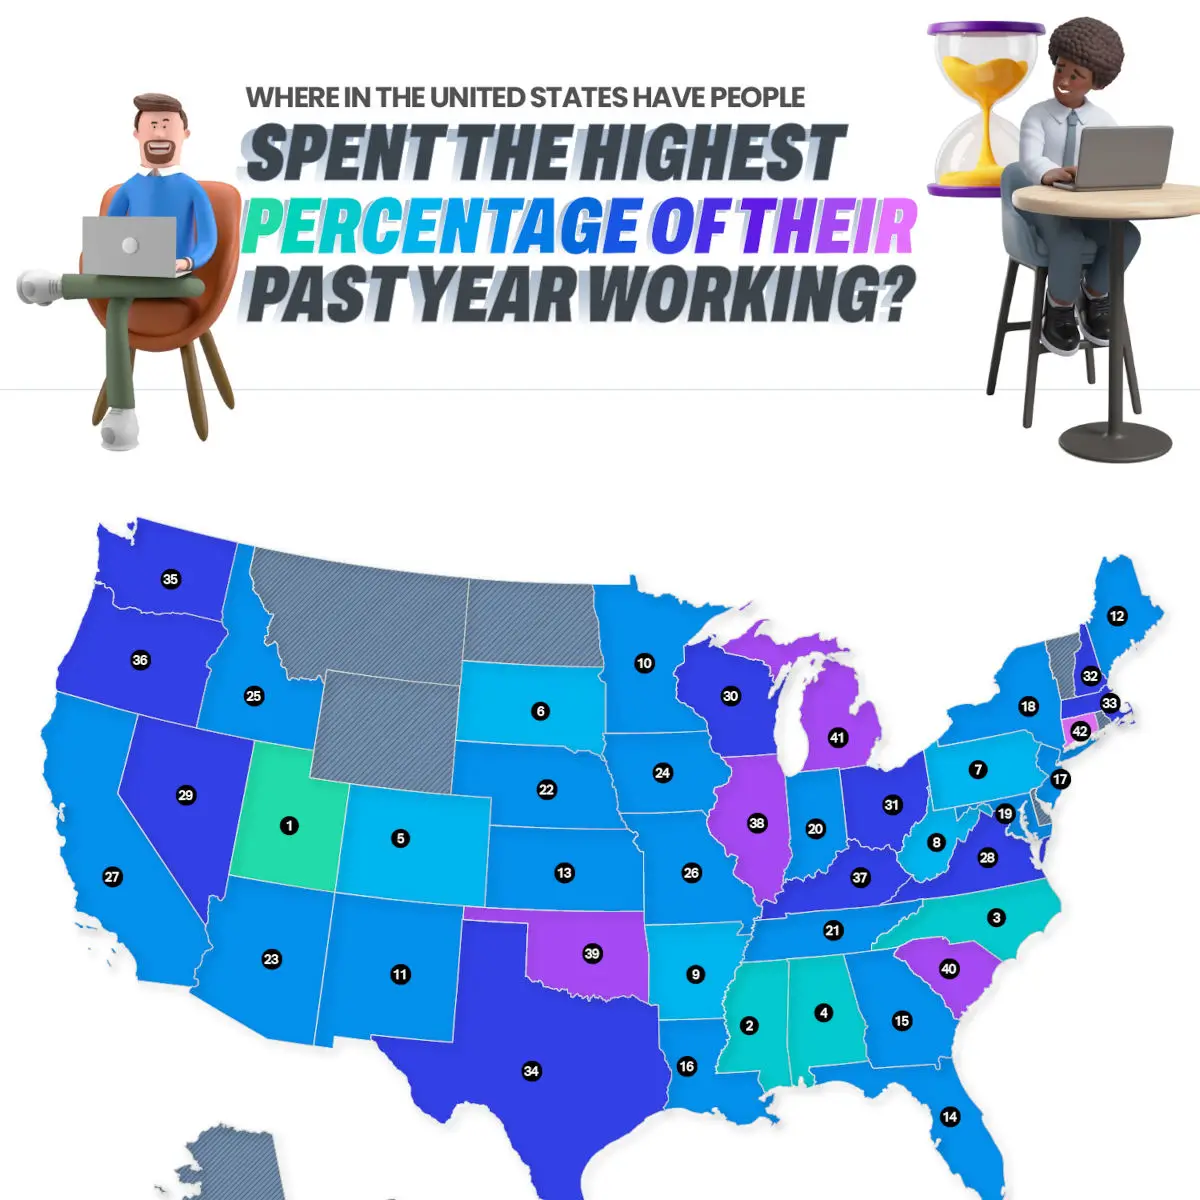
Where in the United States Have People Spent the Highest Percentage of Their Past Year Working?
Time is one of our most valuable resources, and how we spend it says a lot about our work culture, economy, and overall lifestyle. While working life is a daily reality for most Americans, the number of hours people spend on the job varies across the country. The reasons behind these differences are complex and influenced by a combination of economic, social, and industry-related factors.
Our work is often tied to our identities, shaping our routines, finances, and even personal well-being. With that in mind, it's valuable for workers, business owners, and policymakers alike to understand the trends impacting average working hours and work culture from coast to coast.
In today’s report from Qualtrics, we examine data on which states spend the most time at work and what factors contribute to these differences.
Why Do Some States Work More Than Others?
While it’s difficult to generalize trends across the entire population of a state, there are a few factors that likely contribute to differences in working hours in America:
1. Low Unemployment Rates
With a strong job market and high demand for labor, employees are more likely to work full-time schedules, overtime, or multiple jobs. Utah, for example, ranked number one with the highest number of hours in the work year and has a lower unemployment rate than the national average.
2. Lower Wages
In some states, lower wages push workers to work longer hours just to make ends meet. When salaries are too low to afford a comfortable standard of living, individuals often must compensate by working additional shifts or multiple jobs. Some of the states with the most work hours also happen to have the lowest wages in the U.S., such as Mississippi, Alabama, South Dakota, and West Virginia.
3. Industry Type Influences Work Schedules
Manufacturing-heavy states, including two of the hardest-working states, Alabama and Mississippi, typically have jobs that demand long shifts, sometimes exceeding the traditional 40-hour workweek. Factory and production jobs often require extended hours to meet production targets and demand, meaning employees, on average, will work longer hours.
4. High Cost of Living
In states like Colorado, where housing and general cost-of-living expenses are high, workers may need to work more to afford their lifestyles.
5. Prevalence of Part-Time Work
States with a higher percentage of part-time workers are likelier to report lower average work hours. Part-time employees naturally work fewer hours than full-time workers, resulting in a lower overall state average. In fact, 29% of the Connecticut workforce is part-time, partially accounting for its low ranking on the list.
Hours Worked vs. Productivity
People who work long hours undoubtedly exert a lot of effort, but research indicates that longer hours do not necessarily lead to higher productivity. While some industries necessitate overtime to meet production goals, studies suggest that excessive work hours can lead to diminishing returns in efficiency and performance. Countries with shorter average workweeks, such as Germany, Norway, and the Netherlands, have demonstrated high levels of productivity despite fewer hours worked.
Employers are increasingly recognizing the benefits of prioritizing efficiency over sheer time spent on the job. Companies experimenting with four-day workweeks or flexible schedules have reported boosts in employee morale, retention, and overall output. Small business owners and large corporations are beginning to assess how work schedules impact productivity and long-term success. States with longer work hours may struggle with work-life balance, while those with fewer hours may offer residents more time for leisure and family activities.
Additionally, work hours can lead to burnout, reduced productivity, and long-term health concerns. Likewise, having a better work-life balance can contribute to better mental health and physical well-being.
Trends in Work Hours
Over the past century, work hours in the U.S. have evolved significantly. In the early 1900s, workers regularly worked 60+ hours per week, particularly in industrial jobs. However, establishing labor laws and worker protections gradually led to the standard 40-hour workweek.
Modern advancements, such as digital communication and automation, have further transformed how we work. While these tools have increased efficiency, they have also contributed to a growing expectation of off-hour availability. As a result, many employees now find themselves checking emails and completing work outside of their scheduled shifts.
As the future of work continues to evolve, finding the right balance between productivity and personal time will remain a key focus for individuals and organizations alike. Therefore, businesses that focus on smart workload management, employee well-being, and operational efficiency are likely to see greater productivity and success.
Of course, managing a workforce effectively requires the right tools. With a comprehensive management software solution from Qualtrics, businesses can track employee data and create a better work-life balance for their teams. Take the first step toward a more efficient and engaged workforce today.
What States Worked the Most Over the Last Year?
Methodology:
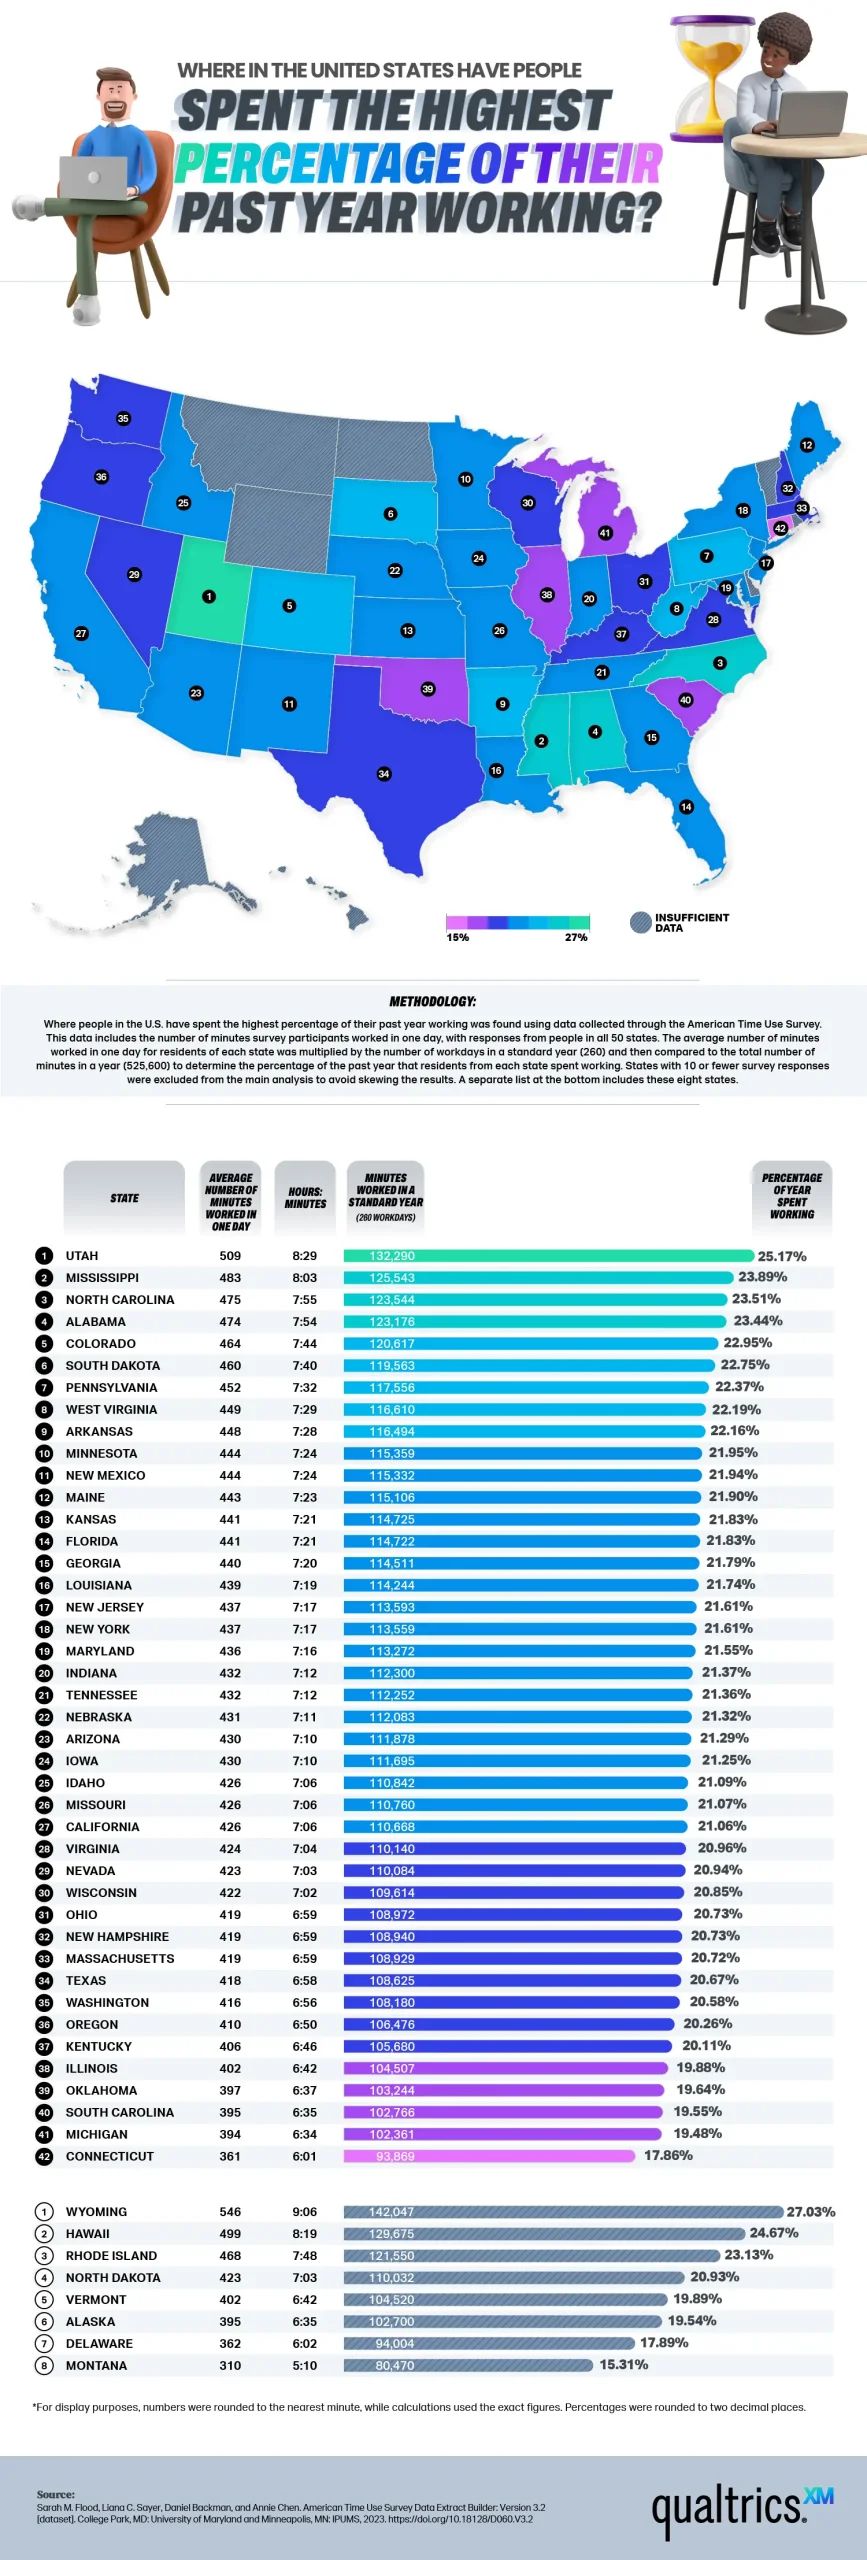
Where people in the U.S. have spent the highest percentage of their past year working was found using data collected through the American Time Use Survey. This data includes the number of minutes survey participants worked in one day, with responses from people in all 50 states. The average number of minutes worked in one day for residents of each state was multiplied by the number of workdays in a standard year (260) and then compared to the total number of minutes in a year (525,600) to determine the percentage of the past year that residents from each state spent working. States with 10 or fewer survey responses were excluded from the main analysis to avoid skewing the results. A separate list at the bottom includes these eight states.
Average Minutes Worked by State
| State | Average Minutes Worked in One Day | Hours: Minutes | Minutes Worked in a Standard Year (260 workdays) | Percentage of the Year Spent Working |
|---|---|---|---|---|
| Utah | 509 | 8:29 | 132,290 | 25.17% |
| Mississippi | 483 | 8:03 | 125,543 | 23.89% |
| North Carolina | 475 | 7:55 | 123,544 | 23.51% |
| Alabama | 474 | 7:54 | 123,176 | 23.44% |
| Colorado | 464 | 7:44 | 120,617 | 22.95% |
| South Dakota | 460 | 7:40 | 119,563 | 22.75% |
| Pennsylvania | 452 | 7:32 | 117,556 | 22.37% |
| West Virginia | 449 | 7:29 | 116,610 | 22.19% |
| Arkansas | 448 | 7:28 | 116,494 | 22.16% |
| Minnesota | 444 | 7:24 | 115,359 | 21.95% |
| New Mexico | 444 | 7:24 | 115,332 | 21.94% |
| Maine | 443 | 7:23 | 115,106 | 21.90% |
| Kansas | 441 | 7:21 | 114,725 | 21.83% |
| Florida | 441 | 7:21 | 114,722 | 21.83% |
| Georgia | 440 | 7:20 | 114,511 | 21.79% |
| Louisiana | 439 | 7:19 | 114,244 | 21.74% |
| New Jersey | 437 | 7:17 | 113,593 | 21.61% |
| New York | 437 | 7:17 | 113,559 | 21.61% |
| Maryland | 436 | 7:16 | 113,272 | 21.55% |
| Indiana | 432 | 7:12 | 112,300 | 21.37% |
| Tennessee | 432 | 7:12 | 112,252 | 21.36% |
| Nebraska | 431 | 7:11 | 112,083 | 21.32% |
| Arizona | 430 | 7:10 | 111,878 | 21.29% |
| Iowa | 430 | 7:10 | 111,695 | 21.25% |
| Idaho | 426 | 7:06 | 110,842 | 21.09% |
| Missouri | 426 | 7:06 | 110,760 | 21.07% |
| California | 426 | 7:06 | 110,668 | 21.06% |
| Virginia | 424 | 7:04 | 110,140 | 20.96% |
| Nevada | 423 | 7:03 | 110,084 | 20.94% |
| Wisconsin | 422 | 7:02 | 109,614 | 20.85% |
| Ohio | 419 | 6:59 | 108,972 | 20.73% |
| New Hampshire | 419 | 6:59 | 108,940 | 20.73% |
| Massachusetts | 419 | 6:59 | 108,929 | 20.72% |
| Texas | 418 | 6:58 | 108,625 | 20.67% |
| Washington | 416 | 6:56 | 108,180 | 20.58% |
| Oregon | 410 | 6:50 | 106,476 | 20.26% |
| Kentucky | 406 | 6:46 | 105,680 | 20.11% |
| Illinois | 402 | 6:42 | 104,507 | 19.88% |
| Oklahoma | 397 | 6:37 | 103,244 | 19.64% |
| South Carolina | 395 | 6:35 | 102,766 | 19.55% |
| Michigan | 394 | 6:34 | 102,361 | 19.48% |
| Connecticut | 361 | 6:01 | 93,869 | 17.86% |
States with 10 or Fewer Survey Responses:
| State | Average Minutes Worked in One Day | Hours: Minutes | Minutes Worked in a Standard Year (260 workdays) | Percentage of the Year Spent Working |
|---|---|---|---|---|
| Wyoming | 546 | 9:06 | 142,047 | 27.03% |
| Hawaii | 499 | 8:19 | 129,675 | 24.67% |
| Rhode Island | 468 | 7:48 | 121,550 | 23.13% |
| North Dakota | 423 | 7:03 | 110,032 | 20.93% |
| Vermont | 402 | 6:42 | 104,520 | 19.89% |
| Alaska | 395 | 6:35 | 102,700 | 19.54% |
| Delaware | 362 | 6:02 | 94,004 | 17.89% |
| Montana | 310 | 5:10 | 80,470 | 15.31% |
Numbers were rounded to the nearest minute for display purposes, while calculations used the exact figures. Percentages were rounded to two decimal places.
Source: Sarah M. Flood, Liana C. Sayer, Daniel Backman, and Annie Chen. American Time Use Survey Data Extract Builder: Version 3.2 [dataset]. University of Maryland, 2023. https://doi.org/10.18128/D060.V3.2