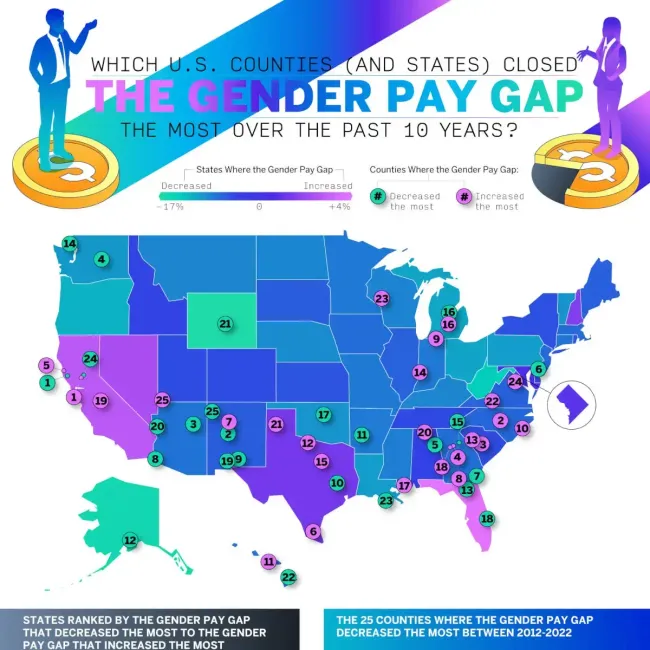
In the past decade, states and counties have successfully implemented measures to promote income equality and decrease the gender pay gap. Our team at Qualtrics has compiled data to show which states and counties decreased or increased the wage gap during a 10-year period from 2012 to 2022.

Copy and paste the code below to use the infographic on your own website or blog <a href="https://www.qualtrics.com/articles/employee-experience/gender-pay-gap-closing/"> <img src="https://www.qualtrics.com/sites/default/files/styles/standard_2xl/public/migrations/content/counties-states-closed-gender-pay-gap-6.png.webp" alt="The 50 Companies With the Best Customer Service – Qualtrics Customer Experiences - Infographic" title="Which U.S. Counties (and States) Closed the Gender Pay Gap the Most Over the Past 10 Years? - Qualtrics Employee Experience - Infographic"></a><br><a href="https://www.Qualtrics.com" alt="Which U.S. Counties (and States) Closed the Gender Pay Gap the Most Over the Past 10 Years? - Qualtrics Employee Experience - Infographic" title="Qualtrics.com">By Qualtrics.com</a>
What is the Gender Pay Gap?
The gender pay gap refers to the persistent inequality in the earnings of women compared to the earnings of men. According to the Pew Research Center, women made 80 cents to the dollar earned by men in 2002. In 2022, Pew Research Center reported that women made 82 cents to the dollar earned by men. In the span of two decades, this gap only decreased by 2 cents on average. This slow growth is in stark contrast to the decades before. The gender pay gap saw a significant decrease in the 80s and 90s, though this was mostly due to the stagnated wages of men while women raised their education levels.
When women first begin their careers, the gap is less prevalent with their male peers. This distance becomes more prominent as women and men age. In fact, a higher-paying industry equals a greater difference in earnings. Not even education can close it, as the gap remains similar between college-educated women and college-educated men, and women must attain the next level of education to be paid the same. After accounting for similar education, experience, occupation, and working full-time and year-round, a gap of about 10 percent can still be seen.
A Brief History of the Gender Wage Gap
Gender pay inequality was not as prevalent during pre-industrial America, as women did not participate as often in the workforce outside the home. With industrialization, and later World War II, there was a transition from women working within the house to women working in more formal labor roles that had traditionally been performed by men. Despite this, the potential earnings from the roles still did not match their male counterparts.
The Equal Pay Act of 1963 prohibited wage discrimination in the workplace on the basis of sex. Since then, women have still been paid less on average. This gap between men and women was even more severe for Black and Hispanic women and remains so today.
Causes of the Gender Pay Gap
Many factors have to be considered in the gender pay gap, including but not limited to age, education, location, race and ethnicity. The vast majority of the wage gap cannot be explained by any measurable differences between workers, but the next biggest cause is the type of jobs women are more likely to hold. Women typically make up the majority of workers in lower-paying fields in comparison to their total percentage of the workforce. These jobs often include caregiving, media, arts, elementary education, and childcare. In these lower-paying fields, the male employees still earn more than women on average.
Parenthood is more likely to affect the careers of mothers negatively than fathers. For men, fatherhood is actually known to increase pay. For women, motherhood does the opposite. Men are more likely to increase their work hours and receive bonuses when they become a parent. Women, who are more likely to perform the majority of household duties in dual income households, require more time off to care for their children. Whether it is out of choice or necessity, the brunt of childcare falls on the shoulders of women.
Outright bias can also not be excluded as one of the causes of the pay gap. Women may face differential treatment in the workplace and be subject to gender stereotypes and discrimination on the basis of gender.
Addressing the Gender Wage Gap in 2024
Though the gender wage disparity continues, many states have taken measures to lessen or eliminate its impact so women may be more equally represented in the economy:
- Raising the minimum wage. Since women are more likely to work in lower-paying fields, a higher minimum wage would greatly benefit the jobs typically worked by women. There are currently 30 states with a higher minimum wage than the federal minimum wage of $7.25.
- Paid parental leave. The United States is the only developed country in the world without mandatory paid parental leave. Some states have taken it upon themselves to pass legislation for mandatory paid family and medical leave.
- Affordable and accessible childcare. Currently, there is a dilemma in 2-parent households. Even if both parents want to work full-time, the high cost of childcare may make it unreasonable or impossible to do so.
- Improving employee experience in the workplace. When employees feel supported, they are more likely to be engaged in their job, which leads to higher work satisfaction, improved productivity, and better overall well-being. This support can be in the form of flexible or remote working options and encouragement of work-life balance.


