 XM Knowledge Base
Survey Reports and Dashboards
Turn data into insights with intuitive survey reports and dashboards
Over 16K brands and 99 of the top 100
business schools use Qualtrics
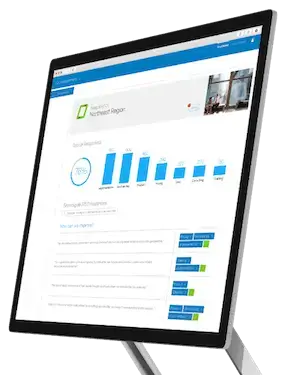
Create, share, and collaborate on survey reports that automatically update in real-time, so everyone in your organization has the latest insights at their fingertips.
- View your data in real time as responses come in
- See all your data visualized with over 30 different chart types
- Automatically share reports with the right people across your organization
- Export to Word, PowerPoint or PDF in one click
Your survey data. Automatically analyzed.
Make light work of open text feedback
Text Analysis removes the painful work of analyzing open text feedback. With natural language processing and sentiment analysis, every comment is automatically analyzed to show trending topics and sentiments so you can get to your insights faster.
Advanced stats analytics - no Ph.D required
Click. Understand. Predict. Statistical Analysis, Powered by iQ enables everyone, from beginners to expert analysts, to uncover trends and predict results without spending days in SPSS or Excel. All it takes is an internet connection and a mouse.
Stay a step ahead with predictive analytics
Make accurate predictions with advanced predictive modeling through Predictive Analysis. Using deep learning neural networks, it automatically surfaces predictions based on past behavior and survey responses so you know what your customers will do next.
Start uncovering insights today
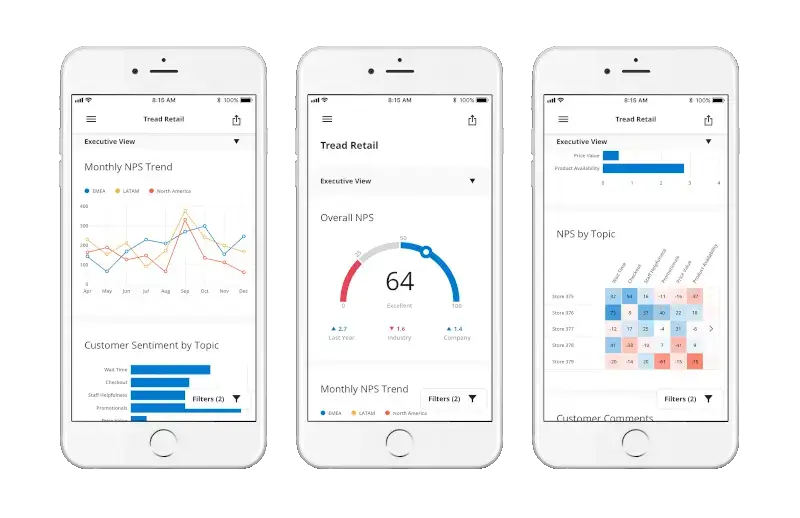
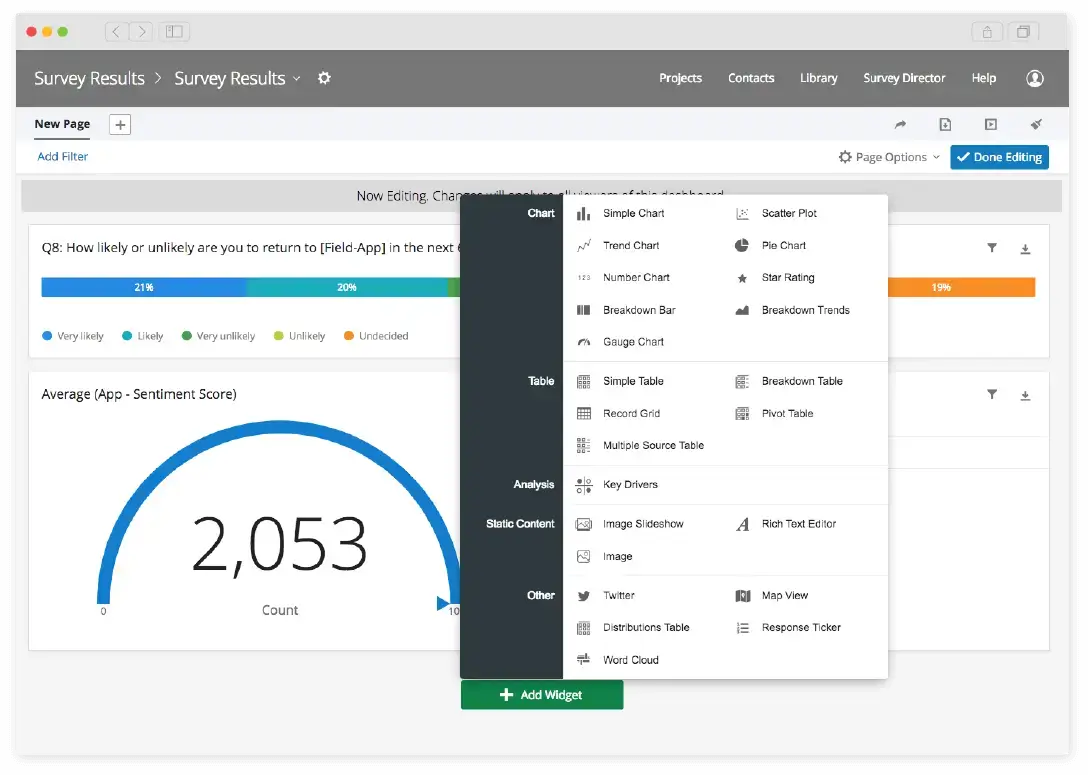
Detailed data. Instantly understandable.
Make sense of survey results at a glance with customizable widgets, charts and graphs.
- 9 chart and graph types
- 5 different tables type widgets
- Embed static content like slideshow, rich text or static images
- Utilize advanced widgets like Twitter feeds, geographic maps and word clouds

All of your data in one place
Analyze your most important survey results together, with one view and one report. Select multiple projects and all your data will come together so you can make connections between different data sets and projects as well as map trends over time.
- Connect with outside data sources
- Multiple research projects reported in one dashboard
- Make connections between different parts of your business like customer and employee feedback
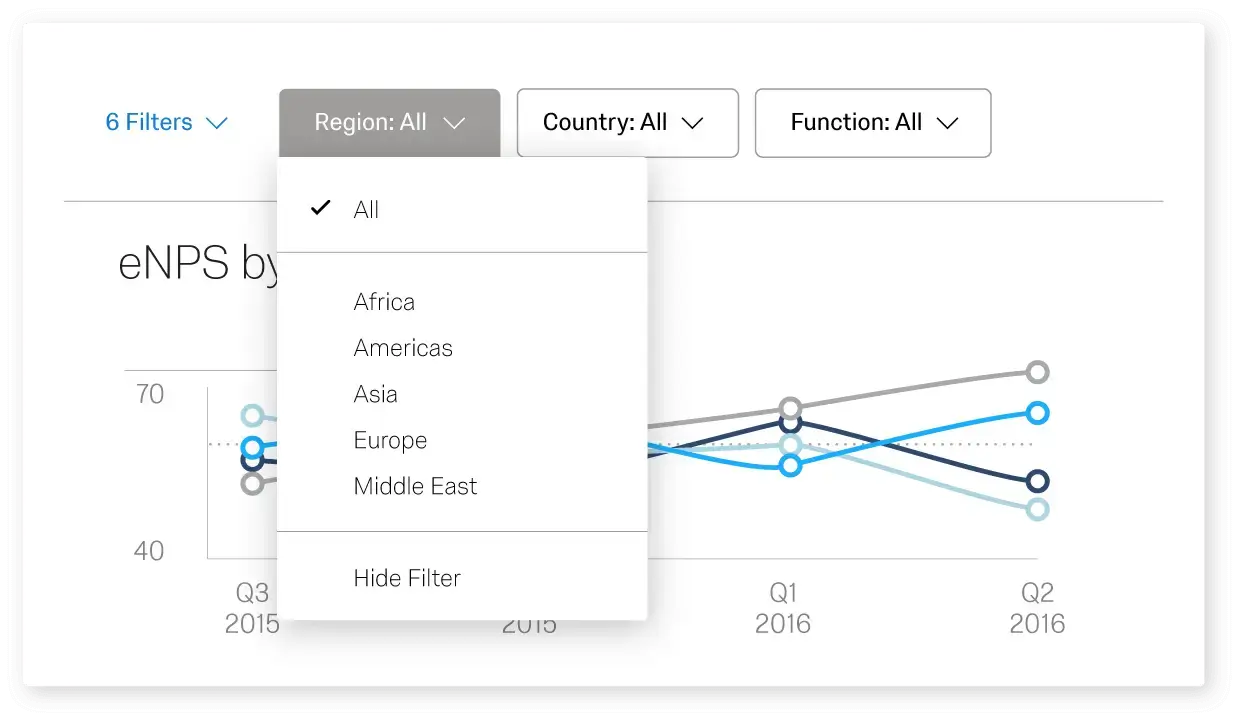
Share results. In real time.
No need to wait for your results to come in – just configure your dashboard in a few clicks and your charts will auto-update in real time as new survey results come in. Share them with colleagues across your organization in one click and give them instant access to the latest data.
A market leader and top rated survey software
The crowd has spoken. Qualtrics is proud to be the XM pioneer and survey software category leader in the top right quadrant on the #1 independent software review site.
Read unbiased reviews from real customers and compare for yourself.
