
Journeys Page
What's on this page
Attention: If you’re performing customer experience research, there’s a new and improved feature that we recommend for you instead of the one covered on this page. Journeys in Customer Experience programs organize all of your projects in one place, and they come with a guided flow to make setup easier. Learn more about setting up journeys in a CX program.
About Journeys
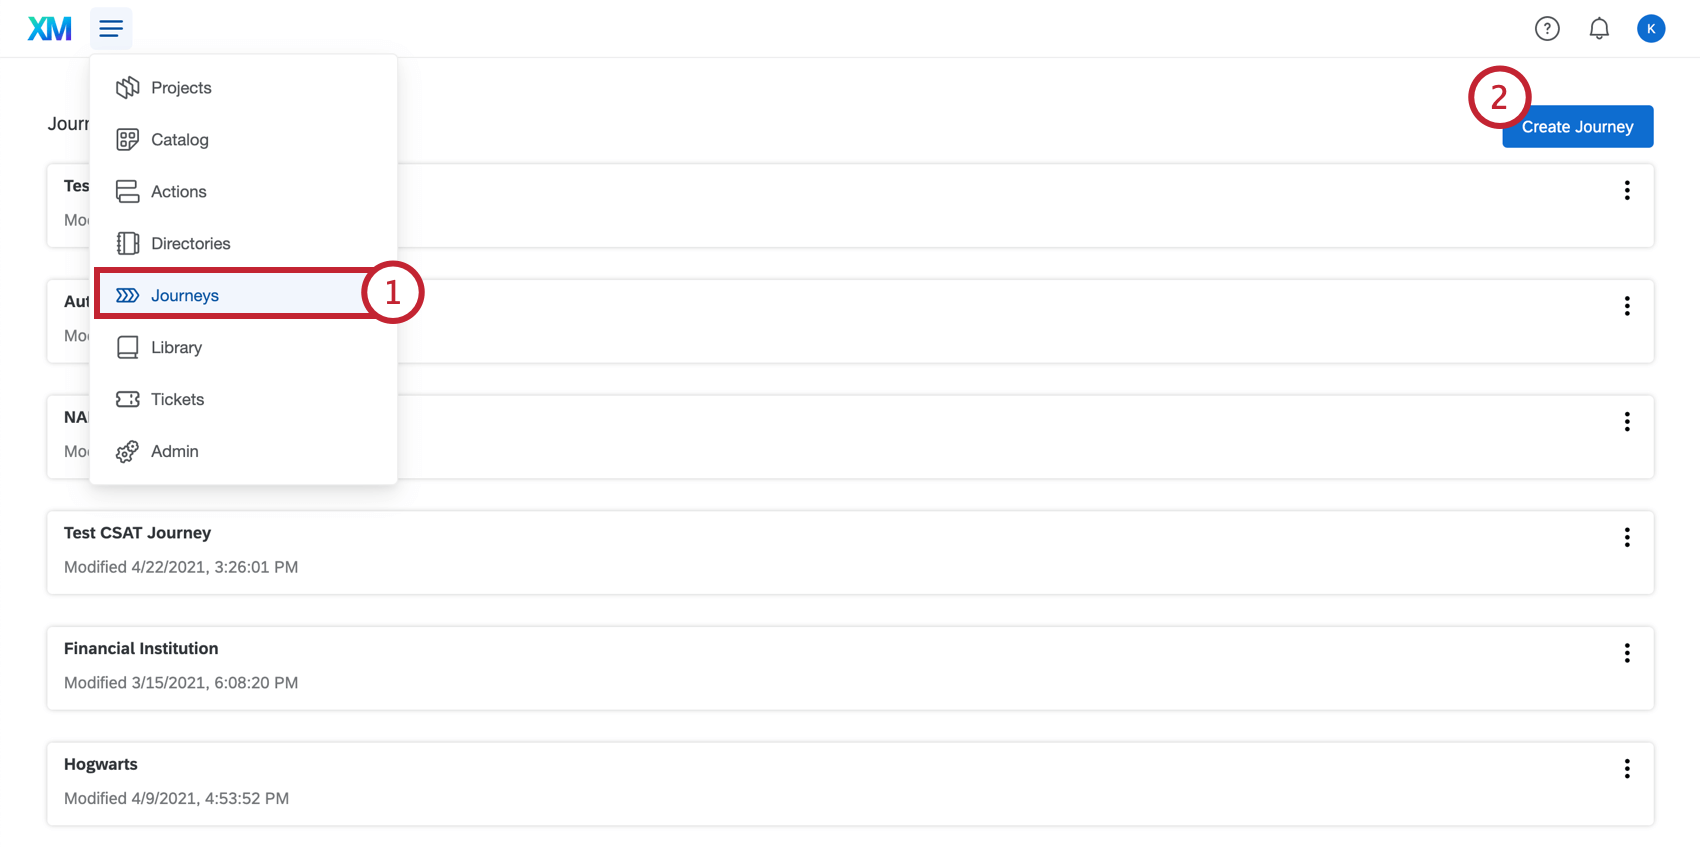
By visualizing the milestones in our customers’ journey, we can learn a lot about how individual touchpoints affect our customers’ ease of doing business with our company, and thus identify areas of strength and improvement. The Journeys page is one of the places you can define the journeys you want to analyze, by creating stages (or milestones). For each milestone, you can also assign a metric to measure its efficacy.
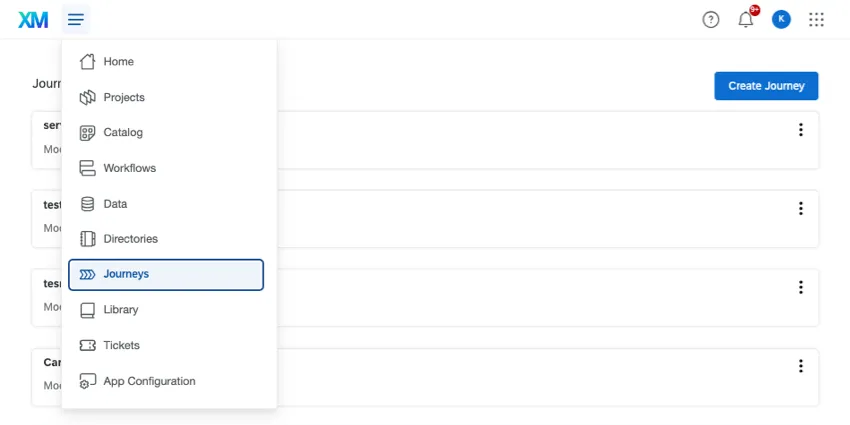
The Journeys page is most useful for when you want to use the journey chart widget in Employee Experience projects, such as Engagement, Lifecycle, Ad Hoc Employee Research, and Pulse. For comprehensive steps, see Employee Experience Journeys.
For Customer Experience research, we highly recommend using Customer Experience programs instead. However, if you’ve already collected journey data in separate survey projects, you can use the Journeys page to build your journey.
Enabling Journeys
Qtip: This feature is only available on certain licenses. If you’d like to gain access to this feature, please reach out to Account Services.
The Manage Journeys permission must be enabled for your user account by your Brand Administrator in order to use this feature.
The Use Journeys brand-wide permission must also be enabled for your organization. If “Manage Journeys” is enabled for your account but you still cannot use the Journeys feature, contact Account Services to have the “Use Journeys” brand-wide permission enabled.
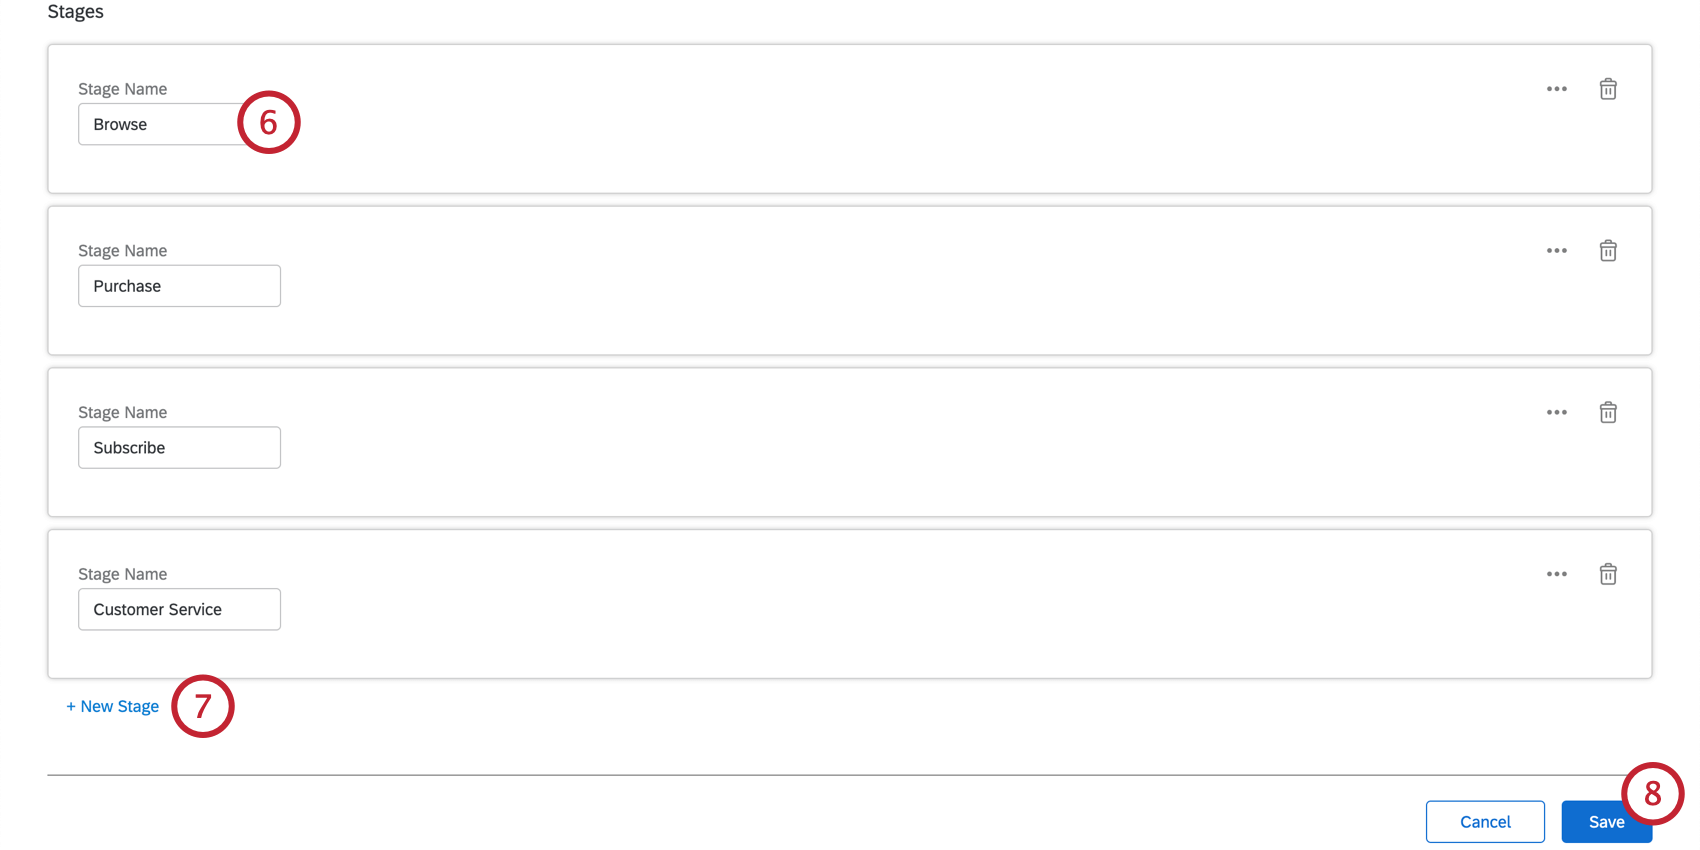
Defining Your Journey Stages
The stages of the journey are the moments that have the greatest impact on the customer’s overall experience. Stages allow you to identify customer feedback at a specific point in time. These could be a single interaction, groups of transactions, channels, or logical groupings of different decisions during the customer journey.
For example, your customers may feel differently about their experience buying your product versus returning the product. By setting up your journey to capture feedback from those buying and returning interactions, you can figure out exactly where in the customer journey your company is excelling, and where you can funnel additional resources.
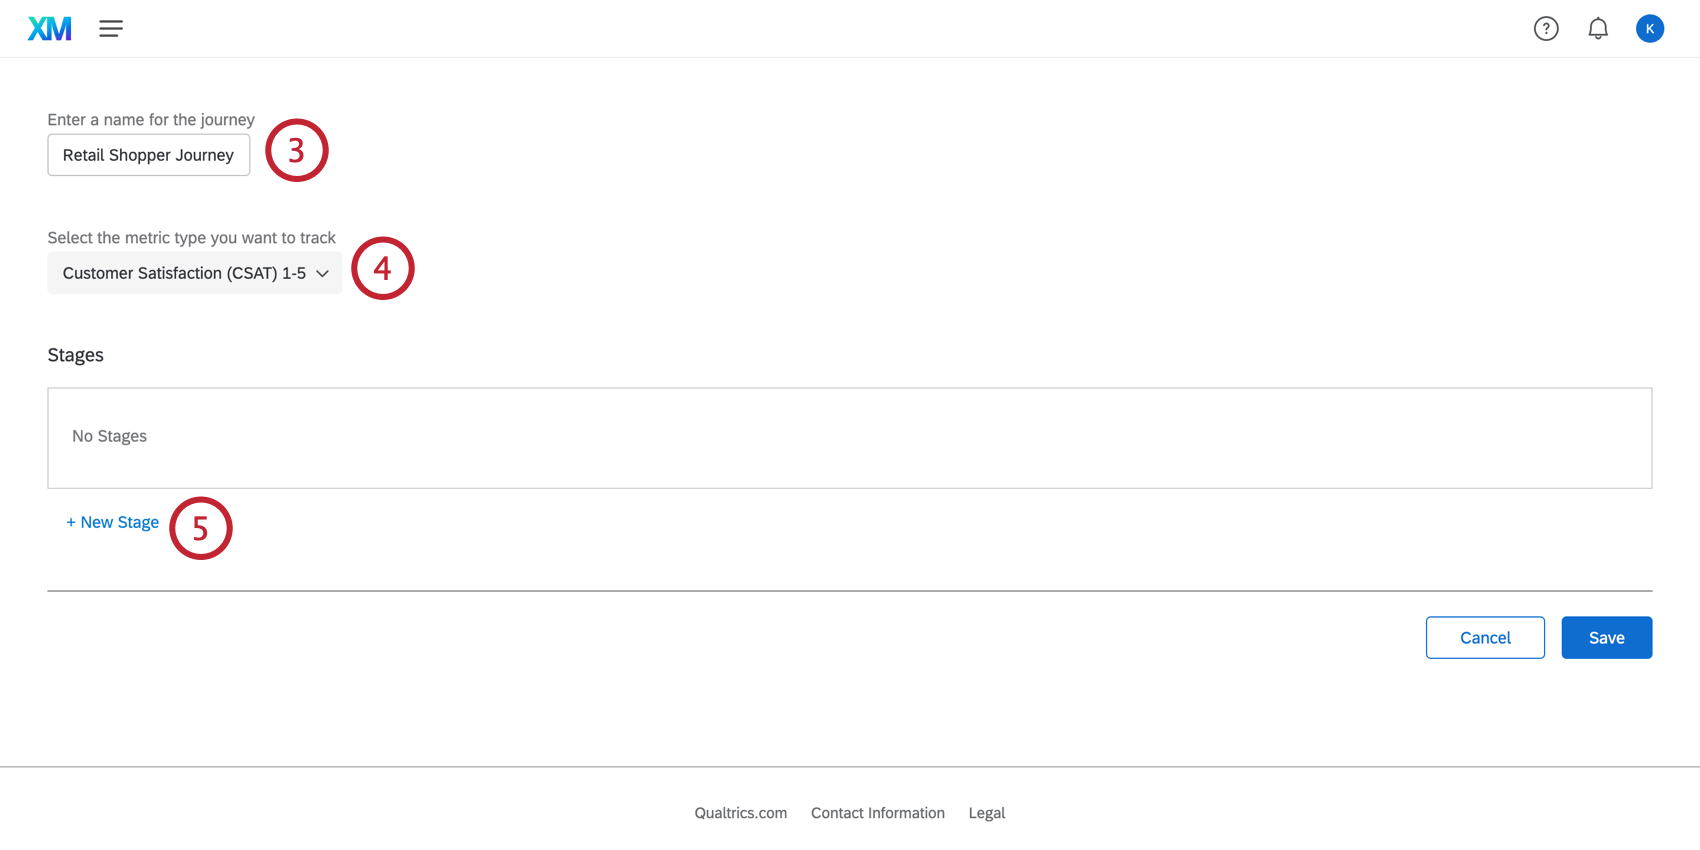
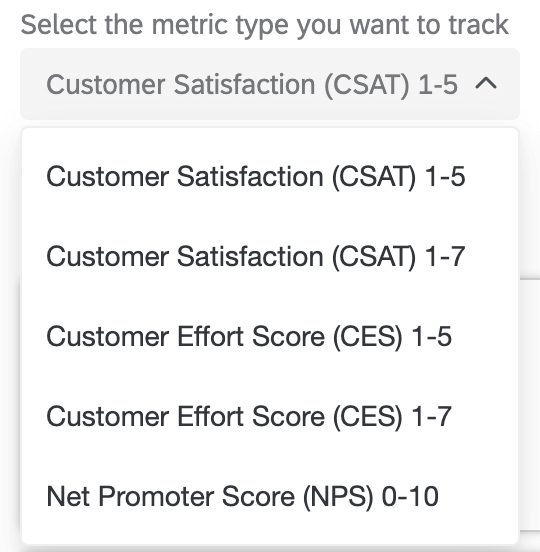
Metric types available in journeys:
- Customer Satisfaction (CSAT) 1-5
- Customer Satisfaction (CSAT) 1-7
- Customer Effort Score (CES) 1-5
- Customer Effort Score (CES) 1-7
- Net Promoter Score (NPS) 0-10
Example: If at every point in the journey you plan to ask your respondents, “How satisfied were you with [this particular experience] on a scale of 1-5?” you would select Customer Satisfaction (CSAT) 1-5 as your metric type.
Attention: All the experience data you’re using should be gathered using a consistent scale and metric.
Attention: If you’re creating a journey with employee feedback, skip this step and do not select a metric.
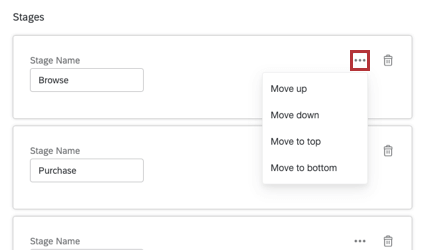
Qtip: You can change the order of the stages by clicking the three dots in the top-right corner. Here, you’ll have the option to move your stages up, down, to the top of the list, or to the bottom of the list.
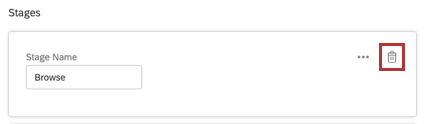
Qtip: To delete a stage, click the trash can button in the top-right corner of your stage.
Attention: Make sure that journey stages are listed in the desired order. The first stage of the journey should be listed at the top, and the last stage should be listed at the very bottom.
Next Steps
Qtip: If you use employee experience features, see this page for next steps instead.
Once you’ve defined your journey stages, it’s time to prepare your data for your stakeholders.
That's great! Thank you for your feedback!
Thank you for your feedback!