
Response Quality
What's on this page
About Response Quality
ExpertReview response quality is a feature in the Qualtrics platform that checks the overall quality of the data you collected before you begin to analyze it. It will make suggestions as to how best clean your data to ensure that you are analyzing the highest quality data possible. Below are possible error messages that you may receive when analyzing responses, and ways that you can resolve each one.
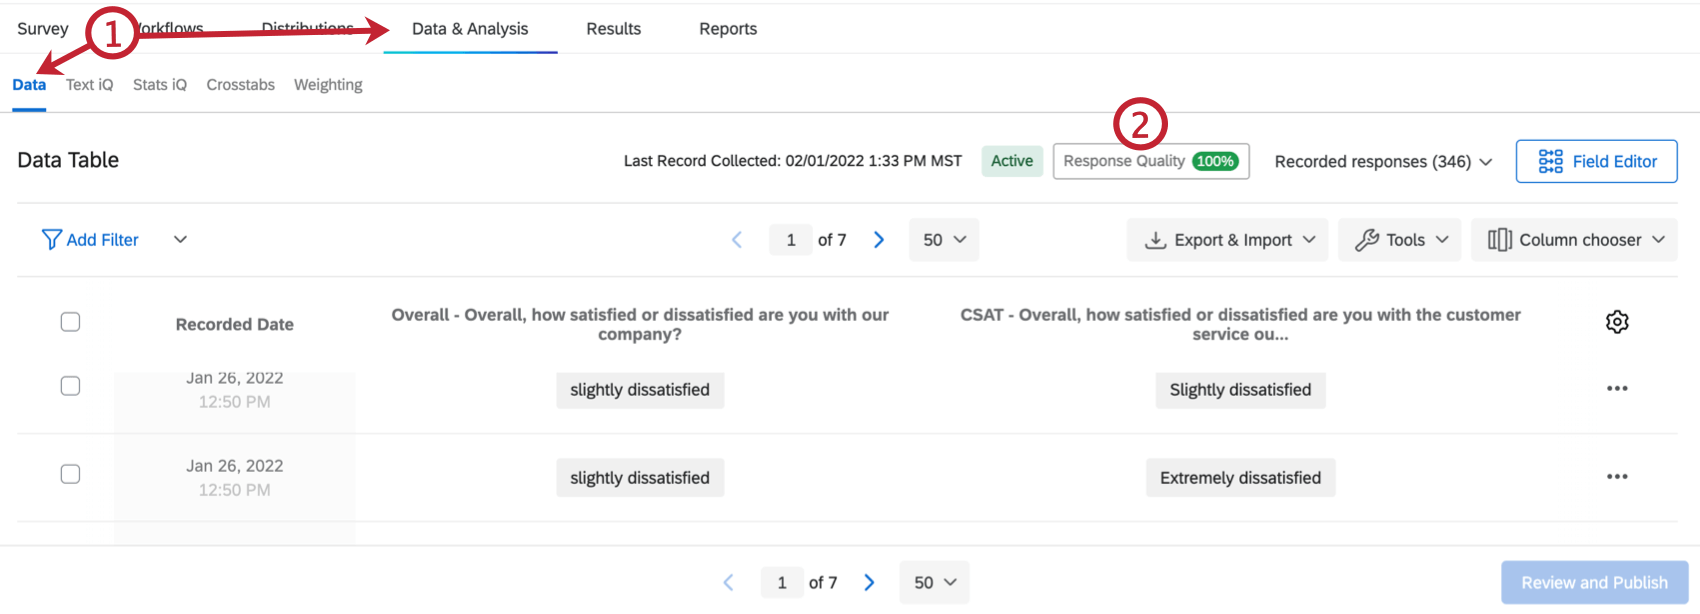
For instructions on how to use ExpertReview in Data & Analysis, see Response Quality Functionality.
Qtip: Imported responses are analyzed in surveys where response quality has been enabled. The only exceptions are when determining speeders, completion rates, sensitive data, bot detection, and duplicate detection.
Respondent Finished Survey Abnormally Fast
Respondents who complete your survey too quickly will be flagged as speeders. This implies they chose answers at random to get through the survey quickly, instead of providing you with quality answers.
Responses are flagged when they are more than two standard deviations from the median duration it takes for your respondents to take the survey, and you have to have collected at least 100 responses in your survey. Screened-out, preview, and test responses are not counted towards the 100 responses.
Attention: Because speeding is judged relative to how long other respondents took to complete the survey, who is considered a speeder may change as you collect more responses. To ensure the highest quality data, we advise you do not filter or delete speeders until after you are completely finished with your data collection.
Possible Bot
Qtip: Responses can only be flagged as bots if you have selected Bot Detection in your survey options.
Using Google’s invisible reCaptcha technology, we can detect the likelihood that a response came from a bot rather than a human subject. When bot detection is enabled, a score is assigned to each respondent in the embedded data field Q_RecaptchaScore, indicating the likelihood the response came from a bot. If this score is less than 0.5, the response will be flagged as a bot.
Qtip: Imported responses are not compatible with bot detection and will not be checked for possible bots.
Qtip: Although the Captcha question and bot detection both use Google reCAPTCHA technology, how they use it is very different. The Captcha question requires the respondent to successfully interact with it and complete the proposed challenge in order to proceed. On the other hand, bot detection uses reCAPTCHA V3 to flag the response with the likelihood of it being taken by a bot. This requires no interaction from the respondent, but will not block them from proceeding if they are indeed a bot. (Although a user can add a survey flow branch to kick the respondent out of the survey based on the likelihood of them being a bot.)
Preventing Bots
There are several ways to decrease the likelihood of a bot making its way through your survey.
- Use the Q_RecaptchaScore in branch logic to send bots to the end of the survey or screen them out altogether.
- Use a Captcha Verification question at the beginning of your survey.
- If you are distributing to a panel, use an authenticator or a password to restrict who can enter the survey.
- Try adjusting your survey security options.
Respondent Has Taken the Survey More Than Once
Qtip: Responses that might be duplicates can only be flagged if you have at least one of the following selected in your survey options:
Sometimes users may try to take your survey more than once. Depending on the goal of your study, duplicates can lower the quality of your data by biasing the results towards the repeat offenders’ feedback.
Depending on which survey option you have enabled, there are 2 different ways a response can end up flagged as a duplicate:
- Duplicate detection is set to “Flag responses:” The Q_DuplicateRespondent field is equal to “true.”
- Prevent multiple submissions is set to “Flag responses:” The Q_BallotBoxStuffing field is equal to “true.”
Preventing Duplicate Responses
Depending on how you set up your survey, you can prevent duplicate responses before you even start collecting data.
- If you know your respondents, email the survey to respondents. Qtip: To ensure no one can use the anonymous link, change your survey access to By invitation only.

- If you know your respondents or use single sign-on (SSO) in your organization, use an authenticator with the option to retake disabled.
- When using prevent multiple submissions with an anonymous link, choose an end survey or redirect option. Qtip: When using an anonymous link, enabling duplicate detection won’t instantly delete duplicates, but it will strengthen your data quality by allowing you to delete duplicates after data collection ends.
Poor 24 Hour Completion Rate
If a respondent doesn’t finish their survey within 24 hours of starting, chances are they won’t come back to finish the survey. The more this happens, the more likely it is that something about the way the survey is written or formatted is driving respondents away.
Your survey can only be flagged as having a poor completion rate after you have collected at least 100 completed responses. (This excludes incomplete responses and responses in progress.) Poor completion rate also won’t be flagged if no responses have been started in the last 24 hours. (This includes completed responses, incomplete responses, and responses in progress.) This ensures there won’t be a false positive for poor completion when your study stopped collecting responses months ago.
When 24 Hour Completion Rate is Flagged
A survey is determined to have a poor completion rate by calculating the following:
(Number of surveys started 24 hours from current time and completed) / (Number of surveys started 24 hours from current time)
- Minor: Only 1 to 9% of responses started within the last 24 hours have not been completed.
- Moderate: 10 to 20% of responses started within the last 24 hours have not been completed.
- Severe: 21% or more of responses started within the last 24 hours have not been completed.
Revising Your Survey
Poor completion rates can mean that there’s an issue with how the survey was built. When revising your survey to improve completion rate, it’s important to take into account what iQ Score ExpertReview initially assigned to your survey. The following pages contain advice on all of the issues ExpertReview flags.
Poor Overall Completion Rate
The worse a survey’s completion rate is, the more likely it is that something about the way the survey is written or formatted is driving respondents away.
Your survey can only be flagged as having a poor completion rate after you have collected at least 100 completed responses. (This excludes imported responses, incomplete responses and responses in progress.)
When Overall Completion Rate is Flagged
A survey is determined to have a poor completion rate by calculating the following:
(Total number of complete survey responses) / (Total number of recorded responses + Total number of responses in progress)
Qtip: In this case, the numerator (complete survey responses) refers to responses that have ended because the respondent clicked through until the end of the survey. Responses in progress that were manually closed do not count. Manually closed responses in progress are included in the denominator.
- Minor: Only 1 to 9% of responses started within the last 24 hours have not been completed.
- Moderate: 10 to 20% of responses started within the last 24 hours have not been completed.
- Severe: 21% or more of responses started within the last 24 hours have not been completed.
Revising Your Survey
Poor completion rates can mean that there’s an issue with how the survey was built. When revising your survey to improve completion rate, it’s important to take into account what iQ Score ExpertReview initially assigned to your survey. The following pages contain advice on all of the issues ExpertReview flags.
Response Contains Sensitive Data
Qtip: What is considered sensitive data is set by your Brand Administrator in a Sensitive Data Policy.
Sometimes a response will contain sensitive information about a respondent. This can be anything from a phone number to a Social Security Number. Every organization has its own standard of content that it considers sensitive, and there are times where you may want to exclude this data from your dataset because the information respondents have provided is too sensitive to include in your analysis.
Depending on your brand’s settings, sensitive information may also be redacted from the response. In this case, sensitive information will be replaced with asterisks, and you will have no way of retrieving what the sensitive information was. Whether you include responses with redacted information in your analysis is up to you.
Qtip: Information that has been edited to be censored is not flagged as sensitive content, and thus will not be included in ExpertReview filters. Imported responses will also be excluded from redaction.
Preventing the Collection of Sensitive Data
Although respondents may provide sensitive information in an open-ended response without prompting, the best way to prevent sensitive data violations is to make sure you’re not asking for personal information. See Resolving Sensitive Data Issues for more on how to remove these kinds of requests from your survey.
If you are a Brand Administrator, consider adding redaction to your Sensitive Data Policy. This can help ensure your survey creators do not have access to sensitive information about their respondents. You can choose which sensitive topics are redacted and which are not.
Ambiguous Text
Attention: This feature is currently not available for all customers.
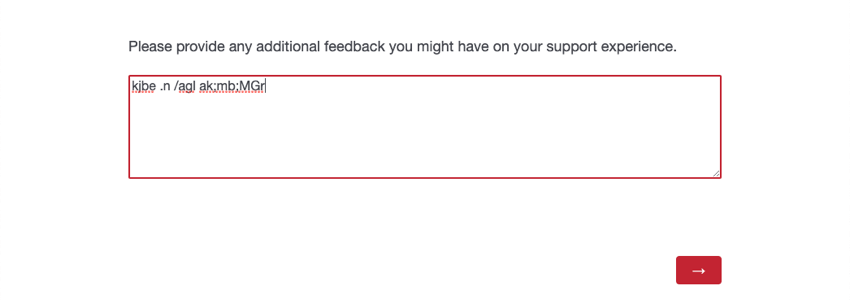
Respondents who enter ambiguous text into text entry fields will be flagged. Ambiguous text includes “gibberish,” or cases where the respondent typed random letters and / or symbols to respond to a question. Ambiguous text can be detected in English (US, UK), Spanish (ES, ES-ES), French (FR, FR-CA), German (DE), Portuguese (PT, PT-BR), and Italian (IT). Answers provided in another language and answers that contain acronyms (e.g., CX) are not flagged.
Preventing Ambiguous Responses
While there is no way to completely prevent this behavior, there are ways to encourage respondents to give higher quality answers to open-ended questions.
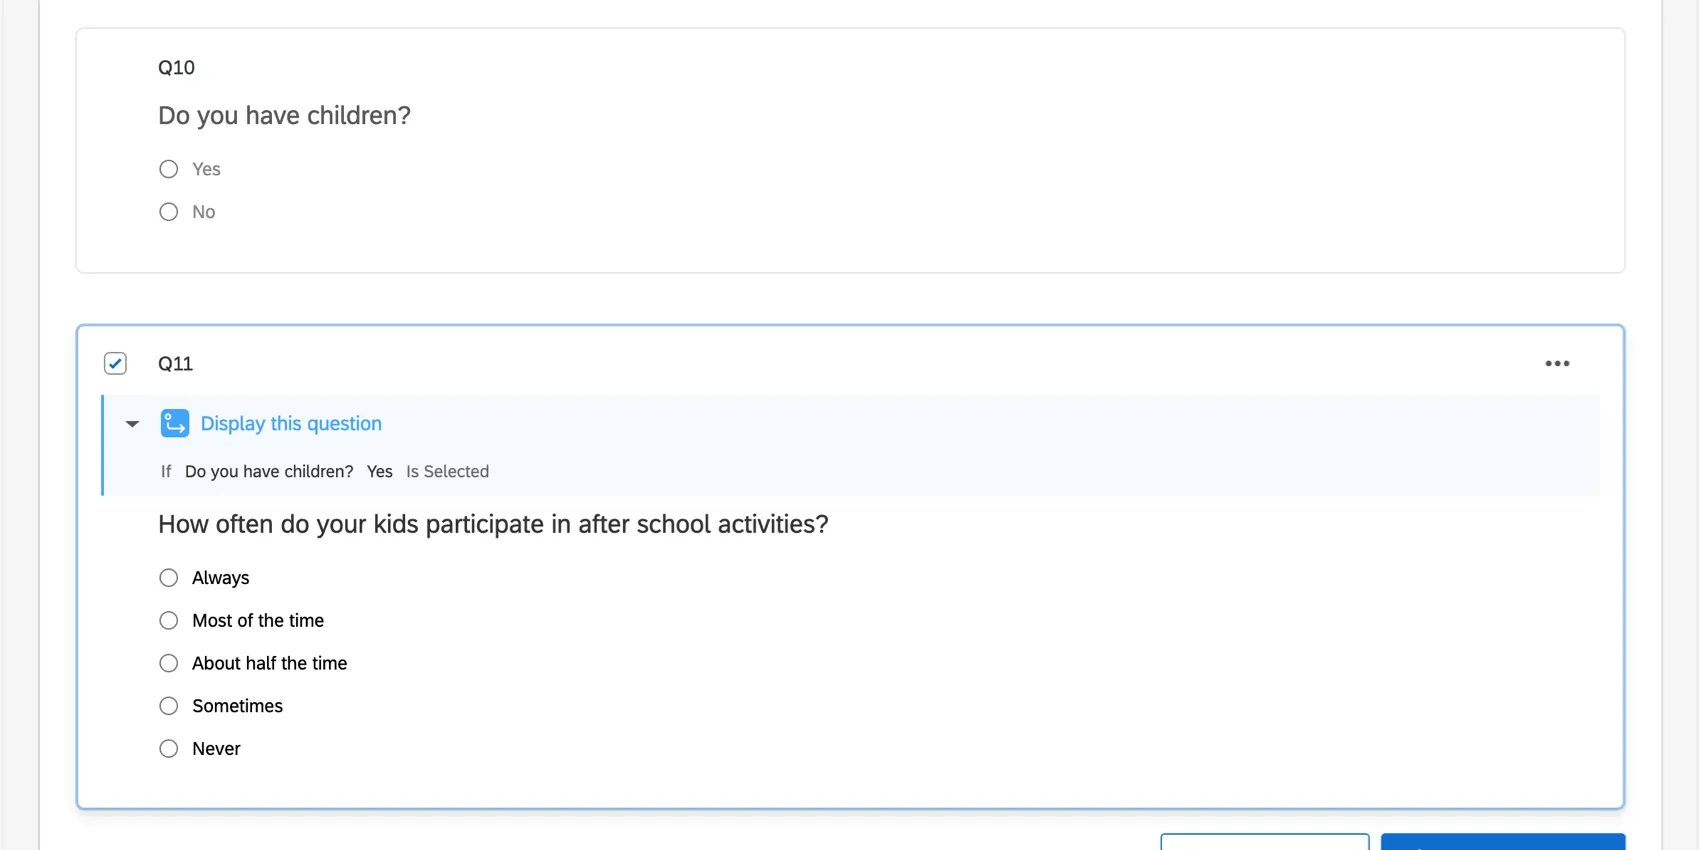
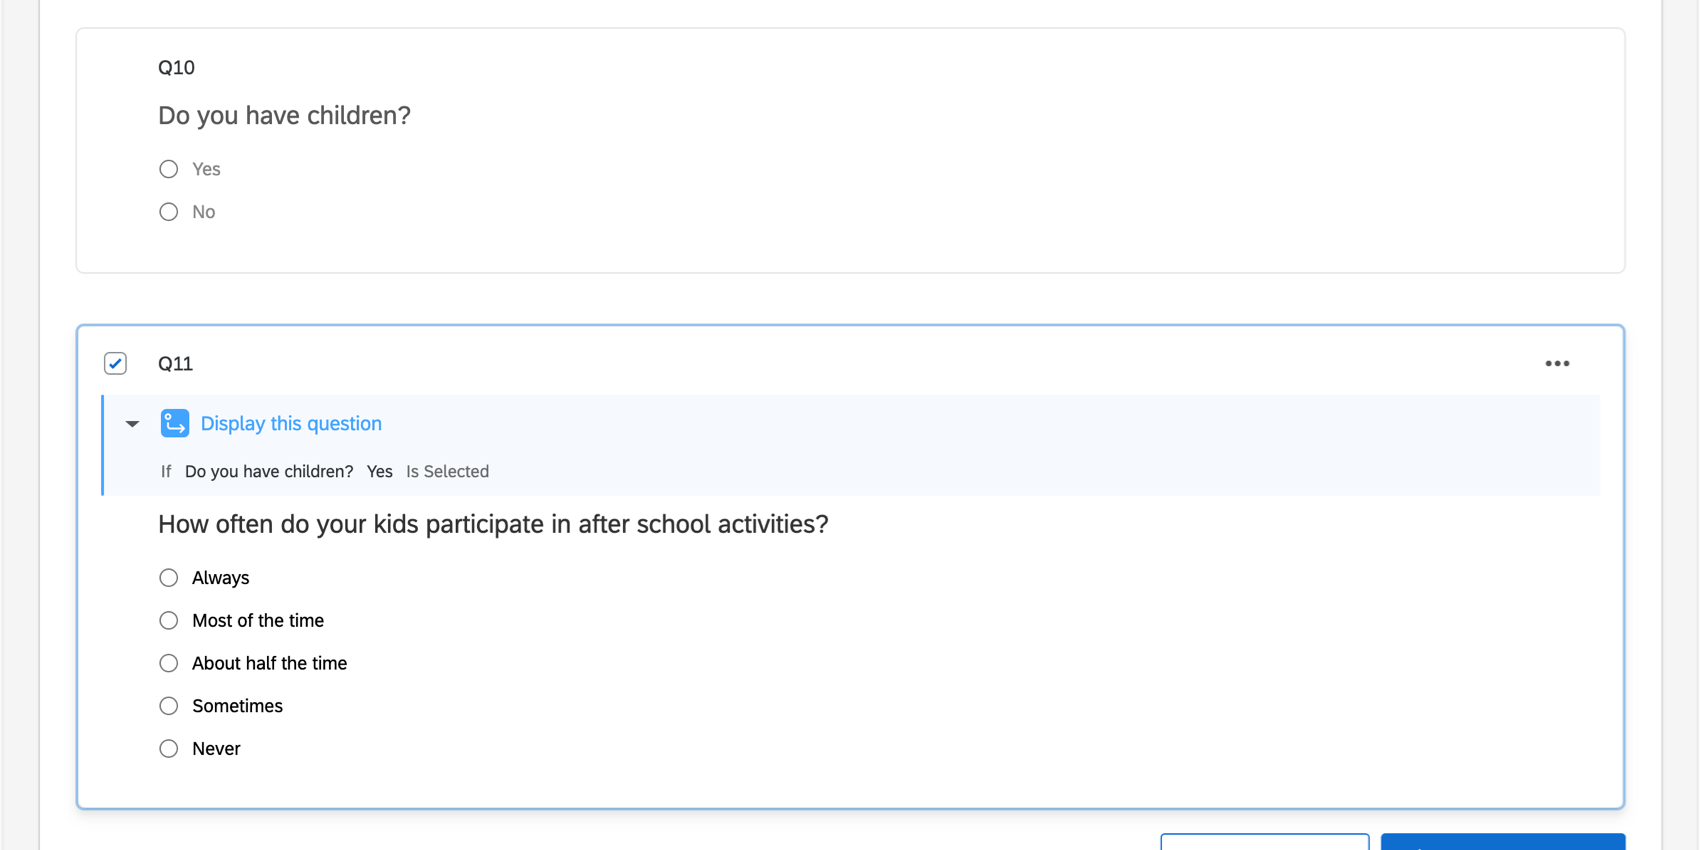
- Hide questions that may not apply to all respondents: Sometimes respondents will enter ambiguous text because you have forced the response, but the content of the question isn’t relevant to them. For example, if you’re surveying a general population, but start asking your respondents questions about their children, there are probably people taking the survey to whom these questions don’t apply. You can hide questions about children in the household if you start with a general question (Do you have children?) and then use the respondent’s answer to configure branch, display, or skip logic on the following questions.
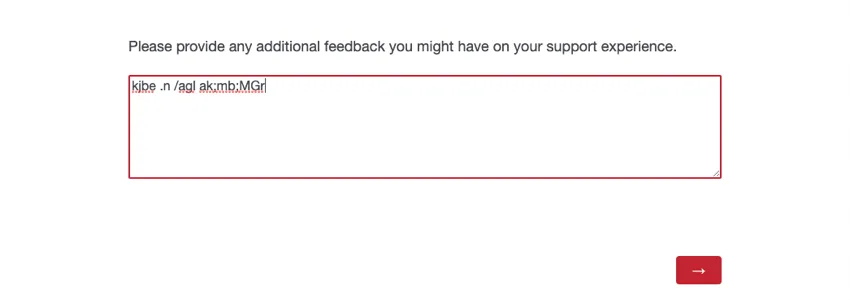
- Make sure your question isn’t too general: When you provide respondents with a text entry field, they often need guidance on what kind of data you’re looking for. If the prompt is too broad, respondents may not know how to respond. Example: “Are there additional comments you’d like to provide?” is not nearly as specific as “Is there additional feedback you’d like to provide on your experience with support?” The latter specifies that you are not looking for general product or company feedback, but feedback on a specific experience with your support team.

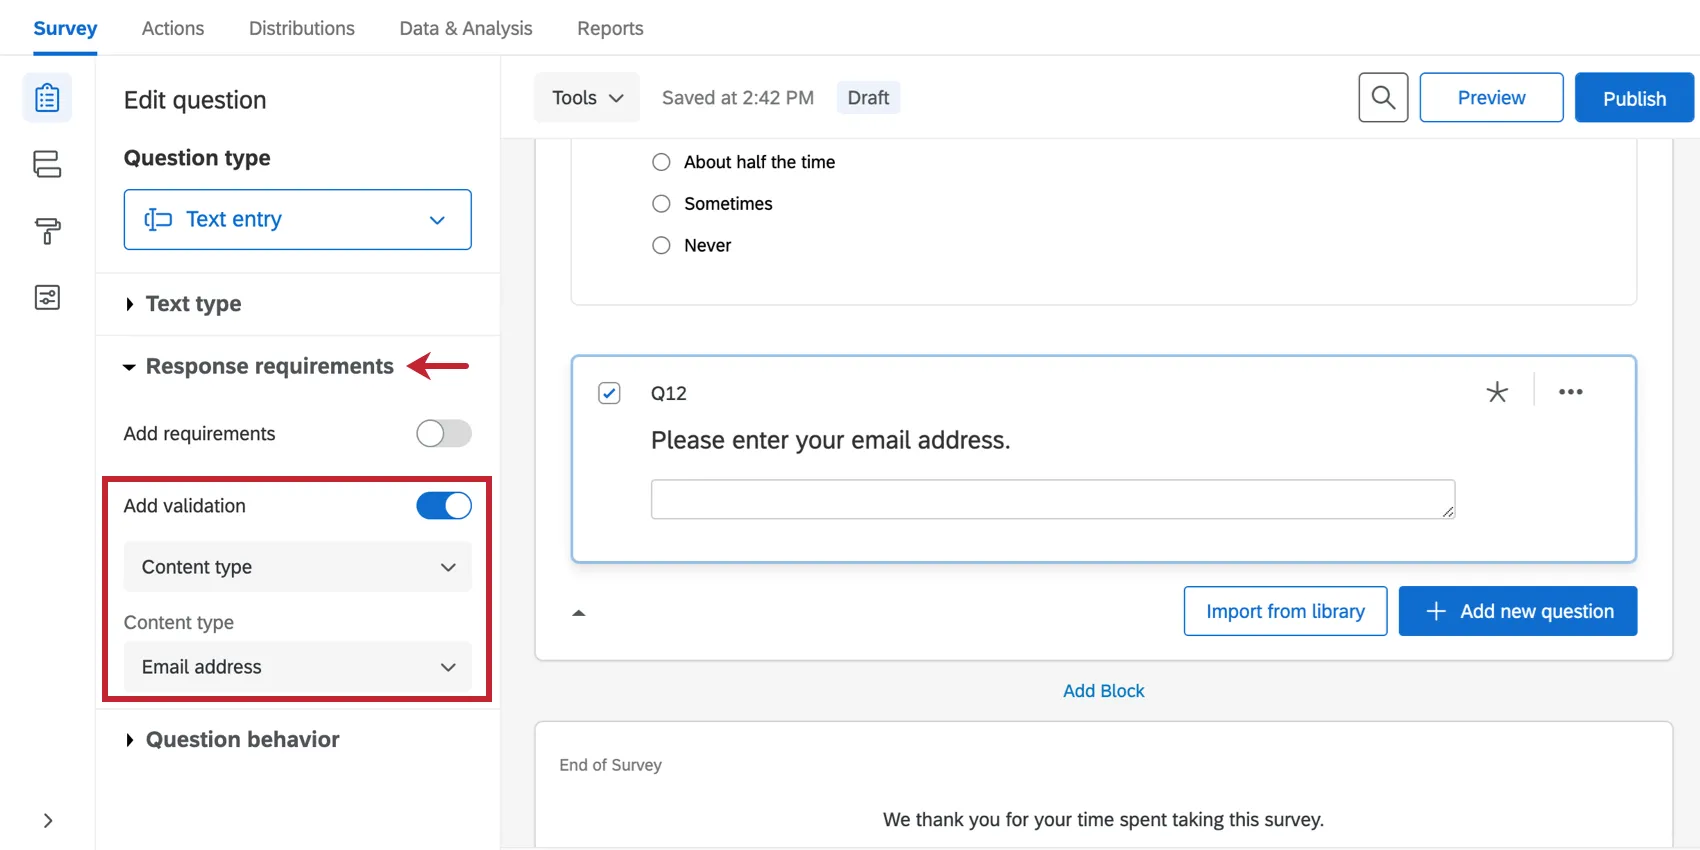
- If applicable, require that responses fit a certain format: For example, if you’re asking for an email address, you can add content validation to your question.

Flagging Responses that contain Ambiguous Text
Although ExpertReview will not flag these kinds of responses by default, you can turn this on with the following steps:
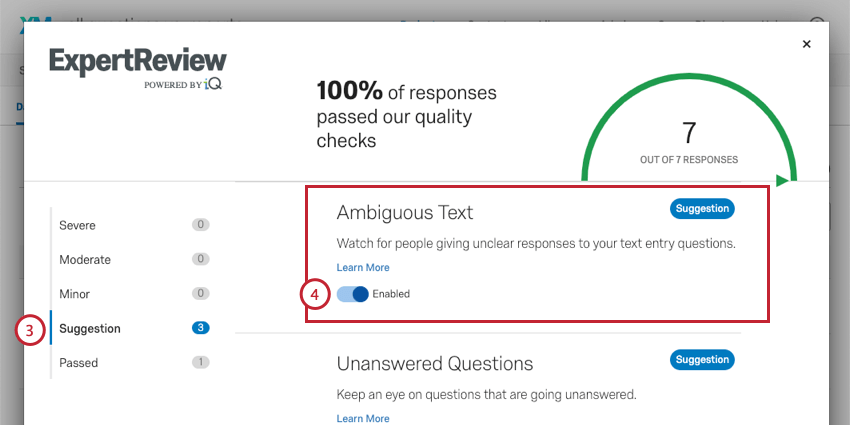
If you do not want to flag responses based on this metric, you can disable this setting using the same steps. When you enable this analysis, it’s only for the survey you are currently in, not all surveys in your account, so you can customize response quality analysis as needed.
Identifying Questions with ambiguous responses
Regardless of whether the response was flagged, you can get more specific information whether or not there was ambiguous text in a response, and the specific questions affected. To view your data right inside Qualtrics:
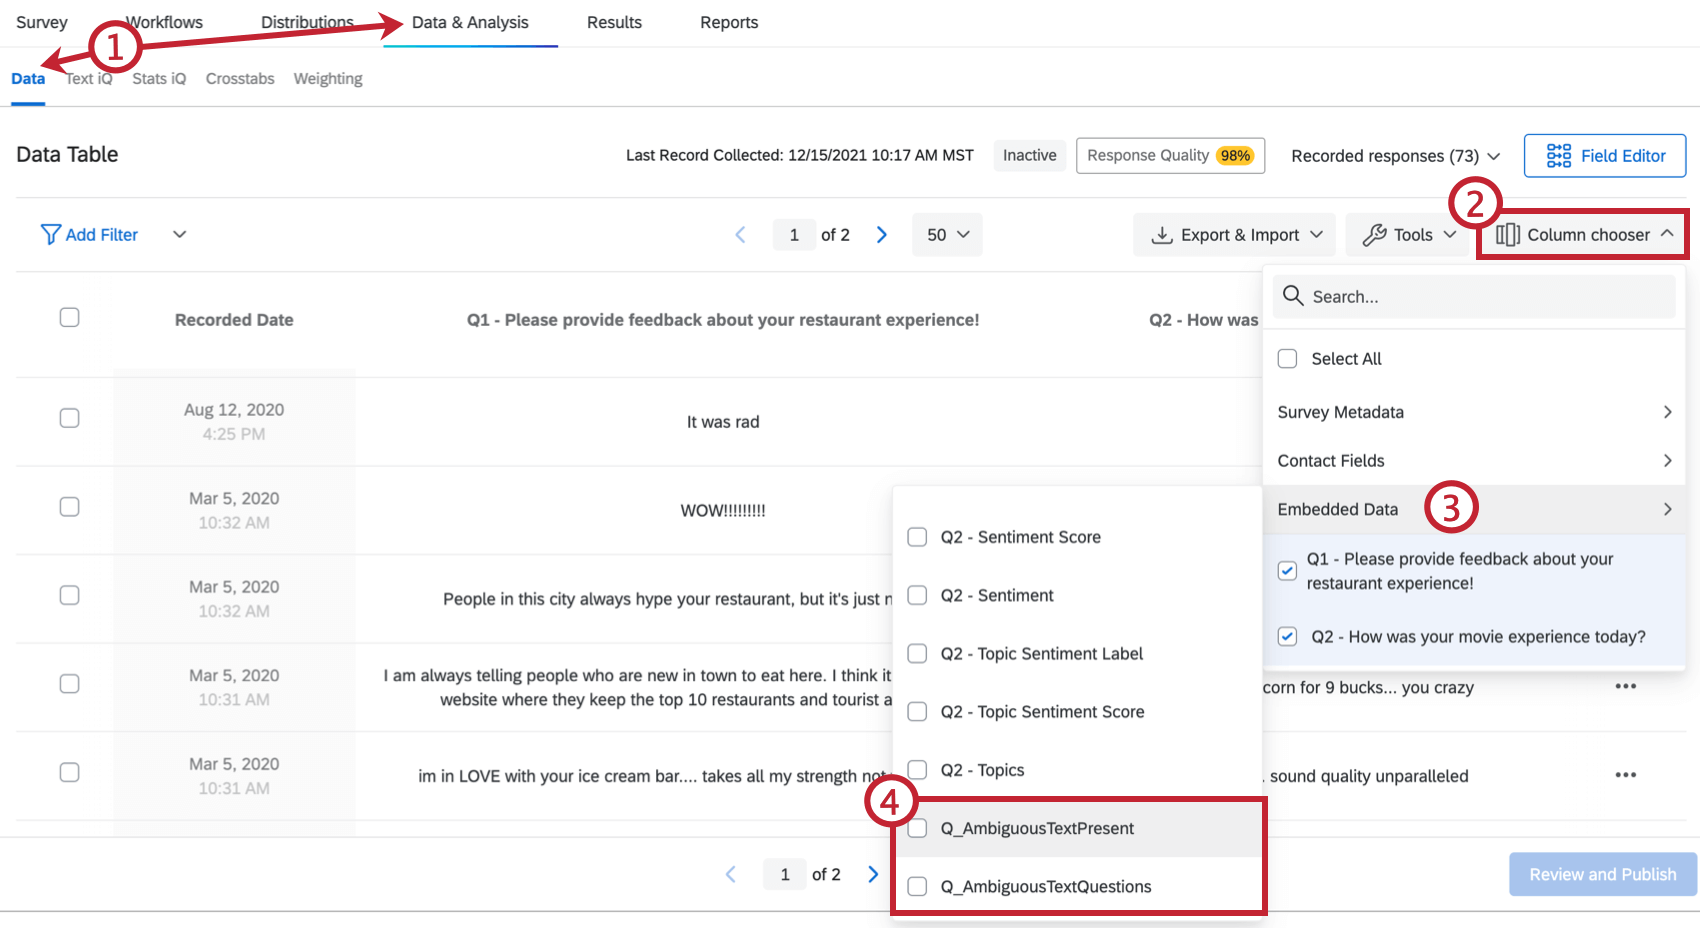
- Q_AmbiguousTextPresent: Whether or not there was ambiguous text in the survey response. This can be in response to any open-ended question in the survey. 0 indicates no, and 1 indicates yes.
- Q_AmbiguousTextQuestions: The specific questions that received an ambiguous response. This is given as an internal QID, not the editable question number. Qtip: To find QIDs, auto number your questions with Internal ID Numbering. You can always switch the numbering back later, or elect not to publish these changes.
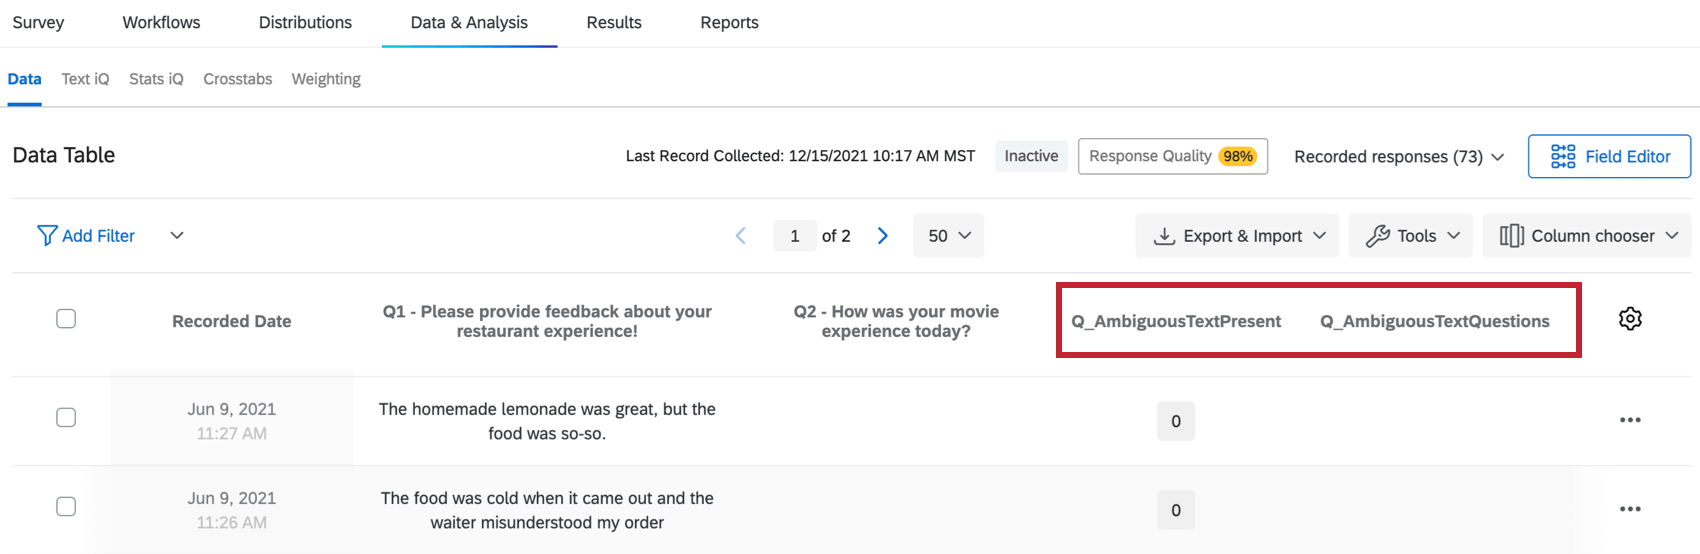
Qtip: Even without following the directions aboveQ_AmbiguousTextPresent and Q_AmbiguousTextQuestions will be included in your data exports. You can also use these fields to filter your data.
Pattern of Unanswered Questions
Attention: This feature is currently not available for all customers.
Responses will be flagged if the survey-taker did not answer a lot of the questions, even though they saw them. Responses are flagged when 30% or more of the seen questions were left unanswered; that way, little mistakes or the deliberate decision to skip one irrelevant question isn’t flagged.
Qtip: Responses will not be flagged based on questions the respondent didn’t answer because they were hidden by branch, display, or skip logic. If the response is incomplete, pages of the survey that the respondent never saw do not get flagged.
Preventing Patterns of Unanswered Questions
If respondents are flagged for having a tendency to skip questions, it could be due to the following:
- Your questions are not relevant to the audience: Choosing your sample is an extremely important step in conducting research. If you distribute your survey to a very generalized audience, you may end up asking questions that the audience has no way of answering. For example, if you are surveying a population on the ergonomics of their workspace, you probably shouldn’t include respondents who are currently unemployed. If you do not have control over your distribution sample, consider setting up screen-outs to remove irrelevant respondents.
- Your questions are not clear: You may be asking the right questions, but your wording may be a little confusing to respondents. Try rewriting these questions to make them as short and as clear as possible. Make sure to use the active voice instead of the passive voice.
- The respondent is deliberately trying to end the survey as soon as possible: This can also be indicated by use of ambiguous text and straightlining. To encourage respondents to answer all the survey questions, consider adding validation to your questions. You can force respondents to answer each question, or have a message request that they go back to unanswered questions when they finish a page of the survey. Qtip: It’s also important to consider whether respondent fatigue is a factor.
Flagging Responses with a pattern of unanswered questions
Although ExpertReview will not flag these kinds of responses by default, you can turn this on with the following steps:
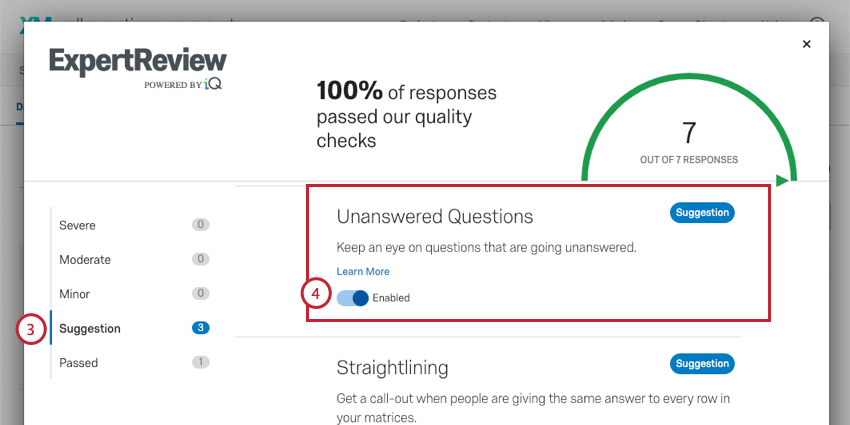
If you do not want to flag responses based on this metric, you can disable this setting using the same steps. When you enable this analysis, it’s only for the survey you are currently in, not all surveys in your account, so you can customize the response quality analysis as needed.
Identifying Questions respondents didn’t answer
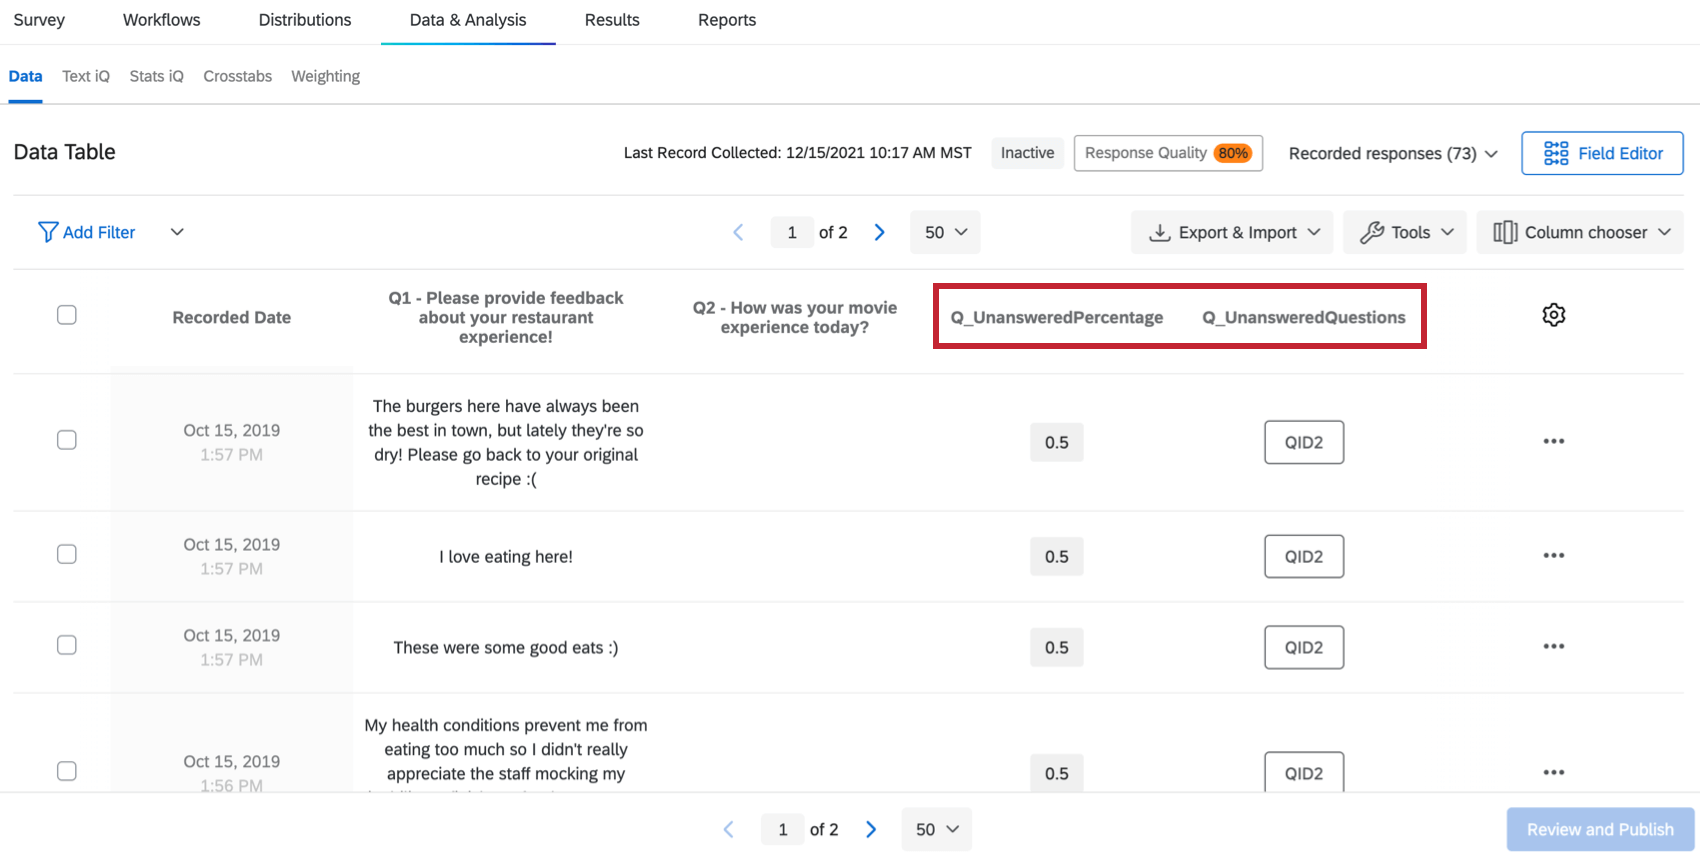
You can get more specific information on which questions were skipped, and what percentage of the questions in the survey were left unanswered, regardless of whether the response was flagged. To view your data right inside Qualtrics:
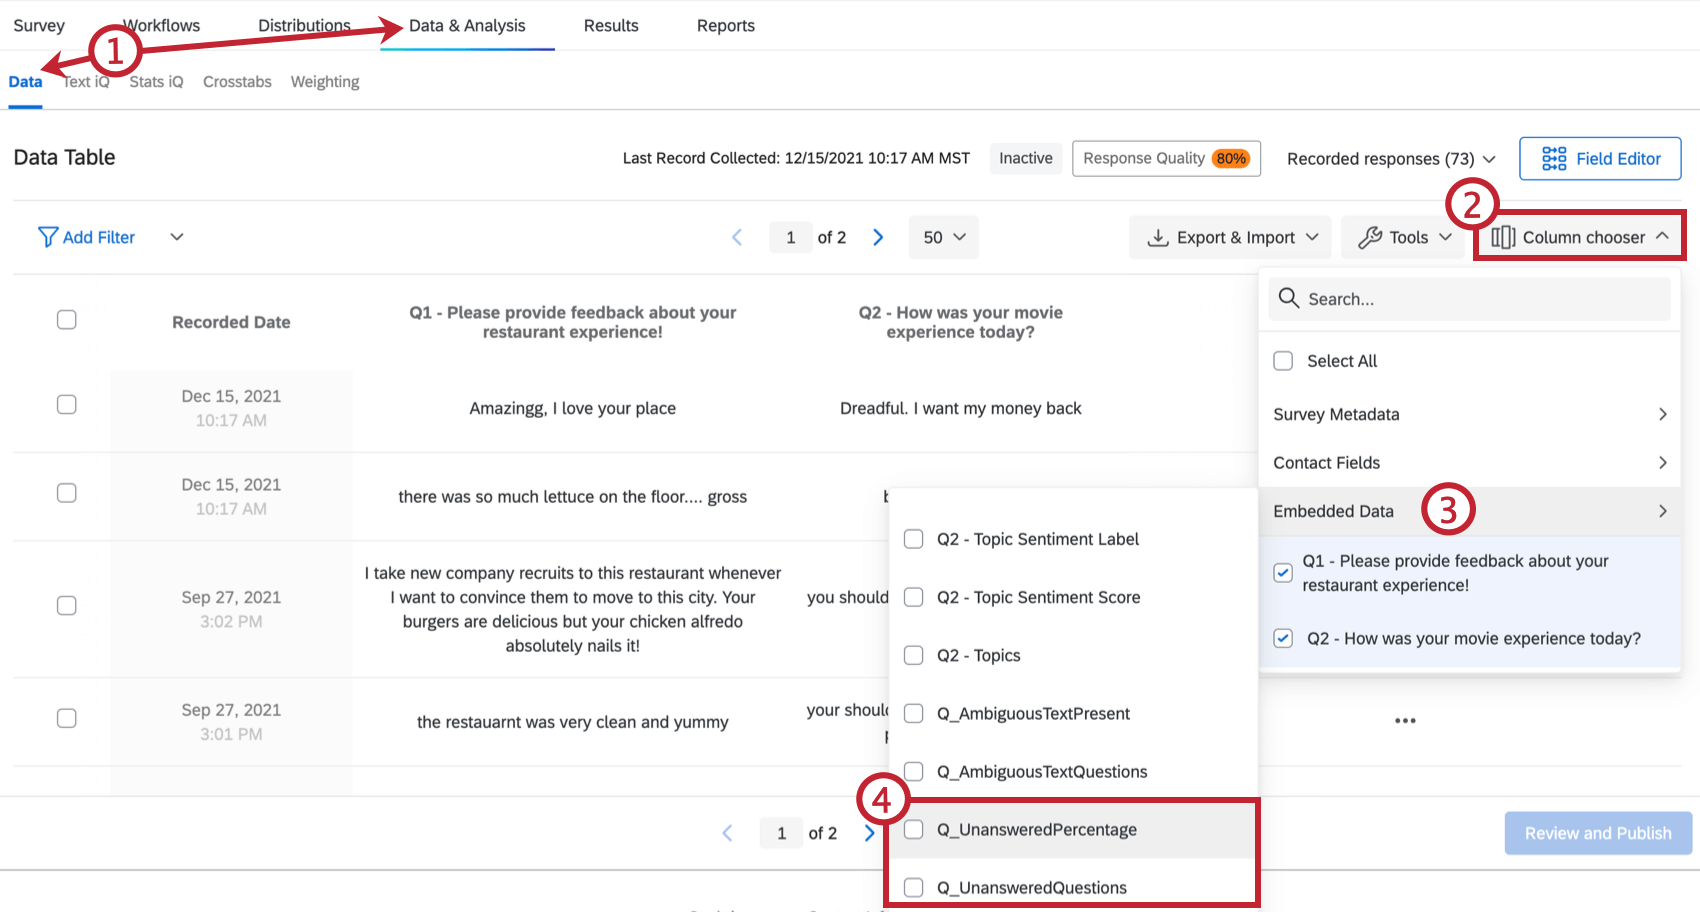
- Q_UnansweredPercentage: The percentage of questions in the survey that the respondent did not provide answer for. Only questions they saw are counted towards this value. This is presented as a ratio. For example, 100% is 1, and 66.7% is 0.667.
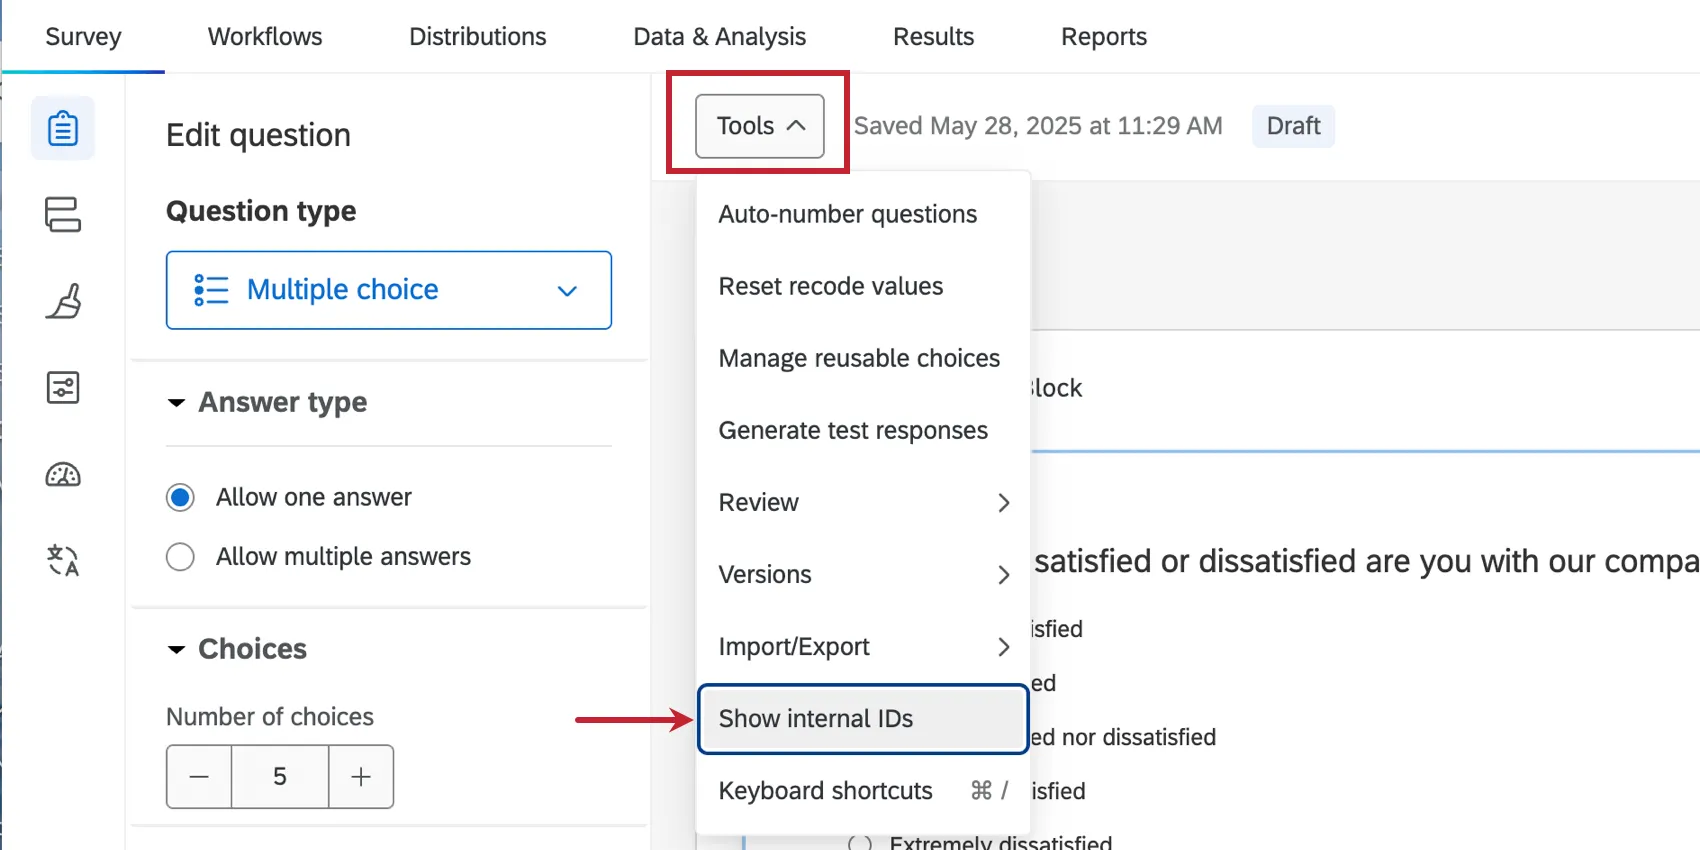
- Q_UnansweredQuestions: The specific questions that were not answered. This is given as an internal QID, not the editable question number. Qtip: To find QIDs, click the Tools dropdown in the survey editor, then select Show Internal IDs.

Qtip: Even without following the directions above, Q_UnansweredQuestions and Q_UnansweredPercentage will be included in your data exports. You can also use these fields to filter your data.
Straightlining
Attention: This feature is currently not available for all customers.
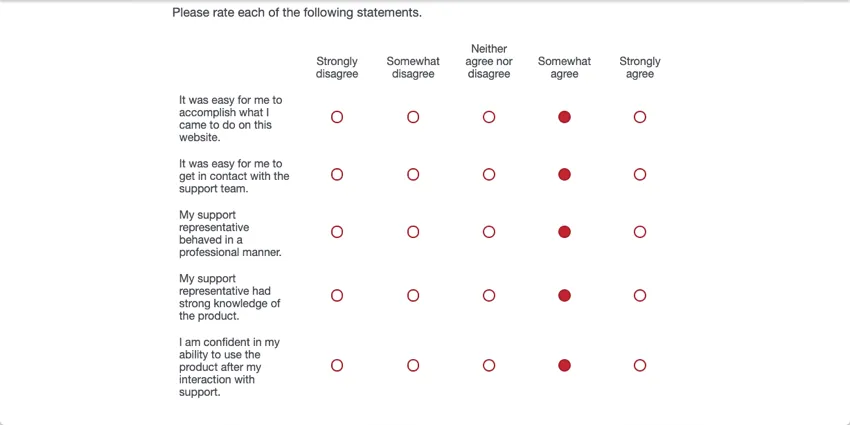
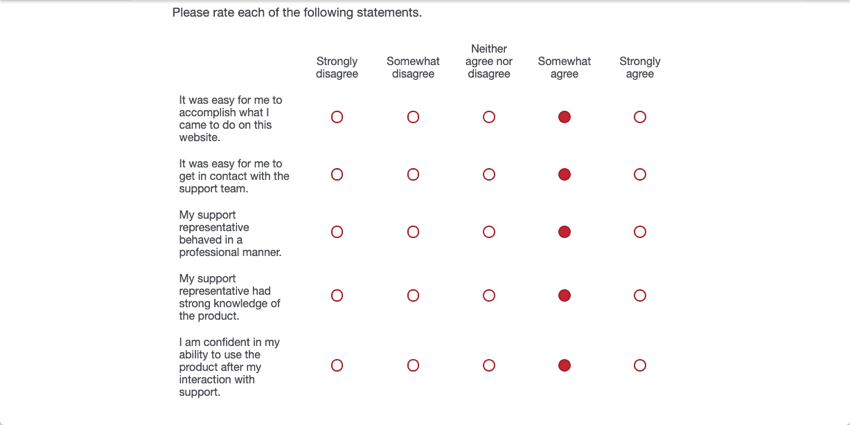
Straightlining is the practice of providing the same answers down a matrix table to quickly get through the questions. For example, a respondent may always choose the first answer to every statement, regardless of how they feel.
Respondents may straightline because they are fatigued, especially if they are not a speeder or a bot, and their responses at the beginning of the survey were normal.
Flagging Responses that contain straightlining
Although ExpertReview will not flag these kinds of responses by default, you can turn this on with the following steps:
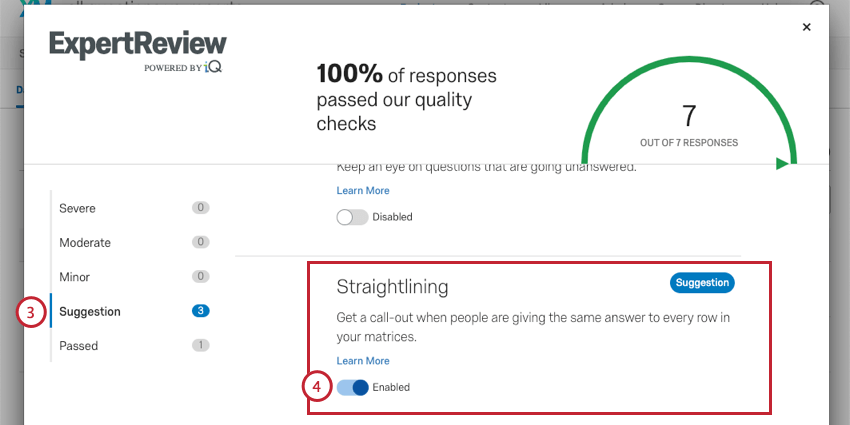
If you do not want to flag responses based on this metric, you can disable this setting using the same steps. When you enable this analysis, it’s only for the survey you are currently in, not all surveys in your account, so you can customize the response quality analysis as needed.
Identifying Questions where respondents straightlined
To be flagged as straightlining, a respondent must have both:
- Straightlined through at least 3 likert matrix tables (not statements, but the entire questions)
- Straighlined 80% of the matrix tables in the survey
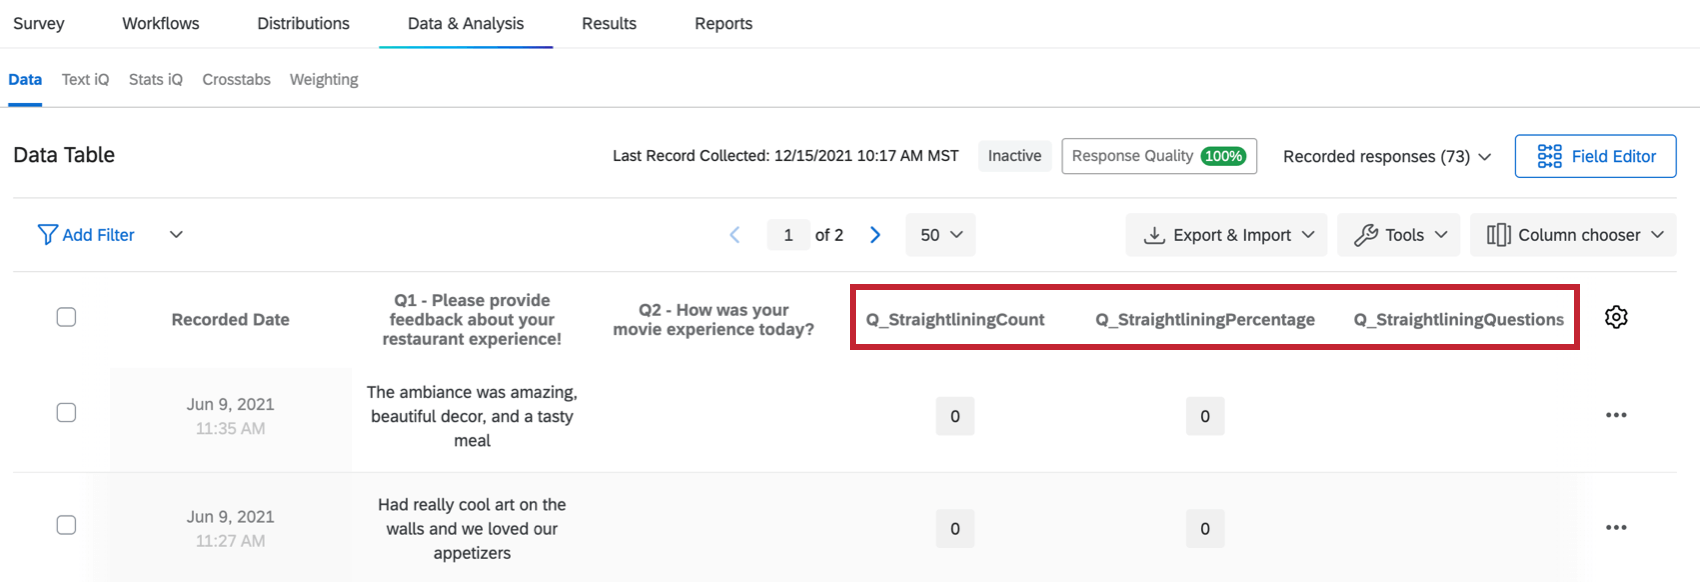
However, you can assess the number of straightlined matrices and which questions were straightlined through if you’d like to do a deeper analysis. To skim your data right inside Qualtrics:
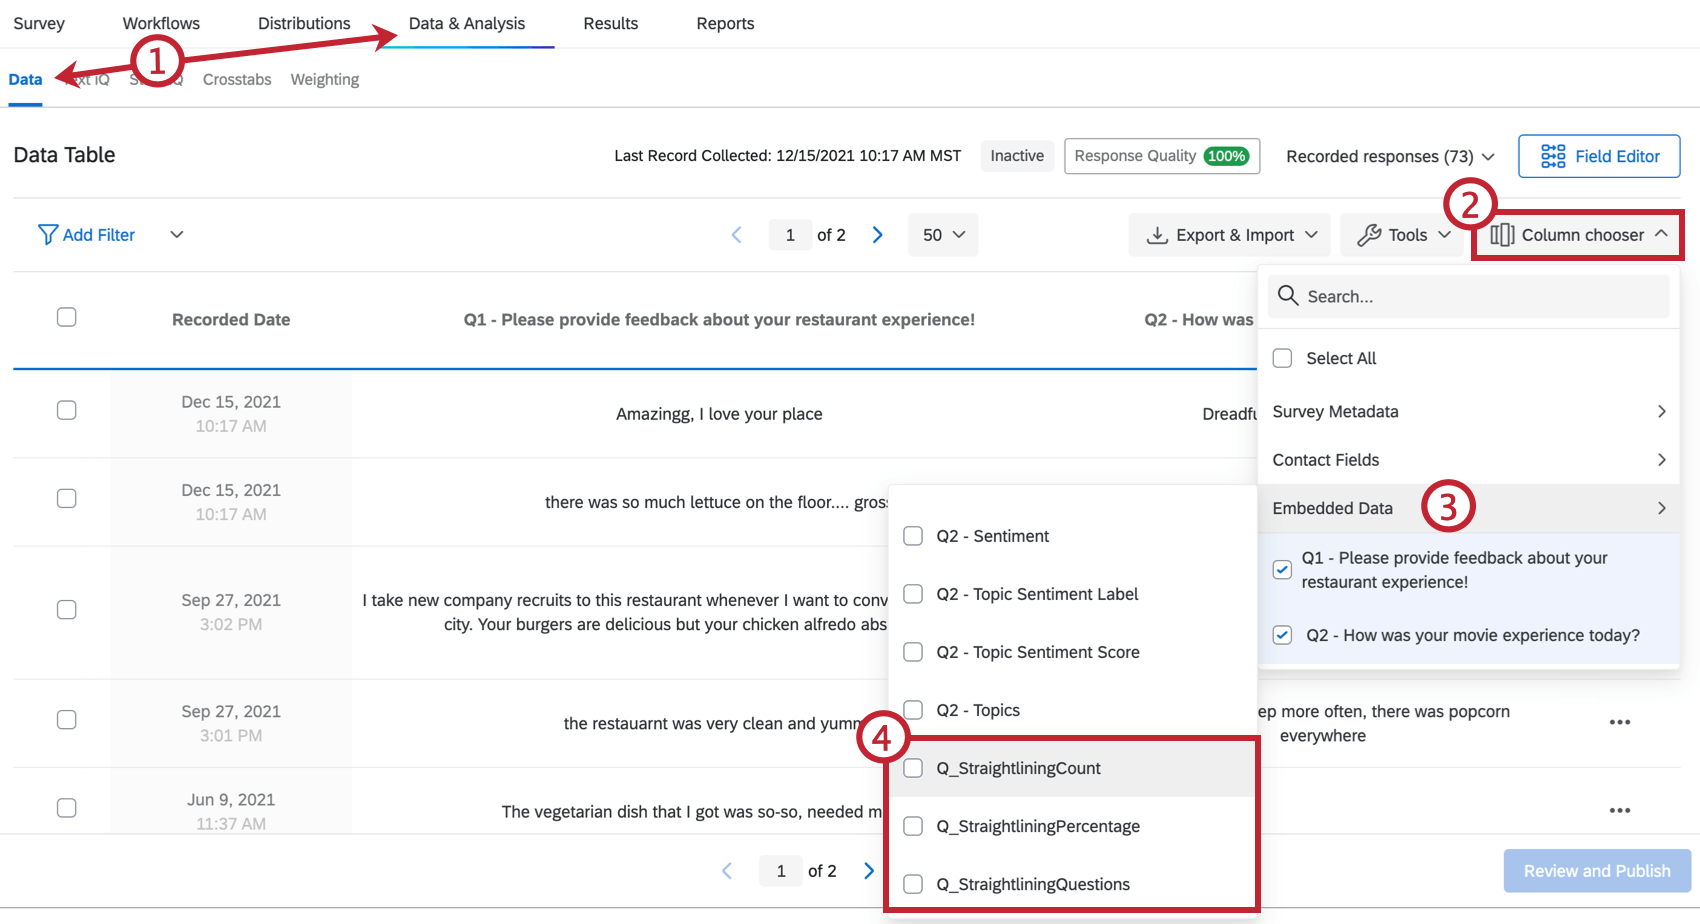
- Q_StraightliningCount: The number of matrix questions the respondent straightlined.
- Q_StraightliningPercentage: The percentage of matrix tables in the survey that the respondent straightlined. This is presented as a ratio. For example, 100% is 1, and 66.7% is 0.667.
- Q_StraightliningQuestions: The specific questions that were straightlined. This is given as an internal QID, not the editable question number. Qtip: To find QIDs, auto number your questions with Internal ID Numbering. You can always switch the numbering back later, or elect not to publish these changes.
Qtip: Even without following the directions above, Q_StraightliningCount, Q_Straightlining_Percentage, and Q_StraightliningQuestions will be included in your data exports. You can also use these fields to filter your data.
That's great! Thank you for your feedback!
Thank you for your feedback!